MENYA VILLAGE HEALTH SURVEY 2005
El-Zanaty& Associates
CHL Programs
Tulane University
MENYA VILLAGE HEALTH SURVEY 2005
Fatma El- Zanaty Mohamed El- Ghazaly Dominique Meekers
TABLE OF CONTENTS ACKNOWLEDGEMENTS ...............................................................................I EXECUTIVE SUMMARY ...............................................................................II 1
INTRODUCTION ....................................................................................1 1.1 1.2 1.3 1.4
2
3
SOCIOECONOMIC CHARACTERISTICS OF HOUSEHOLDS AND R ESPONDENTS .....................................................................................6 2.1 2.2
Household Composition.............................................................................6 Education of the Household Population....................................................6
2.3 2.4
Household Environment ............................................................................7 General Characteristics of Respondents ...................................................9
FERTILITY AND F AMILY PLANNING .....................................................13 3.1 3.2 3.3 3.4 3.5 3.6 3.7
4
5
Background ................................................................................................1 Organization and Objectives of the 2005 Menya Village Health Survey (MVHS)..........................................................................................1 Implementation of the 2005 Menya Village Health Survey......................2 Coverage of the Survey ..............................................................................4
Fertility Levels ...........................................................................................13 Fertility Preference ....................................................................................13 Attitudes toward Family Planning ............................................................16 Ever Use of Family Planning .....................................................................20 Current Use of Family Planning................................................................21 Discontinuation Rates ...............................................................................25 Intention to Use Contraception in the Future...........................................26
MATERNAL HEALTH............................................................................28 4.1 4.2
Care During Pregnancy.............................................................................28 Delivery Care .............................................................................................30
4.3 4.4
Postpartum Care........................................................................................32 Attitudes towards Maternal Health...........................................................33
CHILD H EALTH....................................................................................35 5.1 5.2 5.3 5.4 5.5
Immunization of Children .........................................................................35 Prevalence and Treatment of Diarrhea.....................................................36 Prevalence and Treatment of Acute Respiratory Infections ....................36 Breastfeeding and Supplementation..........................................................37 Vitamin A Supplementation among Children .........................................38
6
KNOWLEDGE, ATTITUDES, P ERCEPTIONS, AND PRACTICES RELATED TO HIV/AIDS, HEPATITIS C, AND SAFE INJECTIONS ..........................39 6.1 6.2 6.3
7
HEALTHY LIFESTYLES AND PASSIVE SMOKING ...................................45 7.1 7.2 7.3 7.4
8
9
Knowledge and Perceptions Related to HIV/AIDS ..................................39 Knowledge and Perceptions Related to Hepatitis C .................................41 Knowledge, Attitudes, and Practices Related to Blood Borne Diseases and Safe Injections.....................................................................................42
Hand Washing Practices............................................................................45 Performing Usual Activities.......................................................................46 Knowledge, Attitudes, Practices, and Perceptions Related to Smoking ..46 Attitudes Toward Passive Smoking...........................................................49
LEADERSHIP, HEALTH INFORMATION, AND SUPPORT FOR H EALTH IMPROVEMENT ....................................................................................52 8.1
Perceptions about Leadership Characteristics .........................................52
8.2 8.3 8.4 8.5 8.6 8.7 8.8
Perceptions about Actual Community Leaders ........................................52 Access to Health Information ....................................................................54 Attitudes related to Maternal and Child Health.......................................55 Attitudes related to Maternal Health ........................................................56 Willingness to Participate in Family Health Improvement Activities .....56 Perceptions about Families’ Ability to Avoid or Solve Health Problems 57 Perceptions about Community Health Problems .....................................57
FEMALE CIRCUMCISION ......................................................................59 9.1 9.2
Knowledge of Female Circumcision..........................................................59 Prevalence of Female Circumcision and Intention to Circumcise Daughters ...................................................................................................59
9.3 9.4
Support for Female Circumcision .............................................................59 Perceptions about Female Circumcision...................................................60
10 RECALL OF MESSAGES FROM INFORMATION, EDUCATION, AND C OMMUNICATION CAMPAIGNS............................................................63 10.1 Communication about Family Planning ...................................................63 10.2 Communication about Birth Spacing........................................................65 10.3 Communication about Pre- and Postnatal Care.......................................66 10.4 10.5 10.6 10.7 10.8
Communication about Healthy Lifestyles .................................................68 Communication about HIV/AIDS .............................................................69 Communication about Hepatitis Prevention.............................................70 Communication about Female Circumcision............................................71 Health Campaigns in Egypt.......................................................................72
11 CHL BEHAVIOR C HANGES C OMMUNICATION ACTIVITIES .................73 11.1 Recall of CHL Campaign Messages on TV...............................................73 11.1.1 Recall of CHL Campaign Messages from TV Programs .......... 73 11.2 Recall of CHL Campaign Messages from Printed Media ........................75 11.2.1 Recall of CHL Campaign Messages from Newspapers/ Magazines)................................................................................... 75 11.2.2 Recall of CHL Campaign Messages from Posters/flyers/ billboards .................................................................................... 75 11.3 Recall of CHL Campaign Messages from Seminars/Community Meetings ....................................................................................................77 11.4 Recall of CHL Campaign Messages from Visits.......................................77 11.5 Recall of the CHL “Mabrouk” book .........................................................78 11.6 Recall of Specific CHL Campaign Spots and Slogans ..............................78 11.6.1 Recall of the “Your Health is Your Wealth” Spot..................... 78 11.6.1.a Recall of the “Your Health is Your Wealth” TV Spot ..................................................................... 78
APPENDIX A DETAILED TABLES .................................................................83 3 4 5 6 7 8 9 10 11
Fertility and Family Planning ..................................................................83 Maternal Health........................................................................................110 Child Health ..............................................................................................124 Knowledge, Attitudes, Perceptions and Practices of HIV/AIDS, Hepatitis C and Safe Injections ................................................................129 Healthy Life Style and Passive Smoking ..................................................148 Leadership, Health Information and Support for Health Improvement 167 Female Circumcision ................................................................................188 Recall of Messages from Information, Education, and Communication Campaigns.................................................................................................196 CHL Behavior Change Communication Activities..................................225
APPENDIX B QUESTIONNAIRES ..................................................................251 HOUSEHOLD QUESTIONNAIRE .................................................................. 251 WOMAN’S QUESTIONNAIRE........................................................................ 259 HUSBAND’S QUESTIONNAIRE ..................................................................... 323 YOUTH QUESTIONNAIRE (15-24).................................................................367
APPENDIX C SURVEY STAFF .................................................................. 403
ACKNOWLEDGEMENTS The Menya Village Health Survey (MVHS) is a panel study involving more than one round of follow-up interviews with respondents in seven focal villages. The baseline MVHS survey was conducted in 2004 and in 2005 the first follow up survey was carried out with all respondents who were interviewed in the baseline. MVHS 2005 data provide monitoring indicators of the Communication for Healthy Living (CHL) program in Egypt. MVHS 2005 was conducted in seven villages of El-Menya governorate under the auspices of the Ministry of Health and Population (MOHP) with funding from the United States Agency for International Development (USAID), as part of the external evaluation of the impact of its global Health Communication Partnership (HCP). This survey could not have been implemented without the active support and dedicated efforts of a large number of institutions and individuals. Support from the Ministry of Health and Population (MOHP) was instrumental in completing the implementation of the survey. We would like to thank Dr. Hanem Abdel-Azeem, First Undersecretary for Technical Support and Projects and Head of Sector for Technical Support and Projects for her approval, and Dr. Emam Moussa, Head of Central Administration for Technical Support, for his support and interest in the survey results. The 2005 MVHS survey could not have been implemented without the administrative and technical support of the Health Communication Partnership. In particular, we thank Mr. Ron Hess, HCP Chief of Party in Egypt for his input and support. I would also like to thank Dr. Tawhida Khalil, Senior Communication Advisor at the CHL program. We are deeply grateful to Tulane University experts who contributed to the successful completion of this project, especially Dr. Dominique Meekers, Professor in the Department of International Health and Development, Tulane University, and HCP Associate Director for Summative Evaluation whose active support and insight throughout the survey was important for the success of the survey. Special thanks are also due to Dr. Douglas Storey, HCP Associate Director for Program Research & Communication Science. This survey could not have been conducted in such a timely fashion without the combined efforts of the senior, office and field staff in the MVHS team. We would like to express our appreciation for the dedication and skill with which they performed their tasks. Finally, we would like to express our appreciation to all respondents who participated in the survey; without their patience this project would have been impossible.
i
EXECUTIVE SUMMARY The Menya Village Health Survey (MVHS) is a panel study involving a baseline and more than one round of follow-up interviews with respondents in selected villages of the Menya governorate. The baseline survey was conducted in 2004 and in 2005 the first follow up survey was carried out with the same respondents who were interviewed in the baseline. The aim of the panel study is to monitor implementation of the Communication for Healthy Living (CHL) program and to provide data that can be used to modify (if needed) the design of the CHL program in the focal areas. A second follow-up survey is planned for 2007. Together, these three waves of data collection will provide an evaluation of the impact of the CHL program in Egypt. CHL is a five-year effort of the Ministry of Health and Population (MOHP) with funding from USAID. This report presents the results of the 2005 follow up survey in seven focal villages in Menya governorates These villages are: Zohra, Saft El Khamar El Sharkia, Nazlet Hussein Ali, Monshaat El-Maghalka and Koloba in the Menya district of Menya governorate, Two control villages (Toukh El-Khail and Ebshedat in the Malawi district of Menya governorate (which did not receive the community-based component of CHL) were also surveyed. The study included interviews with 2073 ever married women (15-49 years), 1891 husbands, and 1716 never married youth (15-24 years) in 2,168 households. Some key findings are summarized below. Fertility Preference Ideal number of children. Respondents in the different groups were asked about the ideal number of children they would like to have. In general, husbands want on average more children (3.6 children ) than women and male youth do (3.0 children), while never married female youth want the least number of children (2.5 children ). Premarital and newly wed examination. There were wide differences in knowledge about premarital examination and newly wed examination between the different respondent groups. Data from the 2005 MVHS show that awareness about premarital and newlywed examinations is around 70% for women and husbands, but higher among never-married female youth and lower among never-married male youth. Among women who were aware of these examinations, only a very small percentage (less than 1%) had ever had them. The same pattern was observed among husbands. Among youth who were aware of premarital examinations, about 40% of females and males intend to have a premarital examination. Need for family planning. Around one-quarter of all women in the 2005 MVHS sample have an unmet need for family planning, with 11% of this need representing a need for child spacing and 13% a need for limiting family size. The total met need for family planning is 51%, consisting of 41% who are currently using contraceptives to limit their family size and 10% who report a desire to delay or space the next birth. Family Planning Approval of family planning use. Almost all respondents (98% or more) approve of married couples using family planning with more than 90% of all respondent groups (except male youth) saying that it is appropriate to start use after having the first child. Male youth were a little less likely (83%) to agree with that timing. Female youth are more likely than other groups to approve of using family planning to delay the first birth: only about 11% of married women, husbands and male youth say it is appropriate to adopt family planning before the first birth compared to 18% of female youth. Knowledge of fertile period. Knowledge about the fertile period is limited, with only 42% of all ever-married women, and 44% of husbands knowing about the fertile period. This knowledge is ii
significantly lower among never-married youth (23% of females and 14% of males). Also, knowledge of the fertile period varies across villages. Ever and current use of family planning. Among married women, 71% have used some form of contraception at some point in time. Around two-third of all women had tried a modern method, and 22% had ever used a traditional method. The most commonly used modern methods are the pill (41%) and injectables (40%), followed by the IUD (31%). Around three-quarter of husbands have ever used a method and 70% of that is modern method use. Around half of all currently married women are using a FP method, with 46% using modern methods and 5% using traditional methods. Almost 20% of married women are currently using injectables, followed by the IUD (13%) oral pills (10%).The level of contraceptive use differs somewhat across villages. Husbands are slightly more likely than women to report current use of contraceptives: more than half of husbands (55%) report that they or their wives are using a method Source of family planning methods. The data show that 64% of users obtained their method from a private sector source, while 35% obtained their method from the public sector, although this varies considerably by method with oral pills most likely to come from the private sector and IUDs and injectables to come from the public sector. Discontinuation rates. Four in ten users stopped using a method within 12 months of starting use. Some of this discontinuation is for positive reasons (e.g., 4% stop because they want to become pregnant), but some is for negative reasons (e.g., about 2% of users stop due to method failure, 20% because of side effects or health concerns). About 15% stop for other reasons. Future use of family planning. Never married youth were most likely to say they intend to use family planning in the future. Among non-using women and husbands, 73% and 69%, respectively say they intend to use FP in the future. Being subfecund was the most common reason for nonuse of family planning mentioned by women (34%). Being menopausal or having had a hysterectomy (28%) or fearing side effects (14%) were also common reasons. Maternal Health Antenatal care coverage. Around two-thirds of mothers received at least some medical care during pregnancy, mainly from a doctor. About half of mother went for four or more antenatal checkups. Knowledge and intention to do antenatal care. 80% or more of husbands, never-married female youth, and never-married male youth were aware of antenatal care for pregnant women, and roughly 90% or more of husbands and male youth say that pregnant women should obtain antenatal care during pregnancy. Delivery care. Data indicated that 57% of mothers deliver their babies at home, and 35% of the deliveries were assisted by the daya , and 13 % of all deliveries were caesarean deliveries. About half of all husbands thought that women should give birth in a medical facility, as did three quarters of never-married female and male youth. Postpartum care for the mother. Two-third of mothers did not have any postpartum care and only 19% of mothers received a postnatal checkup within 2 days of giving birth. Almost all postnatal checkups were conducted by a doctor. Women in the control villages of Toukh El Khail and Ebshedat were less likely than women in the treatment villages to have had postpartum care. Postpartum care for the newborn. Around half of newborns (51%) did not receive any care after delivery. Fewer than one fifth (16%) received postnatal care within 2 days of birth and 13% within 3-7 days of birth. Except for Koloba, treatment villages had higher rates of postpartum care for newborns compared to control villages.
iii
Child Health Immunization coverage. 85% of children are considered fully immunized against all preventable childhood diseases; that is, they have received a BCG, the three doses of DPT, the three polio doses, and the measles immunizations. There are no significant differences in immunization coverage between boys and girls (84% versus 86%, respectively). Some differences in immunization coverage were associated with lower maternal education level and work status. Prevalence and Treatment of Diarrhea. Around one-fifth of children were reported to have diarrhea in the 2-week period prior to the survey. Mothers sought advice or treatment from a health provider in 64% of the diarrheal episodes. Around 43% of children with diarrhea received oral rehydration therapy (either ORS packets or RHS at home) to prevent dehydration, and more than 60% received either ORT or increased fluids during diarrheal episodes Prevalence and Treatment of Acute Respiratory Infections. 9% of children were reported to have a cough with short, rapid breathing during the 2-week period prior to the survey. Threequarter of those children received some medical treatment from a health provider for this illness, while 19% of those children did not. The most common form of treatment received for respiratory illness was antibiotics (53%). Breastfeeding and Supplementation. Slightly more than two-third of children were breastfed within the 1 st day after birth, but exclusive breastfeeding drops off within the first two months of life: only 69% of infants under 2 months of age and 56% of those aged 2-3 months received only breast milk. Median duration of any breastfeeding is 6.9 months, while the medians for exclusive breastfeeding and predominant breastfeeding are 2.7 months and 5.4 months, respectively, Vitamin A Supplementation among Children. About two-third of children aged 12-23 months had received a vitamin A capsule. Children who are later than 3 rd in the birth order and those whose mothers have less than primary education and are not working are less likely to receive vitamin A than other children. Knowledge and Modes of Transmission of HIV/AIDS, Hepatitis C and Safe Injection Knowledge and modes of transmission of HIV/AIDS. Awareness of HIV/AIDS is around 90% for husbands, never-married female and male youth, about 10 percentage points higher than among women (79%). Television was the most common source of knowledge by far among all groups. There is, however, a lack of sufficient knowledge about the modes of transmission, especially with regard to mother-to-fetus transmission, which was mentioned by only 3% of respondents (5% for male youth). Knowledge and Perceptions Related to Hepatitis C. Television was the most commonly mentioned source of information about Hepatitis C among all groups, and about 60% or more of all respondents were aware of Hepatitis C. However, even among those who had heard of Hepatitis C a large number lack sufficient knowledge about the modes of transmission. The most commonly mentioned mode of transmission was from an infected needle, followed by blood transfusion. Knowledge, Attitudes, and Practices Related to Blood Borne Diseases and Safe Injections. 56% of ever-married women, and 68% of husbands had heard about blood borne diseases that can be transmitted through used syringes. The most commonly mentioned way to prevent infection from needles was “not to share or reuse needles” followed by” purchase disposable syringes for the provider to use”. About two-thirds of women and husbands and about half of never-married female and male youth had ever purchased or obtained a syringe for use at home and 15% of women, 13% of husbands, 15% of never-married male youth, and 15% of never-married female youth reported having reused a syringe at least once. Most people simply throw away a used syringe without destroying it
iv
Community Leaders Knowledge of actual community leaders. Respondents from all groups were asked if there was someone that they considered to be a leader in their community, that is, someone people respect and who can mobilize people to do things for mutual benefit. Only 32 % of never-married male youth, 27 % of husbands, 20 % of women, and 16 % of never-married female youth said they could identify someone in the community who matched this description. Female Circumcision Levels and attitude. Female circumcision remains high in Menya; 87% of women and 70% of the never-married female youth reported that they had been circumcised. But this trend may be starting to change. Only 4 in 10 husbands and women who have daughters reported that they have at least one circumcised daughter. In addition, 54% of husbands, 48% of women and 40% of never married females say that they intend to have their daughters circumcised in the future. However, 76% of never married males say they intend to have their daughters circumcised. Support for female circumcision. Around two thirds of women and husbands and three quarters of, never-married male youth indicated that the practice should be continued, compared with 40% of never-married female youth. The most common reasons indicated by all respondents were that the practice is required by religion and is a good tradition. Recall of Health Messages Family planning messages. Ever-married women and never-married female youth (71% and 66%) are more likely to recall having seen family planning messages in the six months before the survey than are husbands and never-married male youth (54% and 56%). Recall of messages about use of contraception after the first child was lower; about 30% of ever-married women and 32% of never-married female youth were able to recall messages about this compared to 18% for husbands and 15% for never married male youth. Only about 25% of married women and 30% of husbands reported ever talking to their spouse about family planning. Maternal and neonatal health messages. Recall of maternal health messages was also limited. The results show that 30% of ever-married women and 32% of never-married female youth had seen or heard messages about optimal birth spacing in the past six months compared to 18% for husbands and 15% for never- married male youth. Only 18% of married women, 10% of husbands, 17% of never married females and 4% of never married males reported seeing or hearing any messages about safe pregnancy precautions. Similarly low percentages had seen or heard messages about postpartum and neonatal checkups for women and their newborns: 13% of married women, 8% of husbands, 15% of never married females and 6% of never married males recalled such messages. Health messages about passive smoking. Roughly one quarter of all ever-married women, husbands, and never-married females reported receiving information about the health effects of passive smoking in the 6 months preceding the survey, but only 10-20% of these people talked to others about passive smoking. HIV/AID messages. Awareness of HIV/AIDS is relatively high among all respondent groups: 79% of married women and 88% of never-married female youth had ever heard about AIDS. AIDS awareness among males is higher, reaching 92% for husbands and 91% for never-married male youth. Television is virtually the universal source of HIV/AIDS messages with over 90% of all respondents saying that they got their HIV/AIDS messages from television. Health messages about safe injections. Overall, exposure to safe injection messages is relatively low. About 40% of women and about 30% of men reported receiving information about safe injections. Respondents in control villages were somewhat less likely to have seen or heard messages on this topic compared to respondents in intervention villages.
v
Female circumcision messages. Two thirds or more of all respondents were able to recall messages about female circumcision; 72% of ever-married women, 64% of husbands, 72% of never-married female youth, and 73% of never-married male youth said they had received information about female circumcision from television. Level of Comfort Discussing Health Information Use of family planning and maternal health. The majority of respondents feel comfortable discussing family planning, safe pregnancy, and how to keep babies health. For example, only 6% of ever-married women and 7% of husbands reported that they do not feel comfortable discussing family planning with anyone. The percentage of respondents who reported that they would not feel comfortable discussing safe pregnancy with anyone ranges from 9% among ever-married women to 16% among never-married female youth. Second hand smoking. Roughly 80 to 90% of all respondents were also comfortable discussing the health effects of second hand smoke; 82% of ever-married women, 86% of husbands, 78% of never-married females, and 96% of never-married males said they were comfortable discussing the dangers of smoking and how to quit the habit with other people. HIV/AIDS prevention. On the other hand, 36% of ever-married women and 25% of husbands reported not feeling comfortable discussing this subject with anyone. Likewise, 32% of nevermarried females and 13% of never-married males do not feel comfortable discussing HIV/AIDS prevention with others. Preventing unsafe injection. The majority of respondents feel comfortable discussing safe injection practices (over 80% for each of the four target groups). The four target groups appear to be most comfortable discussing this subject with service providers. Behavior Change Communication Activities Recall of specific CHL campaign messages and learning from TV programs. Among married women and female youth the CHL messages that were most likely to be remembered were about birth spacing, limiting childbirths and the dangers of passive smoking. Female youth also had relatively high levels of recall for messages about antenatal care. Recall of all these types of messages was somewhat higher in intervention than in control villages, Husbands and male youth were most likely to recall messages about birth limiting and passive smoking Husbands and male youth were most likely to report learning something new from the television programs about protecting non-smokers from the dangers of second hand smoke and, to a lesser extent, something about family planning methods and the importance of birth spacing. Married women were most likely to report learning about the importance of birth spacing and about contraceptive methods, while female youth were most likely to report learning something new about contraceptive methods and, to a lesser extent, about birth spacing. The self-reported effect of these television messages on male and female youth was a stronger intention to use family planning after marriage. Recall of CHL campaign messages from newspapers or magazines. The data show that only a limited percentages of all respondents cite newpapers or magazines as their source of information on health topics. Female youth are most likely of all respondent groups (6%) to report reading about health issues in newspapers or magazines in the past year, followed by husbands and male youth (4%) and married women (2%). Recall of CHL campaign messages from posters, flyers or billboards. Results indicate that 13% of both women and unmarried female youth, 6% of husbands and only 4% of unmarried males cite posters, flyers or billboards as a source of health information in the past year. Married women and female youth.were most likely to say that they had learned about the importance of family planning and antenatal care in good health practice from these information sources, while husbands and male youth were most likely to say that they had learned about the importance of family planning. All four respondent groups most often reported seeing these messages at a health facility.
vi
Recall of CHL campaign messages from seminars or community meetings. Recall of messages from community meetings is very low overall. Only 5% of women and around 2% of all other groups of respondents had attended seminars or community meetings about family planning or reproductive health during the 12 months preceding the survey. However, respondents—especially married women—in intervention villages were more likely than respondents in control villages to report community meetings or seminars as a source of health information. As much as 16% of married women in the intervention villages of Saft Al Khamar, 12% in Nazlet Hussein Ali, 8% in Zohra and 7% in Koloba reported community meetings as a source of FP/RH information, compared to only 1% in the control villages of Toukh El Khail and Ebshedat. Recall of CHL campaign messages from home visits. Overall about 8% of married women said that they were visited by a Raida Refia or a health worker, who was most likely to talk to them about family planning and antenatal care. Married women in intervention villages were more likely to report this source of health information than were women in control villages. For example, over 20% of married women in Saft Al Khamar reported a visit by a health worker compared to 1% in Toukh El Khail. Recall of the CHL “Mabrouk” book. Overall only about 4% of married women, 3% of female youth, 2% of husbands and only 1% of male youth said that they had seen the “Mabrouk” book, but less than 1% of women in control villages compared to 7% in intervention villages had seen it. Recall of the “Your Health is Your Wealth” (Sahetak Sarwetak) television spot. Around 40% of all respondents, except husbands (23%) reported seeing the “Your Health is Your Wealth” television spot in the 12 months preceding the survey, but recall was not appreciably different in control compared to intervention villages, as would be expected since the reach of mass media does not depend on localized outreach activity. Respondents were most likely to say that the spot was about family health care and family planning and, to a lesser extent, birth spacing and antenatal care. Respondents from all groups were most likely to report that they had learned about the importance of caring for the family’s health and were most likely to say that the spot had made them care more about caring for “my health and my spouse’s health.” Recall of the “Family Doctor” TV Spot. Relatively few respondents reported seeing the “Family Doctor” TV spot during the last 12 month. Female respondents are more likely than males to report that they saw the spot. About one in five women and unmarried females (19% each), 10% of husbands and 6% of unmarried male youth said that they had seen the spot Recall of the “Ask Consult” (Isaal Istashir) Campaign. Females are more likely (63% of unmarried female youth, and 55% of women) than males (42% of husbands, 47% of male youth) to recall hearing or seeing messages from the Isaal Istashir campaign. People who recalled Isaal Istashir messages were most likely to say that the campaign advised people to consult a doctor or pharmacist if they had health problems or questions about their health; 26% of married women, 18% of husbands, 35% of female youth and 19% of male youth recognized this theme. Other messages that came through from the Isaal Istashir campaign included the promotion of facilities with the Isaal Istashir logo and the promotion of family planning methods.
vii
INTRODUCTION 1.1
1
Background
Communication programs in Egypt, for many years, played a vital role in improving the health status of all Egyptians. Among those programs, the Communication for Healthy Living Program (CHL) is implemented as part of the Health Communication Partnership (HCP), which is funded by the United States Agency for International Development (USAID). The CHL program aims to: • Achieve broad scale behavioral change for health at the individual, family, and community levels in Egypt by July 2008. • Strengthen leadership around health issues. • Improve the capacity of Egyptian health systems and organizations to conduct sustainable and strategic health communication programs. To achieve those goals, the CHL program provides support across the following health areas: family planning and reproductive health, maternal and child health, infectious disease control, healthy lifestyle, household preventive health, and health maintenance practices. The CHL program works at both the national and local level. The program started in selected focal villages in Menya governorate in 2004, and then expanded its activities to Fayoum and Qena in 2005. The Menya health survey is a panel study involved more than one round of follow-up interviews with respondents in the selected Menya villages. A baseline survey was conducted in 2004 and in 2005 the first follow up survey was carried out with the same respondents that were interviewed in the baseline. The aim of the panel study is to monitor program implementation and to provide data that can be used to modify (if needed) the design of the CHL program in their focal areas. Indicators derived from this round can be compared with the baseline and subsequent survey waves to assess the reach and impact of the program. This report presents the results of the 2005 follow up survey that is conducted in several villages in Menya, which is one of the target areas for the CHL project. The follow up survey focuses almost on the same areas that were of interest in the baseline which are; respondents’ knowledge and practices in areas related to family planning/reproductive health, healthy lifestyles, healthy mother/healthy child, and infectious diseases.
1.2
Organization and Objectives of the 2005 Menya Village Health Survey (MVHS)
The 2005 Menya Village Health Survey (MVHS 2005) was conducted in seven villages of the Menya governorate under the auspices of the Ministry of Health and Population (MOHP). The survey was funded by the United States Agency for International Development (USAID), as part of the external evaluation of the impact of the Health Communication Partnership (HCP). Tulane University’s Department for International Health and Development (Tulane/IHD), School of Public Health and Tropical Medicine, has been selected as the external evaluator for the HCP program. The external evaluation of the HCP partnership will comprise in-depth evaluations of a selected number of HCP programs, including the Communication for Healthy Living (CHL) program in Egypt. El-Zanaty & Associates implemented the survey, with limited technical assistance from Tulane/IHD. 1
The goal of research and monitoring efforts is to assess the reach and impact of the CHL program activities on the family members’ values, attitudes, intentions, and health competency; to encourage life-stage appropriate health behaviors; and to increase demand for and utilization of health information and services. The 2005 MVHS was designed to provide estimates for key indicators such as contraceptive use, immunization levels, coverage of antenatal and delivery care, maternal and child health nutrition, infectious diseases, and other aspects of healthy life. The survey results are intended to assist the technical staff at the CHL project to modify and design new communication strategies and activities for improving the health status of Egyptians. The third survey wave is scheduled to be conducted approximately 18 months after the current wave.
1.3
Implementation of the 2005 Menya Village Health Survey
The 2005 MVHS was executed in three stages. The first stage took place in August 2005, and involved questionnaire review and finalization, training of field staff and the interviewing of eligible households and individual respondents. The second stage involved all data processing activities necessary to produce a clean data file, including data entry, verification of the data, editing, and coding, as well as consistency checking and tabulations. This stage started soon after the beginning of the fieldwork and lasted through the end of October 2005. The focus of the final stage of the survey was data analysis and report preparation. This phase began in December 2005 and took about 2 months. Sample As previously mentioned, this is a follow up survey in Menya governorate. The survey collected data from ever-married women in the age group 15-49 years, from husbands, and from nevermarried male and female youth aged 15-24 years. The following instructions were taken into consideration: 1- Women who were interviewed in MVHS 2004 but reached age 50 before the 2005 interview were excluded. 2- If a woman was interviewed in 2004, but got divorced or died, then her husband was excluded from the 2005 survey. 3- If a woman was widowed, divorced, or separated in the baseline, and since re-married, then her new husband was not interviewed. 4- Youth who were interviewed in the baseline, but we now 25 or older and still single were interviewed. 5- Youth who were interviewed in the baseline but who since got married were included. However, they were interviewed using the Husband/Woman version of the questionnaire. 6- For youth who got married before the 2005 survey, their husbands/wives were also interviewed. Questionnaires The 2004 MVHS involved two types of questionnaire: a household questionnaire and an individual questionnaire. The individual questionnaire was developed in three different versions, for women, husbands, and never-married youth. The 2005 MVHS included same questionnaires with limited modifications: 1- The household questionnaire: A new short household questionnaire included only information about the eligible persons interviewed last year was developed. However, in case, there are some one moved or changed his residence (within the same village) the full form of household questionnaire used in the baseline was applied including add four new questions related to water purification. 2- Individual questionnaires: The individual questionnaires mainly covered the same topics; however, there were some differences according to which version was administered. The follow-up questionnaires were almost identical to the baseline
2
questionnaires with limited changes. However, there were intensive changes in the woman’s questionnaire, especially for birth history, family planning, and child health sections. For the birth history, only updates to the birth history since the last interview were included. Also, a family planning use history was asked only for the period since the last interview. For child health, the same information asked in the baseline was also asked but for newly born children only. Child immunization data were collected for births during the last three years. Some changes in all individual questionnaires were made, for example family planning knowledge table was excluded. Other questions on the reasons for changing behavior were added (see Appendix B). Data collection activities
Staff recruitment. To recruit interviewers and field editors, a list of interviewers and field editors who had worked with the firm on the 2005 EDHS and who worked in Menya baseline survey was prepared to identify those who were qualified to participate in the training. This action was taken to reduce the duration of training and to enhance the quality of the data. All candidates for the interviewer and field editor positions were university graduates and had intensive experience in DHS surveys. Another basic qualification was the willingness to work in any village covered in the survey.
Training materials. A variety of materials were developed for training personnel involved in the fieldwork. A lengthy interviewer's manual was prepared and given to all field staff. The manual presented general guidelines for conducting an interview as well as specific instructions for asking each of the questions in the 2005 MVHS questionnaires. Other training materials, including special manuals describing the duties of the team supervisor and the rules for field editing, were prepared. Supervisor and interviewer training. A special one day program for supervisors was conducted during the training and prior to the main fieldwork training. This training focused specifically on the supervisor's duties. Interviewer training for the 2005 MVHS data collection began in late July 2005. Ten supervisors and 35 interviewers participated in the training program. The training program was held in Cairo for around 3 weeks and included: • Lectures related to basic interviewing techniques and specific survey topics (e.g., fertility and family planning, maternal and child health, and female circumcision); • Sessions on how to fill out the questionnaire, using visual aids; • Opportunities for role playing and mock interviews; • Two days of field practice in areas not covered in the survey; • Three quizzes. Trainees who failed to show interest in the survey, who did not attend the training program on a regular basis, or who failed in the first three tests were terminated immediately. Each team was assigned to work in only one village, and as the supervisor's duties were limited, the supervisors were required to perform field editing. To supplement the experience gained from working in various earlier surveys (especially DHS), a special training session focusing on field editing duties was held for the supervisors.
Fieldwork. Fieldwork for the 2005 MVHS began in 20 th of August and last for two weeks. A total of 42 staff were responsible for the data collection. The field staff was divided into seven teams; each team was composed of a supervisor, a field editor, and four interviewers. Each team worked in only one village.
3
As soon as the main data collection was completed, a random sample of up to 5 % of the households was selected for re-interview as a quality control measure. Shorter versions of the 2005 MVHS questionnaires that were prepared in the baseline were also used in the follow up for the reinterviews. The visits to PSUs to conduct re-interviews also offered an opportunity to make callbacks to complete interviews with households or individuals who were not available at the time of the original visit. Special teams were organized to handle callbacks and re-interviews. During this phase of the survey, interviewers were not allowed to work in the village in which they had participated in the initial fieldwork. Callbacks and re-interviews began on September 20 th and were completed by end of September. Data processing activities
Office editing. Staff from the central El-Zanaty & Associates office were responsible for collecting questionnaires from the teams on a regular basis. Office editors reviewed questionnaires for consistency and completeness, and a few questions (e.g., occupation) were coded in the office prior to data entry. To provide feedback for the field teams, the office editors were instructed to report any problems detected while editing the questionnaires; these problems were reviewed by the senior staff. Machine entry and editing. The machine entry and editing phase began while the interviewing teams were still in the field. The data from the questionnaires were entered and edited on microcomputers using the Census and Survey Processing system (CSPro), which is a software package for entering, editing, tabulating, and disseminating data from censuses and surveys. Ten data entry personnel with 8 microcomputers processed the 2004 MVHS data. During the machine entry, 100% of each segment was reentered for verification. By working one shift 5 days per week, the data processing staff completed the entry and editing of data by the end of October 2004.
1.4
Coverage of the Survey
Table 1.1 summarizes the outcome of the fieldwork for the 2005 Menya Village Health Survey, by village. The table shows that, during the main fieldwork and callback phases of the survey, a total of 2168 households were interviewed in the follow up out of 2,219 (2093 still eligible in 2005, and 126 new households) households eligible in 2005 MVHS. In addition, 126 new households were added due to either movement of the entire household or eligible respondents since the previous interview. The response rate for households is around 100%. A total of 2360 women were eligible in 2005 in the seven villages. Out of those, 287 were newly eligible women (86 female youth got married, and 201 were wives of new husbands). The response rate for women was 97%. A total of 1,891 husbands were interviewed in the 2005 MVHS. The response rate for husbands was 95%. About 1700 youth were interviewed. Of those, 1089 were male youth with a response rate 96%, and 627 were female youth with a response rate of 99%.
4
Table 1.1 Sample coverage Number of households and eligible respondents by the result of interviews by focal village, MVHS 2005. Saft El Zohra Khamar
Nazlet Ebshedat Total Total without Hussein Toukh El Monshaat (C) all control Ali Khail (C) El Maghalka Koloba
Household Old household Household interviewed in 2004 Household not eligible in 2005 New household New household in 2005
328 22 23
15
22
28
8
15
15
126
83
Total household sampled Household interviewed Response rate
329 321 97.6
307 304 99.0
310 306 98.7
338 323 95.6
306 296 96.7
311 306 98.4
318 312 98.1
2219 2168 97.7
1563 1533 98.1
304 277
304 279
300 274
315 306
331 301
320 278
366 358
2240 2073
1559 1409
8
9
15
27
6
7
14
86
45
34
33
35
13
26
48
12
201
176
319 303 95.0
321 309 96.3
324 309 95.4
346 335 96.8
333 322 96.7
333 327 98.2
384 379 98.7
2360 2284 96.8
1630 1570 96.3
267 232
260 232
271 237
278 260
272 237
223 190
286 268
1857 1656
1293 1128
14 38
13 34
12 46
13 37
6 34
12 37
10 29
80 255
57 189
284 269 94.7
279 268 96.1
295 280 94.9
310 300 96.8
277 261 94.2
239 224 93.7
307 289 94.1
1991 1891 95.0
1374 1302 94.8
195
154
164
210
187
136
198
1244
836
186 183 98.4
144 135 93.8
141 141 100.0
180 175 97.2
176 167 94.9
128 126 98.4
183 162 88.5
1138 1089 95.7
775 752 97.0
124
97
84
120
122
90
118
755
517
101
78
66
99
107
76
105
632
428
101 100.0
78 100.0
66 100.0
99 100.0
104 97.2
74 97.4
105 100.0
627 99.2
423 98.8
Women Old women Women interviewed in 2004 Women still eligible in 2005 New women Female youth got married Eligible women for new husband in 2005 Total women sampled Women sampled in 2005 Women interviewed in 2005 Response rate Husband Old husband Husband interviewed in 2004 Husband still eligible in 2005 New husband Husband married from female youth Male youth got married Total husband sampled Husband sample in 2005 Husband interviewed in 2005 Response rate Youth Male youth Male youth interviewed in 2004 Male youth eligible(still not married) in 2005 Male youth interviewed in 2005 Response rate Female youth Female youth interviewed in 2004 Female youth eligible (still not married) in 2005 Female youth interviewed in 2005 Response rate
330 38
327 39
328 18
325 27
324 28
336 33
2298 205
1634 154
5
SOCIOECONOMIC CHARACTERISTICS OF HOUSEHOLDS AND RESPONDENTS
2
As mentioned before, the detailed household questionnaire was completed only for new households in 2005. Also, the 2005 MVHS individual questionnaires included the same questions as in the baseline. However, some updating of household and background characteristics was done. Change in background characteristics was minor, mainly in education status for youth. This chapter provides information on the age, sex, and education of the household population as well as on housing facilities and household possessions for the new completed households only since no household questionnaire was completed in this round for households interviewed in 2004. This chapter also highlights the differences in respondent (ever-married women, husbands, and nevermarried youth 15-24) characteristics compared to those who were interviewed in the 2004 MVHS baseline. Information is presented on a number of basic characteristics of the MVHS respondents, including age, education, and work status.
2.1
Household Composition
Table 2.1 presents the distribution of the all new households in the MVHS sample by sex of the head of the household and by the number of household members. These characteristics are important because they are often associated with socioeconomic differences between households. The size and composition of the household affects the allocation of financial and other resources among household members, which in turn influences the overall wellbeing of these individuals. Household size is also associated with crowding in the dwelling, which can lead to unfavorable health conditions. Table 2.1 shows the household composition based on de jure members (i.e., usual residents). Most of the households are newlywed households. Accordingly, the household head is male in all the households. There are on average 3.7 persons per household. Two-thirds of the new interviewed households have 2 or 3 members, which indicate that they are mainly newlywed households.
2.2
Education of the Household Population
Table 2.1 Household Composition Percent distribution of new households by sex of head of household and size, 2004 and 2005 MVHS. Characteristics Household headship Male Female Total Number of usual members 1 2 3 4 5 6 7 8 9+ Total Mean size Number of households
MVHS 2005
MVHS 2004 2
100.0 100.0
87.7 12.3 100.0
0.0 52.6 14.1 9.2 5.1 5.6 3.7 2.9 6.8 100.0 3.7 132
4.5 8.6 11.5 14.2 14.6 16.2 11.7 8.0 10.7 100.0 5.5 2,298
The educational level of the household members is among the most important characteristics of the household because it is associated with many phenomena including reproductive behavior, use of contraception, and the health of children. Due to the study design, the educational level of younger youth may change in one year, accordingly they were asked in detail about their education status. Current school attendance Table 2.2 shows the percentage of the population in the age range 6-24 that was attending school at the time of the survey. The comparatively low age-specific attendance rate for children age 6 reflects the fact that some of these children had not had their 6th birthday at the time the school year started, and thus were not eligible to attend school.
6
Table 2.2 School Attendance Percentage of the de facto household population age 6-24 years who are currently attending school, by age group, sex, and by focal villages, 2005 and 2004 MVHS. Age Group
Nazlet Toukh Monshaat Total Saft El Hussein El Khail El Ebshedat MVH without Zohra Khamar Maghalka Koloba (C) Total all S 2004 control Ali (C) MALE
6-10 11-15 6-15 16-20 21-24
74.6 95.2 83.9 54.8 6.0
70.1 92.5 80.1 43.6 7.2
84.1 81.1 82.6 37.1 3.4
76.2 82.0 79.1 38.4 1.3
6-10 11-15 6-15 16-20 21-24
70.9 90.8 80.3 42.6 4.1
73.8 73.6 73.7 26.8 0.0
72.2 65.3 68.7 18.9 10.2
61.2 64.5 62.8 23.2 1.6
74.8 90.5 83.2 48.4 10.8
68.3 86.7 76.5 41.0 8.8
60.8 86.6 73.0 39.0 5.2
71.5 86.7 78.8 41.8 5.3
72.4 87.1 79.4 42.3 5.6
73.5 89.1 80.9 45.2 7.4
69.6 76.9 73.1 22.2 0.0
63.0 67.1 65.1 23.9 4.9
67.1 71.9 69.4 25.3 3.4
67.0 71.9 69.4 27.0 3.1
71.6 77.6 74.5 26.9 3.5
68.9 81.7 74.8 30.9 4.5
61.9 76.4 69.0 31.9 5.0
69.4 79.5 74.3 33.6 4.4
69.8 79.7 74.6 35.0 4.4
72.6 83.6 77.9 35.8 5.6
FEMALE 72.5 80.9 76.7 27.6 4.8 TOTAL 6-10 11-15 6-15 16-20 21-24
72.9 93.1 82.2 49.0 5.0
71.8 84.0 77.2 34.3 4.2
78.4 73.5 76.0 27.3 5.9
68.9 73.7 71.3 31.1 1.4
73.7 86.2 80.2 39.1 8.1
Overall, the majority of children of both sexes aged 15 and under was attending school. However, the data show that school attendance rates are generally higher among boys. The gender gap in school attendance is clear among all age groups and increases somewhat with age to reach the peak in the age group 16-20. The data also show that school attendance among members aged 16-20 years in Zohra is much higher than in other villages. For example, 95% of males and 91% of females aged 11-15 years in Zohra were attending school at the time of the survey compared with 81% and 65% of males and females in Nazlet Hussein Ali.
Fig 2.1 Percentage of youth who attend school 79 69
Comparison of the 2005 MVHS and 2004 16-15 MVHS data shows almost identical distribution with minor differences due to either excluded some youth who got married or those whom their education status improved during this year.
2.3
42 27 6
16-20
Male
3
21-24
Female
Household Environment
Housing characteristics Table 2.3 shows the distribution of all new households by selected housing characteristics, including the source of drinking water, type of sanitation facilities, type of flooring, and number of rooms in the dwelling. These are important determinants of the health status of household members, particularly children. They can also be used as indicators of the socioeconomic status of households.
7
Almost all new MVHS 2005 households live in dwellings with electricity, and nearly 8 in 10 households have access to piped water, mainly within their dwelling or yard. Around 9 in 10 households in the MVHS 2005 have traditional toilets, mainly with bucket flush. Only 2% of households have no toilet facility, which is lower than the 7% reported in the EIDHS 2003. With regard to flooring, about 40% of MVHS 2005 households live in dwellings with earth/sand floors and the other 60% of dwellings have cement tiled floors or cement floors. The 2005 MVHS included a question on the number of rooms that a household had (excluding the bathrooms, kitchen, and hallways). Taken together with the information on the number of persons in the household, the results provide a measure of crowding. Table 2.3 shows that 23 % of households have 1 or 2 rooms, 51 % have 3-4 rooms, and 26 % have rooms in their households. The mean rooms per household are 3.7, and there is an average of 1.1 persons per room. The new households interviewed in 2005 MVHS appear to have housing characteristics that are fairly better than MVHS 2004, as shown by comparison with the 2004 MVHS data. The main differences are that the MVHS have better than average access to a water source and a larger number of rooms per household. Household possessions
Table 2.3 Housing Characteristics Percent distribution of households by housing characteristics, by focal villages, MVHS 2004, and 2005. Characteristic Electricity Yes No Total Source of drinking water Piped into residence/plot Public tap Open well Covered well Total Time to water source Water within 15 minutes Sanitation facility Modern flush toilet Traditional with tank flush Traditional with bucket flush Pit toilet No facility Total Flooring Earth, sand Parquet, polished wood Ceramic/marble tiles Cement tiles Cement Total Number of rooms 1-2 3-4 5+ Total Mean rooms per household Mean persons per room Number of households
MVHS 2005
MVHS 2004
97.1 2.9 100.0
97.1 2.9 100.0
81.0 7.5 0.5 11.0 100.0
72.7 9.1 0.9 17.3 100.0
99.0
98.3
6.3 1.5 91.7 0.0 0.5 100.0
2.1 3.5 87.0 5.0 2.4 100.0
39.0 1.3 0.0 34.1 25.5 100.0
51.5 0.1 0.3 25.6 22.5 100.0
23.4 50.9 25.6 100.0 3.7 1.1 132
81.2 17.1 1.6 100.0 3.9 1.6 2,298
Table 2.4 provides information on household ownership of durable goods and other possessions. With regard to durable goods, more than 7 in 10new interviewed households in MVHS own a television (color or black and white), a radio with a cassette recorder, washing machine, and more than 80% own an electric fan. More than 40% own a refrigerator, and a gas/electric cooking stove. Only 14 % of the households have a telephone, and 7% have a mobile phone. Comparison is shown in the table with households MVHS 2004. Table 2.4 also includes information on household ownership of means of transportation. Overall, only 3% of households own a car. As expected, because interviewed households are in rural areas, land or farm ownership is high. About 37% of new households in all villages own a farm or other land.
8
Table 2.4 Household Possessions Percentage of households possessing various household effects, means of transportation, property, and farm animals, MVHS 2005, and MVHS 2004. Possessions
MVHS 2005
MVHS 2004
75.4 76.3 2.9 14.1 7.2 0.5 85.3 3.8 44.4 1.3 1.0 72.9 44.0 0.0 6.3
72.0 88.2 1.7 17.4 2.8 0.8 84.7 5.1 40.5 0.6 2.4 60.1 47.7 0.3 11.4
33.9 0.0 2.8
21.1 1.0 2.9
37.3
44.9
58.8 2.1 132
84.1 1.9 2,298
Household effects Radio Television Video Telephone Mobile Computer Electric Fan Water Heater Refrigerator Freezer Sewing machine Washing machine Gas/electric cooking stove Air condition Satellite Means of transportation Bicycle Motorcycle/motor scooter Car/van/truck Property Farm/Other land Farm animals Livestock/poultry None of the above Number of households
2.4
General Characteristics of Respondents
Table 2.5 presents the distribution of eligible women, husbands, and female and male youth by various background characteristics including age, marital status, educational level, and work status per village. Since this is a follow up with the 2004 MVHS respondents, it is expected to have minor differences in background characteristics in this round. Slight differences in women’s marital status was observed this round, where among the evermarried women in the sample, 93% are currently married, 4% are widowed, and 3% are divorced or separated, with no significant differences between villages. Looking at the age distribution in Table 2.5, around 50% of MVHS 2005 women are under age 30, 28% aged 30-39 and around one quarter are age 40 and over; there are fewer women in the 15-19 range (10%) than in the other cohorts. This was expected as many women aged 15-19 are not yet married, and hence not included in the sample of ever-married women. Husbands are older than their wives; only 25% of husbands are under age 30 years, 31% aged 30-39 while 42% are over the age of 40. As for youth, more than 50 % of interviewed male youth are in the15-19 age range and 42% in the 20-24 range; female youth were younger, with 72% aged 15-19 and 26% aged 20-24. There were limited differences in youth age distribution between villages (Table 2.5a). As was observed in MVHS 2004, women’s education is still low in rural areas, where around 60% of interviewed women have no education, and only 19% have secondary education or higher, with significant differences between villages. As reported last year interviewed women from Zohra are more educated than women in any other village, while women from Toukh El Khail are less educated than other women (See Table 2.5). Husbands are much more educated than women. 9
Table 2.5 Background Characteristics of Respondents Percent distribution of ever-married women and husbands by selected background characteristics, by focal villages, MVHS 2005, and MVHS 2004. Saft El Nazlet Toukh El Monshaat Ebshedat Zohra Khamar Hussein Ali Khalil (C) El Maghalka Koloba (C)
Total all
Total without MVHS control 2004
WOMEN Current marital status Married Widowed Divorced Separated Age 15-19 20-24 25-29 30-34 35-39 40-44 45-49 Inconsistent Education No education Primary incomp. Primary comp/ some secondary Secondary comp Higher Unknown Work status Working for cash Not working for cash Total
89.5 5.9 3.3 1.0
91.9 5.8 1.9 0.0
93.2 4.5 1.9 0.3
94.6 3.0 1.5 0.9
94.1 5.0 0.9 0.0
94.5 4.0 1.2 0.0
90.5 5.0 3.4 1.1
92.9 2,122 4.4 102 2.0 46 0.6 13
93.0 4.9 1.7 0.2
91.5 5.0 2.5 1.1
6.3 19.4 20.4 14.5 16.1 10.9 12.2 0.0
9.2 22.3 18.4 14.6 10.4 10.0 14.6 0.3
12.0 22.3 19.7 14.2 13.3 7.1 11.3 0.0
12.5 20.0 15.2 17.6 11.9 11.6 11.0 0.0
5.0 17.1 18.6 15.8 18.6 13.0 11.8 0.0
10.1 18.7 22.3 11.3 12.2 11.0 14.1 0.3
8.7 22.4 18.7 13.7 14.5 11.1 10.8 0.0
9.6 20.3 18.6 14.8 13.6 11.0 12.0 0.1
8.6 19.7 20.1 13.9 14.1 10.6 12.9 0.1
7.9 19.4 18.9 14.9 14.7 11.5 12.7 -
29.4 16.5
63.4 10.0
59.5 14.9
70.7 6.9
55.3 14.6
51.7 9.2
58.0 16.1
58.1 1,328 11.9 272
52.2 12.7
61.7 13.1
8.3 35.6 7.6 2.6
7.8 14.6 1.3 2.9
8.7 10.0 1.9 4.9
4.5 9.6 0.3 8.1
7.8 16.8 3.7 1.9
10.4 24.2 2.4 2.1
7.1 14.0 1.6 3.2
7.3 16.3 2.2 4.2
167 372 50 96
8.7 20.3 3.3 2.8
7.2 15.7 2.4 -
19.5
6.5
9.1
5.1
5.6
11.6
5.5
8.0
182
10.3
9.7
80.5 100.0
93.5 100.0
90.9 100.0
94.9 100.0
94.4 100.0
88.4 100.0
94.5 100.0
92.0 2,102 89.7 100.0 2,284 100.0
90.3 100.0
219 456 424 338 311 250 274 2
HUSBANDS Age 15-19 20-24 25-29 30-34 35-39 40-44 45-49 50-54 55+ Education No education Primary incomplete Primary comp/ some secondary Secondary comp. Higher Unknown Work status Working for cash Not working for cash Total
10
0.0 4.8 18.6 15.6 19.3 13.0 13.0 6.7 8.9
0.7 10.1 18.3 15.7 14.2 13.1 9.7 7.8 10.4
1.0 10.0 21.1 20.7 11.1 12.1 8.6 7.9 8.6
0.0 12.0 14.7 12.0 18.7 12.7 11.0 11.3 6.7
0.0 4.6 14.6 14.9 14.9 19.9 15.3 8.4 7.3
0.9 8.0 17.4 12.1 17.4 12.1 12.9 12.9 6.3
2.1 7.3 16.6 13.8 15.6 14.5 13.8 8.3 8.0
0.9 8.7 16.7 14.3 16.3 13.8 12.2 9.5 7.7
16 164 317 270 309 261 229 179 146
0.3 7.5 17.9 15.6 15.4 14.1 12.1 9.0 8.1
0.1 6.5 15.6 16.0 17.0 13.2 13.0 9.2 9.4
14.9 14.1
29.5 16.0
31.1 17.1
31.7 20.3
37.2 13.8
24.1 19.6
36.3 23.5
30.4 18.8
575 355
27.6 16.3
32.5 20.1
14.1 36.8 14.9 5.2
15.3 29.9 4.5 4.9
8.9 32.9 5.7 4.3
14.7 24.0 5.0 4.3
12.3 25.3 9.2 2.3
14.3 25.4 11.2 5.4
8.3 23.2 5.5 3.1
12.5 26.8 7.3 4.1
237 507 138 78
13.0 29.6 9.1 4.4
13.1 26.8 7.5 -
79.9
73.1
53.9
73.7
67.8
57.1
61.9
67.2 1,270
65.7
63.7
20.1 100.0
26.9 100.0
46.1 100.0
26.3 100.0
32.2 100.0
42.9 100.0
38.1 100.0
32.8 621 34.3 100.0 1,857 100.0
36.3 100.0
Around one third of husbands have no education, and one third have secondary or higher education. Husbands from Zohra are more educated than husbands from other villages. Women’s educational levels vary widely by village as shown in Table 2.5 and the same pattern was observed in the MVHS 2004. Female and male youth are more educated than older adults. However, around one third of female youth still have no education and 12% of male youth have no education. Differentials are clear between villages (See table 2.5a). Paid employment is very low among females. Only 8% of ever-married women and 7% of female youth reported that they are currently working for cash, with some differences between villages. Ever-married women in Zohra and female youth in Toukh El Khail are most likely to have paid employment (19% and 11%, respectively). Table 2.5a Background Characteristics of Respondents Percent distribution of never-married female and male youth by selected background characteristics, by focal villages, MVHS 2005 and 2004. Saft El Nazlet Toukh El Monshaat Ebshedat Zohra Khamar Hussein Ali Khail (C) El Maghalka Koloba (C)
Total all
Total without MVHS control 2004
NEVER-MARRIED FEMALE YOUTH Age 15-19 20-24 25-29 Education No education Primary incomp. Primary comp./ some secondary Secondary comp. Higher Work status Working for cash Not working for cash Total
74.3 23.8 2.0
64.1 35.9 0.0
72.7 24.2 0.0
76.8 23.2 0.0
72.1 22.1 5.8
71.6 24.3 4.1
66.7 29.5 3.8
71.7 25.8 2.5
453 163 16
71.2 25.5 3.3
77.5 22.5 0.0
3.0 4.0
32.1 5.1
36.4 3.0
39.4 3.0
36.5 3.8
36.5 0.0
37.1 3.8
33.6 3.2
212 20
29.1 3.1
33.6 3.1
43.6 35.6 13.9
38.5 19.2 5.1
42.4 9.1 9.1
35.4 18.2 4.0
38.5 16.3 4.8
37.8 17.6 8.1
28.6 15.2 15.2
36.2 18.5 8.5
229 117 54
39.9 20.0 8.0
34.3 20.9 8.0
6.9
5.1
3.0
11.1
4.8
2.7
7.6
7.0
44
4.5
9.6
93.1 100.0
94.9 100.0
97.0 100.0
88.9 100.0
95.2 100.0
97.3 100.0
92.4 100.0
93.0 588 100.0 632
95.5 100.0
90.4 100.0
NEVER-MARRIED MALE YOUTH Age 15-19 20-24 25-29 Education No education Primary incomp. Primary comp./ some secondary Secondary comp. Higher Work status Working for cash Not working for cash Total
50.3 43.7 6.0
50.4 45.2 4.4
59.6 35.5 5.0
54.3 42.9 2.9
47.9 49.7 2.4
59.5 34.9 5.6
56.8 42.0 1.2
54.0 42.3 3.5
588 458 38
53.3 42.1 4.6
64.0 36.0 0.0
1.1 6.0
6.7 5.9
3.5 8.5
12.0 5.1
16.2 1.8
8.7 5.6
21.6 2.5
11.7 4.7
127 51
7.8 5.3
12.4 4.8
44.8 38.3 9.8
37.8 40.0 9.6
51.1 34.0 2.8
44.6 33.1 5.1
31.7 32.3 18.0
34.9 38.1 12.7
36.4 30.2 9.3
40.2 34.3 9.2
435 372 100
39.2 36.4 11.3
38.4 35.5 8.8
43.2
77.8
69.5
67.4
55.1
40.5
54.3
58.5
634
55.4
57.8
56.8 100.0
22.2 100.0
30.5 100.0
32.6 100.0
44.9 100.0
59.5 100.0
45.7 100.0
41.5 450 100.0 1,084
44.6 100.0
42.2 100.0
11
About two thirds of husbands are working for cash, and around 60% of male youth are working for cash. Husbands in Zohra and Saft El-Khamar are most likely to work for cash (80% and 73%, respectively). However, among unmarried young men paid labor is most common in Saft El Khamar (78%) and least common in Koloba (41%).
12
FERTILITY AND FAMILY PLANNING
3
One of the primary objectives of the 2005 MVHS is to provide information on fertility levels and preferences, use of family planning, and intention to use family planning in the future. Such valuable information is of particular importance in addressing the contraceptive needs of nonusers who are interested in spacing or limiting their fertility. This chapter discusses various fertility and family planning indicators, including fertility levels, fertility preference and need for family planning, ever and current use of family planning, reasons for discontinuation of contraceptive methods, approval of and attitudes toward family planning, source of method, and intention to use contraception in the future. When sample size permits, these indicators are presented at the village level.
3.1
Fertility Levels (Appendix A Table 3.1)
Data on childbearing patterns were collected in the 2005 MVHS by asking each interviewed evermarried woman about the number of sons and daughters who born during the period from the previous interview conducted in the 2004 MVHS up to the time of the 2005 MVHS interview. This collected data in addition to data collected in 2004 MVHS presents the overall childbearing of ever married women. The 2005 MVHS data show that the average number of children ever-born is 3.5. Figure 3.1 shows the percentage distribution of women by number of children ever born. Overall, slightly more than one third of women (34%) have 5 children or more, and about 12% of women have 4 children. In addition, more than one quarter of women (27%) have one or two children.
Fig 3.1 Percentage distribution of women by number of children ever born 34 27 16 12
12
An important observation is that there is a clear difference in fertility indicators across villages. 0 1-2 3 4 5+ Toukh El Khail has the highest mean number of children ever born (3.8 children), while Koloba has the lowest mean number of children (3.1). The data further show that almost 21% of women in Nazlet Hussein Ali and Koloba have no children, compared to 11% of women in Ebshedat.
3.2
Fertility Preference
Data on fertility preferences in a population are of great importance to policy makers, both for estimating the potential unmet need for family planning and for predicting future fertility behavior. Currently married women and husbands in the 2005 MVHS were asked about their intention to have another child. In addition, all respondents were asked about the ideal number of children they would prefer. The responses to these questions are discussed below. Desire for more children (Appendix A Table 3.2) To obtain information about fertility preferences, non-sterilized currently married women and husbands were asked whether they would like to have a/another child or would prefer not to have any (more) children. Pregnant women were asked whether they would like to have a/another child or would prefer not to have any (more) children after delivering the child they were expecting. Sterilized women (n=13) were not asked about their childbearing preferences, and thus they were not included in this analysis. Almost 65% of currently married women do not want any more children, with the highest percentage found in Zohra village (72%), and the lowest percentage in Koloba village (58%). The data show that about 30% of all currently married women want to have
13
another child. However, the results vary by village: 34% of women in Koloba village desire to have another child, compared to 25% among women in Zohra village. The results further indicate that 37% of husbands want to have another child, while 60% do not want any more children. Comparison of the results for husbands and married women reveals important gender differences in fertility preference. Husbands are more likely than wives to desire having more children in all villages. For example, more than 45% of husbands in Nazlet Hussein Ali village desire to have more children, compared to only 33% of women.
Fig 3.2 Percentage who want another child, and who want no more or no children 65
60
37 30
Have another child
Wom en
No more, none
Husban ds
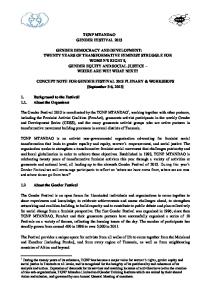
Ideal number of children (Appendix A Table 3.3) The fertility preferences are obviously influenced by the number of children the women or husbands already have. The 2005 MVHS asked about the ideal number of children. The question about ideal family size required the respondents to consider the number of children they would choose to have in their whole life regardless of the number (if any) that they already had. However, the ideal number of children tends to be fairly closely associated with the actual number of children a respondent has. Respondents who want a large family tend to have more children than others. Respondents may also rationalize their ideal family size, so that as the actual number of children increases, their preferred family size increases as well. Data from the 2005 MVHS show that women want a smaller family size than husbands do. Among those respondents who gave a numeric response to the question about the ideal number of children, women wanted an average of 3 children, compared to 3.6 children for husbands. About one third (32%) of all ever-married women mentioned that they want 1 or 2 children, while 5% of them want 5 or more children. Slightly less than one fifth (18%) of women did not mention a numeric preference.
Fig 3.4 Ideal number of children (Mean) 3.6 3.2
3 2.5
Women
Husbands
Never-married Never-married f emale youth
male youth
Women in Ebshedat village reported the highest mean ideal number of children (3.2 children), while women in Nazlet Hussein Ali reported the lowest mean (2.7 children). Thirty-four percent of women in Zohra village mentioned that they want 4 children or more, compared to only 12% of women in Toukh El Khail village. Data about husbands’ fertility preferences show roughly the same pattern. Husbands in Ebshedat village reported the highest mean ideal number of children (4.1 children). More than half of husbands in Zohra, Koloba, and Ebshedat villages desire 4 children or more. The data show that never-married female youth want fewer children than male youth (on average 2.5 and 3.2 children, respectively). Female youth in Zohra and Koloba villages reported the highest mean ideal number of children (2.6). On the other hand, male youth in Koloba and Ebshedat reported the highest ideal mean number of children (3.4 children). Forty six percent of nevermarried male youth in Koloba village reported that they want four children or more. The data also show that male youth in Saft Al Khamar and Nazlet Hussein Ali villages have the lowest mean ideal number of children (2.8). Very few youth mentioned a nonnumeric answer (about 7% of both male and female youth).
14
Premarital and newlywed examination (Appendix A Table 3.4) One of the most important objectives of the CHL program is to raise awareness about the benefits of premarital and newly wed examinations. The individual questionnaires in the 2005 MVHS included questions about the respondents’ awareness of these two examinations. In addition, evermarried women and husbands who had heard about either examination were asked if they had ever had such a premarital or newly wed examination. Never-married male and female youth were asked about their intention to have these examinations in the future. Slightly less than two thirds of ever-married women (64%) had heard about premarital examinations, and 21% had heard about the newlywed examination. Women in Nazlet Hussein Ali village showed greater awareness of premarital examinations, while women in Koloba showed the greater awareness of newlywed examinations than women in any other villages. However, among women who were aware of these examinations, only a very small percentage (less than 1%) of women had ever had them. The same pattern was observed among husbands. Husbands in Nazlet Hussein Ali village have the highest degree of awareness about the premarital examination (87%), and those in Koloba have the highest degree of awareness about the newlywed examination (41%). Data from the 2005 MVHS show Table 3.1 Percentage of Respondents who Know about or Had that the awareness about Premarital and Newlywed Examinations premarital and newlywed examinations is higher among Never-married never-married female youth than Female Male among never-married male youth. Women Husbands youth youth This is the case in all villages. Know about premarital Seventy six percent of female examination (%) 64 63 76 60 youth had heard about premarital Know about newlywed examinations. The highest examination (%) 21 20 30 16 awareness was reported in Nazlet Had (intend to have) Hussein Ali (92%) and the lowest premarital examination (%) 0 1 42 41 in Toukh El Khail (63%). Slightly Had (intend to have) newlywed examination (%) 0 0 13 6 less than one third of female youth (30%) had heard about newlywed examinations, with the highest awareness reported in Koloba village (54%) and the lowest in Monshaat El Maghalka (17%). Only 16% of male youth knew about newlywed examinations. Although knowledge of premarital examinations is higher among female youth than among male youth, intention to have such examination is almost equal among never-married female and male youth. Among youth aware of premarital examinations, almost 41% of females and males intend to have a premarital examination. Among male youth, those from Toukh El Khail and Koloba are most likely to intend to have a premarital examination (around 55%), while those in Nazlet Hussein Ali are least likely to intend to have the examination (25%). Among female youth, intentions to have a premarital examination are highest in Zohra (almost 51%) and lowest in Monshaat El Maghalka (27%). Even among youth who know about newly-wed examinations, very few female and male youth intend to have a newlywed examination (13% and 6%, respectively). Female youth in Nazlet Hussein Ali are most likely to plan on having a newlywed examination (21%), whereas female youth in Zohra reported the lowest intention (6%). Among male youth, 10% of those living in Koloba intend to have a newlywed examination, compared to only 1% of males from Saft Al Khamar and Toukh El Khail villages. Need for family planning (Appendix A Table 3.5) One of the major concerns of family planning programs is to identify the potential demand for contraception and to identify women who are most in need of contraceptive services.
15
Women with an unmet need for family planning include the following: •
Currently married women who are in need of family planning for spacing purposes. This group includes (1) pregnant women whose pregnancy is mistimed (i.e., who had preferred to postpone the pregnancy); (2) amenorrheic women whose last birth was mistimed; and (3) nonusers who are neither pregnant nor amenorrheic and who either want to delay the next birth at least 2 or more years, are unsure whether they want another child, or want another child but are unsure when to have the birth.
•
Currently married women who are in need of family planning for limiting purposes. This group includes (1) pregnant women whose pregnancy is unwanted; (2) amenorrheic women whose last child was unwanted; and (3) nonusers who are neither pregnant nor amenorrheic and who want no more children.
Menopausal and in-fecund women are excluded from the unmet need category, as are pregnant or amenorrheic women who became pregnant while using a contraceptive method. The latter group is considered to be in need of better contraception. Women with a met need for family planning include women who are currently using contraception. The total demand for family planning represents the sum of unmet need and met need. The total demand also includes pregnant and amenorrheic women who became pregnant while using a family planning method.
Table 3. 2 Need for Family Planning Services Categories Unmet need for family planning For spacing (%) For limiting (%) Total (%) Met need for family planning (Currently using) For spacing (%) For limiting (%) Total (%) Contraceptive failure For spacing (%) For limiting (%) Total (%) Total demand for family planning For spacing (%) For limiting (%) Total (%) Percentage of demand satisfied Total
All villages 10.8 12.7 23.5
10.0 41.2 51.2 0.2
The indicators of the total demand for family 0.1 planning, the unmet need and the met need for 0.3 family planning were only calculated for the total sample, not at the village level, since the sample size 21.0 54.0 of each village was not sufficiently large. The total 75.0 unmet need for all the MVHS sample is 24%, with 68.6 11% of this need representing a need for child 2,016 spacing and 13% a need for limiting family size. The total met need for family planning is 51%, comprising 41% who are limiting their family size and 10% who report a desire to delay the next birth. Data of the 2005 MVHS further show that the total demand for family planning is 75% and that 69% of this total demand for family planning is satisfied.
3.3
Attitudes toward Family Planning (Appendix A Table 3.6)
In the 2005 MVHS, attitudes about use of family planning and about the ideal time intervals between births were measured using respondents’ level of agreement with a series of statements about these topics. The responses were presented on a scale of 1-5, ranging from strongly disagree to strongly agree. During the analysis stage, the responses were recoded into three categories: agree, disagree, and neutral. Attitudes toward birth spacing were assessed using respondents’ level of agreement with the statement “Couples should space births at least 2 years.” The majority of all respondents (almost 98%; not shown) agreed that couples should space their children at least 2 years. Women and female youth living in Koloba, husbands living in Nazlet Hussein Ali and male youth in Monshaat Al Maghalka were slightly less likely to favor spacing than those living in other villages.
16
Respondents were also asked about their level Fig 3.5 Percentage who agree that of agreement with the statement that couples couples should space births 3-5 years should space children 3 to 5 years. The 2005 MVHS shows that female respondents are 89 87 more likely than male respondents to agree 83 83 that 3-5 years of spacing is needed as shown in Figure 3.5. In addition, the data show that there are significant differences between villages. Female respondents in Monshaat Al Maghalka village are most likely to agree that couples should space children 3-5 years, while Women Husbands Never-married Never-married f emale youth male youth women in Saft El Khamar and female youth in Ebshedat show the least agreement about this interval of birth spacing. On the other hand, male respondents living in Saft Al Khamar are least likely to think that 3-5 years of spacing is needed. Respondents’ attitude toward using a Fig 3.6 Percentage who agree that after contraceptive method was assessed by asking the birth of a child, couples should begin about their agreement with the statement that using a FP method before resuming after having a child, couples should begin marital relations 92 92 using a family planning method before 91 resuming marital relations. Overall, about 92% of all groups of respondents except 87 never married female youth (87%) agreed that couples should use family planning before resuming sexual relations. Women and Women Husbands Never-married Never-married husbands in Zohra and Koloba villages are f emale youth male youth most likely to agree that couples should use family planning before resuming sexual relations after having a child, while those in Saft Al Khamar are least likely to agree with this statement. Regarding unmarried youth, female youth from Zohra and Monshaat Al Maghalka and male youth from Koloba are most likely to agree that couples should use family planning before resuming sexual relations. Respondents were also asked whether they agreed that proper spacing will cause the next child to be healthier and that delaying the birth of the next child will keep the mother healthier. The results show that nearly all respondents believed this to be true (98% for women, 97% for youth and 96% for husbands; not shown). It is worth noting that respondents in Saft Al Khamar village were less likely than respondents in other villages to think that child spacing is good for the health of the child and of the mother except for never married male youth. Male youth in Nazlet Hussein Ali show the lowest agreement with this statement. Finally, respondents were asked whether they agreed that starting contraception immediately after the birth of a child will prevent accidentally becoming pregnant too soon. Data from the 2005 MVHS show that opinions about this vary considerably. Ninety-seven percent of women in Nazlet Hussein Ali and Monshaat Al Maghalka agreed that starting contraception immediately after birth will prevent pregnancies from occurring too soon, compared to only 59% of women in Koloba. Nearly 92% of husbands in Nazlet Hussein Ali and Monshaat Al Maghalka agreed with this statement, but only 66% of husbands in Koloba do. Female youth in Monshaat Al Maghalka and male youth in Toukh El Khail show the highest agreement that starting contraception immediately after birth will prevent pregnancies from occurring too soon. Opinions about family planning use in the community (Appendix A Table 3.7) To obtain information on perceptions about the extent of family planning use in the community, respondents in the 2005 MVHS sample were asked whether most, some, very few, or none of the
17
couples in the reproductive ages living in their area use family planning. In addition, they were asked to assess the extent of family planning use in the community between the first and the second child and before the first pregnancy. They were also asked if use of family planning in their community was increasing, decreasing, or staying about the same. Overall, the results show that 80% of Fig 3.7 Percentage agreeing with women mentioned that most couples in various opinions about use of family their community are using family planning (Women) planning and 93% believe that family 93 planning use is increasing, as shown in 80 64 Figure 3.7. However, there are variations between villages. Ninety-seven percent of women in Toukh El Khail believe that 2 most couples are using family planning Most couples use Using FP is Most couples Most couples in the community, compared to only 58% before the f irst increasing use FP use af ter f irst of women in Koloba. Husbands’ pregnancy child opinions show a different pattern. Slightly fewer than three quarters of all husbands (72%) believe that most couples in their community are using family planning and 88% think that family planning use is increasing. Husbands in Toukh Al Khail are most likely to believe that most of the couples in Table 3.3 Percentage Agreeing with Various Opinions about their community are using family the Level of Family Planning Use planning (87%), while husbands in Never-married Koloba village are least likely to believe this is the case (55%). Female Male Women Husbands
youth
youth
Youth’s opinions about the extent of Most couples using FP 80 72 73 65 family planning use among couples Most couples begin using in their community differ somewhat FP after first child 64 56 58 51 from the opinions of married adults. Most couples begin using Slightly fewer than three quarters of before first pregnancy 2 2 2 1 female youth believe that most Number of couples using couples in the area are using family FP is increasing 93 88 91 81 planning, and 91% percent believe family planning use is increasing. However, only 65% of male youth think that most couples in the community are using family planning, although 81% do believe that use of family planning is increasing. Differences across villages for female and male youth responses are very clear. However, for example, 96% of the male youth in Zohra believe that use of family planning is increasing, but only 18% from Monshaat Al Maghalka do. Sixty-four percent of ever-married women and 56% of husbands believe that most couples in the reproductive age living in their community begin using family planning after the first child. However, opinions vary greatly across villages. For example, while the majority of women in Monshaat Al Maghalka believe that most women in their community begin using family planning after the first child (90%), only 35% of women in Koloba believe this to be the case. The same variation across villages is observed for husbands. Fifty-eight percent of female youth and 51% of male youth think that most couples in their community begin using family planning after the first child. Never-married female youth in Koloba village and male youth in Monshaat Al Maghalka village are least likely to believe that most couples start using family planning after the birth of their first child (30% and 11% respectively). The majority of respondents believe that none of the couples in their community begin using family planning before the first pregnancy, with few differences between villages.
18
Approval of family planning use (Appendix A Tables 3.8-3.10) Having a positive attitude toward family planning is prerequisite for the adoption of family planning. Respondents were asked whether they themselves approve of a couple’s using family planning. Data from the 2005 MVHS show that almost all respondents (98% or more) approve of a couple’s using family planning. This percentage varies slightly across villages. Respondents who approve of the use of family planning were asked questions about the appropriateness of a couple’s use of family planning after the first birth. They were also asked about appropriate reasons for deciding to use contraception after the birth of the first child. In addition, those respondents were asked about the appropriateness for a newly married couple to begin using contraception before they have their first child and about appropriate reasons for using family planning before the first child. The results show that among women and Fig 3.8 Pe rce n tage wh o approve of family female youth who approve the use of family plan nin g u se after th e first birth (amon g planning, 90% and more consider it th ose who approve of FP) 93 90 86 appropriate to use family planning after the 85 first birth. About 85% of husbands and male youth also believe this to be appropriate. Approval of contraceptive use after the first birth varies across villages. Of women in Zohra who approve using contraception, Women Husbands Never-married Never-married almost all consider it appropriate for a couple f emale youth male youth to use family planning after the first birth. By contrast, only 84% of women in Monshaat Al Maghalka think that this would be appropriate. For husbands, variations across villages are even clearer. Among husbands in Zohra who approved of family planning, ninety-nine percent believe it is appropriate for a couple to use contraception after the first birth, compared to only 70% of husbands in Ebshedat. Additionally, there are clear variations between villages for female and male youth regarding the appropriateness for a couple to use family planning after the first birth. When respondents asked about the reasons for using family planning after the first child, the most commonly reported answer is that the woman should rest for some time after the first birth. The second most common reply is that the first/next child will be healthier, while the third one is that financial circumstances make couples use family planning after the first child to delay the next pregnancy. Few respondents consider it appropriate to Fig 3.9 Percentage who approve of FP use adopt family planning before the first birth. before the first pregnancy (among those Among those who approve of family who approve of FP) planning, only around 9% of ever-married 14 12 women and husbands consider it appropriate 9 9 for a newly married couple to adopt contraception before the birth of their first child. However, this percentage increased to 14% among female youth and 12% among male youth. For married women and husbands Women Husbands Never-married Never-married these percentages vary considerably across f emale youth male youth villages. Variations across villages in attitudes toward use of family planning before the first child are much larger for youth. Nearly one quarter of female youth (23%) in Koloba consider using contraception before the first child as appropriate, compared to only 6% among those in Toukh El Khail. Regarding the reasons that would be appropriate for a couple to begin using contraception before they have their first child, the results of the study show that the most commonly mentioned reason by all respondents (except for never-married female youth) is financial circumstances. With 19
respect to female youth, the most commonly mentioned reason is that the husband or the wife is still studying. This was the second most mentioned reason by the majority of respondents, followed by “husband is in debt”. Knowledge of Fertile Period (Appendix A Table 3.11) Respondents in the 2005 MVHS were asked when during the ovulation cycle a woman is most likely to become pregnant. This information may be useful in ensuring success in the use of coitusrelated methods such as the condom, vaginal methods, and withdrawal. It is also especially critical for the practice of periodic abstinence. Respondents were asked whether there are Fig 3.10 Percentage who know the certain days a woman is more likely to fecund period become pregnant if she has sexual intercourse, 44 42 and if so, whether this time was just before the period begins, after the period ends, or half way between two periods. Fig. 3.10 shows that 23 knowledge about the fecund period is limited, 14 with only 42% of all ever-married women knowing about the fecund period. However, knowledge of the fecund period varies across Women Husbands Never-married Never-married villages. For women, knowledge ranges from f emale youth male youth 83% in Zohra village to only 19% in Ebshedat village. Of those women who are aware that there is a fecund period, only 41% mentioned that it is half way between two periods. With respect to husbands’ knowledge, the data show that 44% of husbands know the fertile period (83% among husbands in Zohra village). Of those husbands aware that there is a fecund period, 42% reported that this period is half way between two periods. Youth’s knowledge of the fecund period is much lower: Only 23% and 14% of female and male youth respectively know about the fertile period. Once again, female youth in Zohra village and male youth in Monshaat Al Maghalka are most likely to know of the fecund period compared to youth in other villages (42% of never-married female youth and 37% of never-married male youth).
3.4
Ever Use of Family Planning
The 2005 MVHS collected data about ever use of family planning methods, as well as about the number of children the woman had when she adopted family planning for the first time. Levels of Ever Use (Appendix A Table 3.12) The individual questionnaires of the 2005 MVHS for women and husbands included a series of questions on ever use of family planning methods. The data were obtained by asking respondents whether they had ever used any of the family planning methods they know.
Table 3.4 Percentage of Women who Ever Used Various Family Planning Methods Any method
71
Any modern method Pill IUD Injectables Norplant/Implant
66 41 31 40 3
Overall, the results of the survey indicate that 71% of all women had ever used a method. Sixty-six percent 22 Any traditional method of all women had tried a modern method, and 22% Prolonged breastfeeding 21 had ever used a traditional method. The most commonly used modern method is the pill (41%), followed by injectables (40%) and the IUD (31%). The most common traditional method used was prolonged breastfeeding (21%). Injectables were the most common method in all villages except Ebshedat where the IUD was the most commonly used method. The data also show that 74% of husbands have ever used a method, and that 70% of them have
20
used a modern method. The most common modern method mentioned by husbands is the pill and injectables (43%) followed by the IUD (35%). Differences in use across villages are similar to those for women. First use of family planning (Appendix A Table 3.13) Ever-married women who reported that they had ever used family planning were asked about the number of children they had when they first used a method. These data are useful in identifying the stage in the family-building process when women begin using family planning and their motivation for adopting family planning. The results indicate that almost none of all ever-married women started using family planning after marriage before they had children. More than one third of women (35%) began use of family planning after they had their first child, with the percentage ranging from 25% in Koloba to 49% in Zohra. Fourteen percent of evermarried women started using family planning after they had their second child and slightly less than one quarter of women (21%) started using some method after having three or more children.
Table 3.5 Percentage Distribution of Ever Married Women by Number of Children at First Use of Family Planning Percentage 30 0 35 14 7 14 2.0
Never used contraception 0 1 2 3 4+ Median
Differences between villages indicate that women in Zohra and Monshaat Al Maghalka are more likely to start family planning at a lower parity than women in any other village. The median parity at which women begin using contraception in those villages is 1.8 children, compared to 2.4 children for women in Koloba village (not shown).
3.5
Current Use of Family Planning
Information on family planning use is very important since it provides insight into one of the main determinants of fertility and serves as a key measure for assessing the success of the national family planning program. This survey asked currently married women of reproductive age and husbands about current use of family planning. In addition, it collected detailed information about the name and the location of the most recently source from which they obtained their method. Levels of Current Use of Family Planning (Appendix A Table 3.14) Overall, the 2005 MVHS results indicate that 51% of currently married women are using a FP method, with 46% using modern methods and 5% using traditional methods. The most widely used methods are injectables, the IUD, and pills. Almost 20% of currently married women are using injectables, followed by the IUD (13%) and then pills (10%). Small proportions of women are using other modern methods, with 2% currently using Norplant/Implant, and 5% using prolonged breastfeeding. The level of contraceptive use differs across villages. Currently married women in Zohra and Nazlet Hussein Ali villages are more likely to be using a modern contraceptive method than currently married women from any other village (57% and 55%, respectively). Women in Koloba village were least likely to be using a modern contraception (32%). The injectable is the most frequently used method in all villages, except for Ebshedat village in which the
Fig 3.11 Percentage of women currently using various family planning methods 51
46
20 10
Any method
Any
Pill
13
IUD
Injectables
5
5
Any
Prolonged
modern
traditional
breast-
method
method
f eeding
21
IUD is the most used method among women. Women in Monshaat Al Maghalka rely on pills more than women from any other village (16%). Use of traditional methods is highest among women in Monshaat Al Maghalka (8%), followed by Saft Al Khamar village (6%). Husbands are slightly more likely than women to report current use of contraceptives. More than half of husbands (55%) mentioned that they or their wives are using a method, compared to 51% among women as mentioned above. Forty-two percent of husbands in Koloba village reported using contraception, compared to 32% of women. The same situation was observed in Ebshedat village. Source of Family Planning Methods (Appendix A Tables 3.15-3.16) Detailed information about the source from which users had obtained their method was collected in the 2005 MVHS. Current users were asked about the name and location of the source from which they received their methods at the beginning of the current segment of use if it is during the period from the previous interview conducted in the 2004 MVHS up to the time of the 2005 MVHS interview. Otherwise, data collected in 2004 MVHS were used. Users were also asked about the source from which they had most recently obtained the method. The source for family planning methods varies markedly by method. Overall, the data show that 64% of pill users Table 3.6 Percentage Distribution of Women obtained their method from a private sector source, by Source of Family Planning Methods and while 35% obtained their method from the public by Type of Method sector. However, the results vary across villages. Public Private NGOs, Eighty five percent and 72% of pill users in sector sector Other Total Ebshedat and Koloba respectively received their method from the private sector, compared to only Pill 35 64 1 100 IUD 68 29 3 100 45% in Monshaat El Maghalka village. Conversely, Injectables 92 3 5 100 the majority of the current IUD users have the device inserted at a public source (68%), mainly at the MOHP facilities. Again, differences were observed among villages. Current users of the IUD in Monshaat El Maghalka were least likely to rely on the public sector (46%), while those in Nazlet Hussein Ali were most likely to rely on the public sector (89%). The data show that 92% of all injectable users rely on the public sector, mainly rural health units. No significant differences were observed between villages except for Ebshedat village. In Ebshedat, only 58% of injectable users rely on the public sector. The individual questionnaires of the 2005 MVHS for the husbands and youth included a question asking whether the respondents know any source from which they can get a family planning method. If so, they were asked to report the name and the location of the source. The results indicate that the rural health unit is the most mentioned source for family planning methods in all villages except Zohra. The rural health unit in Zohra village was improved and upgraded into a rural hospital. Accordingly, this rural hospital is the most mentioned source for all respondents in Zohra village. Almost 8% or more of husbands and youth mentioned the rural hospital as the main source of family planning methods. Use of Pill, IUD and Injectables The majority of contraceptive users interviewed in the 2005 MVHS rely on pills, IUD, and injectables. The MVHS asked several questions about the adoption and use of those methods, including questions about the cost of the method, willingness to pay, and use of specific pill brands.
22
Pill use (Appendix A Tables 3.17-3.19) Overall, 10% of all currently married Fig 3.12 Percentage distribution of women in the 2005 MVHS are pill users. pill users by brand of pill used Current users of the pill were asked about Exluton the brand of pills they used, the cost of a pill 3 Microcept cycle, and the amount that they would be Nordette 49 willing to pay for a cycle. Information about 3 the brands used by women was collected by asking pill users to show the packet of pills. Other If the packet was available, the interviewer 18 recorded the name of the brand. If the interviewer did not see the packet, she Microgynon Don't know 4 would ask the respondent to name the brand 24 she was using. The results of 2005 MVHS show that about a quarter of all pill users were not able to show the packet or identify the brand they were using. Overall, 49% were using Microcept, 4% of current users were using the Microgynon brand, while, 3% were using the Nordette and other 3% were using the Exluton. Brand use varies by village. While three quarters of pill users in Zohra village use Microcept, only 22% of the pill users in Saft Al Khamar are using this brand. Twenty percent of pill users in Koloba and 6% of users in Nazlet Hussein Ali are using Exluton, while none of users in other villages are using this brand. To obtain information on the cost of pills, current users were asked about the amount they paid for the most recent packet of pills. Women and husbands reported a median price of 66 piaster per pill cycle. Slightly fewer than half of the women (49%) mentioned that they paid from 51-75 piaster, while more than one third (34%) paid more than one pound. Women in Nazlet Hussein Ali and Zohra and husbands in Toukh El Khail reported the highest mean prices, while women and husbands in Saft Al Khamar village reported the lowest mean price for a one pill cycle.
Fig 3.13 Percentage distribution of pill users by cost of one pill cycle 51-75 piaster 49
Free 1 76-100 piaster Don't know 8
More than
8
100 piaster 34
Pill users were asked about their willingness to pay Table 3.7 Percentage of Women Willing to specific amounts for a pill cycle, with the aim of Pay Various Amounts for One Pill Cycle ascertaining whether they would be willing to pay a Amount willing to pay for higher price. The results show that women are willing one pill cycle to pay more money than husbands. Reports from both 75 piaster 100.0 women and husbands show that almost all pill users are 1 pound 98 willing to pay one pound for a packet of pills. Slightly 2 pounds 72 fewer than three quarters of women (72%) and 5 pounds 38 husbands (71%) are willing to pay two pounds for a More than 5 pounds 29 pill cycle. In addition, 38% of the women and husbands 104 Number are willing to pay 5 pounds. About 29% of women and 24% of husbands are willing to pay more than 5 pounds. However, willingness to pay varies by village. Women in Zohra village and husbands in Nazlet Hussein Ali village are most likely to report being willing to pay more than 5 pounds for a pill cycle. IUD use (Appendix A Tables 3.20-3.21) IUD users represent 13% of all currently married women. Those users were asked for information 23
on the actual price they paid when they obtained the IUD, as well as about their willingness to pay various amounts for an IUD. The 2005 MVHS looks at the information provided by the current users about the amount that they paid for the IUD services. Virtually all IUD users paid to obtain the method; only 4% mentioned that they had obtained the method free of charge. Among those paying to obtain the IUD, the majority paid less than 3 pounds (45%). More than one fifths (23%) of IUD users paid 3 to 5 pounds. Almost 20% paid 16 pounds or more for the IUD services.
Fig 3.14 Percentage distribution of IUD users by cost of method (Women) Free <3 pounds
4% More than
45 %
30 pounds 12 %
Village-level data show that 12% of women 16-30 in Nazlet Hussein Ali received the IUD pounds 3-5 pounds 6-15 pounds services for free, but none of the IUD users in 8% 23 % 8% Zohra, Toukh El Khail, Monshaat Al Maghalka and Ebshedat villages did. Almost 9 in every 10 IUD users in Zohra village paid 5 pounds or less for IUD services. The same pattern was observed in Saft Al Khamar village, in which 83% of women paid less than 3 pounds for IUD services. Conversely, less than 50% of IUD users in Koloba, Nazlet Hussein Ali and Zohra villages paid less than 3 pounds for receiving the services. Data for husbands show a similar pattern. It is worth mentioning that all respondents from Monshaat Al Maghalka paid 3 pounds or more to receive the IUD services. To investigate whether the price of the IUD can be Table 3.8 Percentage of Women Willing to increased, all current IUD users were asked about their Pay Various Amounts for IUD Insertion willingness to pay specific amounts, ranging from 5 Amount willing to pay for IUD pounds to more than 200 pounds. As expected, 5 pounds 93 willingness to pay decreases as the price level 10 pounds 77 increases. The majority of women and husbands (93% 25 pounds 53 and 95%, respectively) would be willing to pay 5 50 pounds 30 100 pounds 10 pounds, and more than 76% of them said that they 150 pounds 6 would be willing to pay 10 pounds. About half of 200 pounds 3 respondents are willing to pay 25 pounds, and only More than 200 pounds 3 30% of women and 23% of husbands are willing to pay 50 pounds. Only 3% of women and 2% of husbands are willing to pay more than 200 pounds for the IUD services. The data show that there are substantial differences between villages. In Zohra village 86% of women are willing to pay 25 pounds, compared to only 8% of women in Saft al Khamar. Although 20% of women in Monshaat Al Maghalka village are willing to pay 150 pounds for an IUD, none of the IUD users in Saft al Khamar and Toukh El Khail are willing to pay this much. Injectable use (Appendix A Tables 3.22-3.23) Injectables are one of the main family planning methods used by Egyptian women. The 2005 MVHS data show that 20% of all current users are using injectables. As was the case with the pills and the IUD, the MVHS obtained information on the actual cost of the injectables and on willingness to pay for them. Data from the MVHS show that 97% of the injectable users paid for the method. However, 87% paid less than 3 pounds. This was
24
Fig 3.15 Percentage distribution of injectable users by cost of injectables (Women) More than 6
Free; 3
pounds; 2 5-6 pounds; 4 3-4 pounds; 5 <3 pounds; 87
expected, considering that the MOHP fixed the cost of the injectables at 1 pound. No significant differences were observed between villages, except for the fact that 8% of users in Ebshedat and 5% in Zohra villages paid more than 6 pounds. The data show that 27% of husbands did not know the actual cost of the injectable. Injectable users were asked about their willingness to pay amounts ranging from 2 pounds to more than 20 pounds. Again, willingness to pay decreases as the price increases. About 94% of women and 97% of husbands would be willing to pay 2 pounds for the method, 66% of women and 71% of husbands would be willing to pay 5 pounds, and 5% of women and 3% of husbands would be willing to pay more than 20 pounds.
Table 3.9 Percentage of Women Willing to Pay Various Amounts for Injectables Amount willing to pay for injectables 2 pounds 5 pounds 10 pounds 15 pounds 20 pounds More than 20 pounds
Willingness to pay for injectables varies across villages. For example, only 7% of women in Saft Al Khamar are willing to pay 10 pounds, compared to about half of women in Nazlet Hussein Ali village and more than 40% in Zohra and Ebshedat villages.
94 66 22 8 6 5
Service assessment indicators (Appendix A Table 3.24) All current users were asked about the quality of services and the source from which they obtained their method. The 2005 MVHS shows that 11% of all pill users reported that the provider told them about other methods. Seven percent of pill users indicated that their provider described the side effects of the pill, but only 4% reported that the provider informed them what to do about such side effects. Because the IUD is inserted by medical providers, IUD users received more information than pill users. Overall, 26% of IUD users were told about other methods, 23% were told about side effects, and 20% were told how to address these side effects. Slightly less than one quarter of injectable users were told about other methods. Twenty one percent were told about side effects and 12% were told what to do about these side effects.
3.6
Table 3.10 Percentage of Women who Received Information about Family Planning, by Type of Method Used Pill IUD Injectables Told about other methods (%) Told about side effects (%) Told what to do about side effects (%)
11 7
26 23
23 21
4
20
12
Discontinuation Rates (Appendix A Table 3.25)
This section focuses on women not currently using family planning, and presents information on levels of family planning discontinuation, reasons for discontinuation, intention to use in the future, and the reasons for not planning to use contraception in the future. The information presented in this section is important in evaluating the prospects for family planning acceptance among women who are not currently using a family planning method. One of the important aspects for family planning programs is the rate at which users discontinue use of contraception and the reasons for such discontinuation. Reasons for discontinuation may vary but usually include factors such as contraceptive failure, dissatisfaction with the method, side effects and health concerns, and the lack of availability or the cost of the methods. High rates of discontinuation indicate that a family planning program should devote more attention to counseling and follow-up, which can reduce discontinuation rates by helping women to deal with obstacles to continued use. Life table techniques were used to calculate contraceptive discontinuation rates. The rates are 1year discontinuation rates that represent the proportion of users discontinuing within the first 12 months after beginning to use the method. The rates are calculated separately for the following
25
methods: pills, IUD, injectables, and prolonged breastfeeding. Because very few women discontinue the use of a method in the first 12 months, data were calculated for the total sample only. In order to ensure a sufficient number of segments of use to allow calculation of the rates, the reasons for discontinuation were grouped into four specific categories: method failure (i.e., they became pregnant while using the method), desire for pregnancy, side effects/health concerns, and other reasons (including husband’s disapproval, need for a more effective method, marital dissolution… etc.). Overall, data from the 2005 MVHS indicate that 42% of users stopped using a method within 12 months of starting use. About 2% of users stopped using due to method failure, 4% because they wanted to become pregnant, 20% because of side effects or health concerns, and 15% for other reasons. Looking at specific contraceptive methods, pills had the highest 1-year discontinuation rate (60%), followed by prolonged breastfeeding (41%) and the injectable (39%). The IUD had the lowest discontinuation rate (27%).
Fig 3.16 Contraceptive discontinuation rates by method and reasons for stopping use 60 39 27
Pill
Me th od failure Side e ffe cts
IUD
Injectables
To be come pregn an t O th e r reason s
The data from the 2005 MVHS show that more than one quarter of pill users (29%) reported side effects/health concerns as the main reason for discontinuation. In addition, almost one quarter (24%) of injectable users stopped using the method during the first 12 months of use due to side effects and health concerns. Only 21% of IUD users stopped using it for this reason. Less than 1% of IUD and injectable users stopped using the method because of method failure, compared to about 4% of prolonged breastfeeding users and 5% of pill users.
3.7
Intention to Use Contraception in the Future
To obtain information about the potential demand for family planning services, all currently married women and husbands who were not using contraception at the time of the survey were asked about their interest in adopting family planning in the future. Female and male youth were also asked about their intention to use contraception in the future. In addition, respondents who mentioned that they are not likely to adopt contraception in the future were asked about the reasons why they do not plan on using a method. Future use of family planning (Appendix A Table 3.26) The data show that slightly fewer than three quarters of women (73%) mentioned that they are likely to use family planning in the future. However, only 69% of husbands mentioned that they are likely to use contraception in the future. For both women and husbands, intentions to use vary slightly by village. Almost all female and male youth reported that they have the intention to use contraception in the future. Reasons for nonuse (Appendix A Table 3.27) Understanding the reasons that people do not intend to use contraceptives can be helpful in identifying areas for potential interventions. Most of women who do not plan to use a method reported that they are subfecund (34%), menopausal or have had a hysterectomy (28%), or fearing of side effects (14%). Fourteen percent of female non-users mentioned health concerns and 18% mentioned other reasons. The reasons for not planning to use contraceptives vary across villages. For example, 19% of women in Toukh El Khail mentioned that they do not intend to use contraception because of health 26
concerns, while none of the women in Zohra, Nazlet Hussein Ali, Koloba, and Ebshedat mentioned this reason. Twenty-seven percent of women in Koloba mentioned that they fear the side effects, compared to none of the women in Saft Al Khamar village.
Table 3.11 Percentage of Non-Users Reporting Various Reasons for Not Using Family Planning in the Future Women Husbands Menopausal, hysterectomy
28
26
The 2005 MVHS data show that 26% of husbands Subfecund 34 26 reported that they are not planning to use Wants more children 1 10 Health concerns 6 4 contraception because their wives are subfecund, Fear of side effects 14 11 menopausal, or have had a hysterectomy. Ten Other 18 22 percent of husbands who do not intend to use contraception in the future mentioned that they want more children. However, while more than 14% of husbands in Zohra village mentioned this latter reason, only 3% of husbands in Koloba village did. About 8% of husbands in Toukh El Khail mentioned that they do not plan to use contraception in the future because of health concerns, compared to none of husbands in Zohra, Nazlet Hussein Ali and Koloba villages. While 19% of husbands in Koloba reported that they fear the side effects, none of husbands in Zohra and Saft Al Khamar villages did.
27
MATERNAL HEALTH
4
Adequate antenatal care from a medical provider is important in monitoring women’s health status during pregnancy and in avoiding maternal deaths. Appropriate medical care during pregnancy, at delivery, and in the early postpartum period is also crucial in identifying children at greater than average risk of mortality. To obtain data on the use of maternity care services, women were asked a series of questions related to the types of health care services that they received during pregnancy, at delivery, and in the postnatal period. This information was collected for each birth that occurred during the period from the previous interview conducted in the 2004 MVHS up to the time of the 2005 MVHS interview. In addition, husbands and youth were asked a series of questions to assess their knowledge and attitudes toward maternity care. This chapter presents the results of these questions.
4.1
Care During Pregnancy
Women who were pregnant since the 2004 survey were asked about the antenatal care (ANC) they received, including the number of visits, the source of care, and whether they received a tetanus toxoid injection (TT). Husbands and never-married female and male youth were asked about their knowledge about antenatal care and its importance, and about the number of visits that women should make to a health care provider during and after pregnancy. Antenatal care coverage (Appendix A Table 4.1) The World Health Organization (WHO) recommends that a pregnant woman should make at least four antenatal care visits to ensure proper care. Tetanus toxoid injections are a crucial element of adequate pregnancy care and help prevent infant deaths from neonatal tetanus. For the analysis of antenatal care coverage, data were calculated for the total sample only because no sufficient sample sizes are available in each village. During the period from the previous interview conducted in the 2004 MVHS up to the time of the 2005 MVHS interview, 68% of mothers received care during pregnancy, mainly from a doctor (68%). Fortyone percent of mothers received care from the private sector, 37% from the public sector, and 10% from both sectors. The remaining 32% either received care from a non-medical provider, or received no care at all.
Fig 4.1 Percentage distribution of mothers by source of antenatal care 37
41 32
10
Public sector
Private sector
B oth public and
Non-medical
private
provider/no care
Use of public and private sector antenatal care varies across villages. The public sector is the main source of antenatal care services for mothers from Saft Al Khamar (81%), Zohra (68%), Nazlet Hussein Ali (56%), and Monshaat Al Maghalka (44%), while the private sector is the main source of antenatal care services for mothers from the other villages. However, while 68% of mothers received some care during pregnancy, only 51% of them made four visits or more. The level of care varies across villages. Mothers from Zohra and Saft Al Khamar were most likely to make at least 4 visits (70%), while mothers from Ebshedat were least likely to do that (33%). Considering only those births for which the mothers received antenatal care, the data show that the median number of antenatal visits was 6.6 visits. The median number of visits ranges from 5.3 in Ebshedat to 8.8 visits in Saft Al Khamar.
28
To prevent problems, it is recommended that women have their first antenatal checkup early in the pregnancy. Among those births for which antenatal care was reported, the first visit occurred before the 6th month of pregnancy in more than 6 out of 10 cases. The majority of mothers had their last visit during/after the 8 th month of pregnancy (55%).
Fig 4.2 Median number of ANC Visits 8.8 7.5
7.3
7.1
6.9
5.7
Zohra
Care during pregnancy (Appendix A Table 4.2) The questionnaire asked mothers whether they had seen any health worker during the pregnancy for ANC or for a tetanus toxoid injection. The data show that 61% of women received both ANC and TT injections, 25% received TT injections only, 7% received ANC only, and 7% did not receive either.
Saf t Al
Nazlet
Khamar
Hussein
5.3
Toukh El Monshaat Khalil
Koloba
Ebshedat
Al
Ali
Maghalka
Fig 4.3 Percentage distribution of mothers by type of care during pregnancy No ANC/No TT only 25 %
TT
ANC only
7%
7%
There are clear differences in levels of care between villages. Seventy-nine percent of ANC and TT women from Saft Al Khamar received both 61 % ANC and TT injections, compared to only 46% from Toukh El Khail. On the other hand, the percentage of mothers who only received a TT injection was higher in Toukh El Khail (42%) than among mothers from Zohra and Saft Al Khamar (11% and 6% respectively). The highest percentage of mothers who received neither ANC nor a TT injection over the course of pregnancy was in Ebshedat (12%). Husbands’ and youth’s knowledge of antenatal care (Appendix A Tables 4.3-4.4) The majority of husbands, never-married female youth, and never-married male youth have heard about antenatal care (87%, 91%, and 79%, respectively). Also, the majority of respondents (husbands and youth) reported their belief that antenatal care should be obtained from a private provider (85% for husbands and male youth and 75% for female youth), but some believed that it should be obtained from public providers (36% percent or fewer).
Table 4.1 Percentage Who Heard About ANC and Percentage Who Believe ANC Should be Obtained from the Public/Private Sector Never-married Female Male Husbands youth youth Ever heard about ANC Source for ANC Public sector Private sector Both
87
91
79
36 85 2
30 75 3
30 85 1
However, the results differ by village. For example, 92% of husbands in Zohra believed that antenatal care should be received from a public provider, while only 49% said it should be from a private provider. On the other hand, 96% of husbands from Saft Al Khamar favored a private provider, and only 18% preferred a public provider. The same pattern was observed among youth. Husbands and youth were also asked about the appropriate number of antenatal care visits during pregnancy. About 31% of husbands stated that they did not know, while the majority of the other husbands thought that four or more visits would be appropriate (60%). A similar pattern was observed among female youth. Male youth were less knowledgeable about the appropriate number of visits, with 47% of them reporting that they did not know the appropriate number of visits. The median number of visits that husbands thought to be appropriate was 8.9 visits. For female youth
29
the median was 6.2 visits, while for male youth the median was not calculated because no sufficient responses were obtained. Most respondents reported that it is important for a woman to go for antenatal care (89% for husbands, 97% for female youth, and 90% for male youth). Youth’s intention to obtain antenatal care was assessed by asking them, "Do you intend to (let your wife) go for antenatal care?" The results show that 94% of female and male youth reported that they intend to go/let their wives go for antenatal care when they get married.
4.2
Delivery Care
Another crucial element in reducing health risks for mothers and children is the proportion of babies who are delivered in health facilities. Proper medical attention and hygienic conditions during delivery can reduce the risk of complications and infections that can cause death or serious illness for either the mother or the baby. This section discusses three topics related to delivery: place of delivery, type of assistance during delivery, and type of delivery. Place of delivery and assistance during delivery (Appendix A Table 4.5) The women’s questionnaire included questions about the place of delivery, assistance during delivery, and whether the delivery was vaginal or caesarean for women who gave birth since the 2004 MVHS. The data show that 57% of mothers delivered at home, 19% delivered at a private facility and 24% at a public facility. Some differences exist between villages. For example, 71% of mothers from Ebshedat delivered at home, compared to only 44% of mothers from Koloba. On the other hand, 47% of mothers from Koloba delivered at a private health facility, while only 4% of mothers from Toukh El Khail delivered at a private health facility. Related to the fact that 57% of women delivered at home, it was found that 35% of the deliveries were assisted by the Daya. Almost 60% of the deliveries in Saft El Khamar El Sharkia were conducted by the Daya, compared to 5% of deliveries in Koloba. On the other hand, about 87% of deliveries in Monshaat El Maghalka were assisted by a doctor, compared to only 30% of deliveries in Ebshedat.
Fig 4.4 Percentage distribution of mothers by place of delivery
Public facility 24
At home 57
Private f acility 19
Fig 4.5 Percentage distribution of deliveries, by type of delivery assistance 52 35 14
Doctor
Trained
Daya
nurse/midwif e
The 2005 MVHS also asked whether the delivery was a vaginal delivery or a caesarean section. The data show that 87% of all deliveries were vaginal deliveries. There are some differences between villages. In Zohra and Nazlet Hussein Ali, 94% of deliveries were vaginal and 6% were by caesarean section, while in Koloba 72% of deliveries were vaginal and 28% were by caesarean section. Husbands’ and youth’s knowledge of delivery (Appendix A Tables 4.6) The individual questionnaires for husbands and youth included questions concerning their knowledge about the appropriate place of delivery and the person who should assist during delivery. The data show that 53% of husbands thought that women should give birth in a medical facility, while 36% of them thought that the appropriate place of delivery depends on the woman’s health condition. Husbands’ perceptions about the appropriate place of delivery vary by village. Sixty-seven percent of husbands in Zohra village thought that the delivery should be conducted at 30
a medical facility, compared to only 38% of husbands in Koloba village. About 27% of husbands in Saft El Khamar and 19% in Ebshedat indicated that women should give birth at home.
Fig 4.6 Percentage distribution of husbands, by their perception about appropriate places of delivery According
The MVHS data show that 65% of husbands believed that a doctor should assist during the delivery, while 25% percent believed that assistance should depend on the woman’s condition during the delivery.
to her conditions 36 Medical place 53
Eighty-five percent of husbands in Zohra believed At home 11 that the doctor should assist during delivery. This response was expected since most husbands in this village mentioned that the delivery should take place at a health facility. In addition, husbands in Saft El Khamar are more likely to prefer the Daya to assist during delivery (24%) than husbands from other villages. Husbands in Zohra and Monshaat Al Maghalka are least likely Fig 4.7 Pe rce ntage of Husban ds Be lie ving th at a to recommend a Daya (2%). Doctor/Nu rse S hould Assisting During De livery Approximately three quarters of youth (76% of females and 73% of males) responded that delivery should be conducted at a medical facility. About 83% of female and 85% of male youth thought that women should be assisted by a doctor. Also, 13% of female and 12% of male youth believed that the appropriate type of delivery assistance depends on the woman's condition.
86
84 66
64
67
55 45
Saf t
Nazlet
Toukh El
Monshaat
El
Hussein
khail (C)
El
khama
Ali
Zohra
Koloba Ebshedat
Maghalka Doctor/nurse
Table 4.2 Percentage favoring various places of delivery and various types of delivery assistance Never-married Place of delivery/assistance Female during delivery youth
Male youth
Place of delivery In a medical place At home According to her condition
76 5 19
73 5 22
Assistance during delivery Doctor Daya According to her condition
83 4 13
85 3 12
Knowledge of danger signs (Appendix A Table 4.7) Respondents were asked about their knowledge of danger signs that indicate problems with a pregnancy. Bleeding was the most commonly mentioned danger sign (85% of husbands, 79% of male youth, 78% of female youth and 75% of women). It is noteworthy that husbands reported higher awareness that bleeding is a sign of danger than did women. The second most commonly mentioned danger sign by husbands and never-married male youth was high fever, while the second danger sign mentioned by women and never-married female youth was edema of hands, legs, and face.
31
4.3
Postpartum Care
Care after the delivery is very important, not only for the newborn but also for the mother. Proper care for the mother is particularly important when the birth is not assisted by a health care provider. The MOHP recommends several visits for the mother after delivery. The first visit should occur within 2 days after delivery. Subsequent visits should occur after 7 days, after 2 weeks, and after 40 days. Care for the mother (Appendix A Table 4.8) It is assumed that mothers who deliver in a health facility (private or public) will have the first postnatal checkup within the first 2 days after delivery. However, as 57% of women delivered at home, it was found that 66% of mothers did not have any postpartum care. Only 19% of mothers received a postnatal checkup within 2 days of birth. Some differences were observed between villages. While 49% of mothers in Koloba received postnatal care within the first 2 days, only 2% of mothers in Monshaat Al Maghalka did.
Table 4.3 Percentage Aware of Various Pregnancy Danger Signs Women Husbands Bleeding Edema of hands, legs, and face High fever Severe abdominal pain and absence of fetal movement
75
85
34 27
28 29
20
15
Fig 4.8 Percentage of mothers by timing of first postnatal checkup
No care Within 2 days
66
19
3-7 days 6 8-27 days 2
4+ weeks 6
The data from the 2005 MVHS show that almost all postnatal checkups were conducted by a doctor. Furthermore, it was found that 17% of postnatal checkups were conducted at the office of a private doctor or at a clinic, while 8% took place in a hospital. Only 6% took place at the woman’s home. Care for the child (Appendix A Table 4.9) The 2005 MVHS asked mothers whether their last child received any postnatal care following delivery and if so, what the source for this postnatal care was. This information was collected only for children born since the 2004 MVHS. Overall, the data show that more than half of these children (51%) did not receive any care after delivery. Fewer than one fifth (16%) received postnatal care within 2 days of birth and 13% within 3-7 days of birth. Looking at the differences between villages, more than half of children in Koloba received postnatal care within 2 days of birth, compared to only 2% of children in Saft Al Khamar.
Fig 4.9 Percentage distribution of mothers by timing of first postnatal
No care Within 2 days
66
19
3-7 days 6 8-27 days 4+ weeks
2
6
Among those children who received postnatal care, 65% received care at a private doctor’s office or clinic, 12% at a hospital, and 14% at the health unit. Considerable differences were observed between villages. The percentage of children receiving postnatal care at a physician’s office or clinic ranges from 41% for children in Zohra to 82% for children in Ebshedat. For the last birth (since the 2004 MVHS), women were asked whether a blood sample was taken from the child’s heel. Overall, the data show that a blood sample was taken from 91% of last 32
births. Minor differences were observed between villages. Intention to have postnatal care (Appendix A Table 4.10) Husbands were asked about their intention to seek postnatal care for both the newborn and the mother within 1 week of delivery. The likelihood of seeking care was recorded on a 5-point scale ranging from very unlikely to very likely. During the analysis stage, the responses were divided into three groups: likely, unlikely, and somewhat likely. The data show that more than two thirds of husbands (70%) indicated that they were likely to go for medical consultation for their newborn within one week of birth. However, differences were observed between villages. Eighty-five percent of husbands in Koloba reported they were likely to obtain postnatal care for their newborn, compared to only 56% of husbands in Saft Al Khamar. The same pattern was observed for the intention to obtain postnatal care for the mother. Overall, 63% of husbands reported they were likely to let their wives go for medical consultation within one week of delivery. Husbands in Koloba were most likely to let their wives go for postnatal care (84%), compared to 47% of husbands in Saft Al Khamar. Youth have a more positive attitude toward postnatal care than the husbands do. Overall, 77% of female youth and 86% of male youth reported that they are likely to obtain a medical consultation for their newborn within one week of birth. In addition, 75% of female youth mentioned that they were likely to go for postnatal care after delivery and 79% of male youth mentioned that they were likely to let their wives go for postnatal care.
Table 4.4 Intention to Have Postnatal Care for Mother and Child Never-married Female Male Husbands youth youth Intention to do postnatal care for the newborn Unlikely (%) Somewhat likely (%) Likely (%)
Substantial differences were observed Intention to do postnatal between villages. Female youth from Nazlet care for the wife Hussein Ali and male youth from Koloba were Unlikely (%) most likely to intend to obtain postnatal care Somewhat likely (%) Likely (%) for both mother and child, while female youth from Toukh El Khail and male youth from Nazlet Hussein Ali were least likely to intend to seek postnatal care.
4.4
11 7 70
3 4 77
1 4 86
13 11 63
4 4 75
2 8 79
Attitudes towards Maternal Health
Respondents were asked to express their attitudes toward postnatal care for the mother and the newborn within the 1st week after delivery. The interviewer read two statements to the respondents and asked about their level of agreement. The responses were presented on a 5-point scale ranging from strongly disagree to strongly agree. During the analysis stage, the responses were grouped into three categories: agree, disagree, and neutral. In addition, respondents were asked to list the advantages of having postnatal care for the mother and the child within the 1st week after delivery.
Fig 4.10 Percentage agreeing that a newborn must receive postnatal care within one week of birth 92
Attitudes toward postnatal care for mother and child (Appendix A Table 4.11) The individual questionnaires included questions about the attitudes of all respondents toward postnatal care for the child and toward consulting a provider about starting family planning after delivery. The data show that most respondents agree that the newborn must
82
84
79
Women
Husbands
Never-married
Never-married
f emale youth
male youth
33
receive a medical consultation within one week of birth (79% among women, 82% among husbands, 84% among female youth and 92% among male youth). However, there are remarkable differences between villages. Overall, respondents from Monshaat El Maghalka and Koloba are very likely to agree that a postnatal checkup within the 1 st week is necessary for the newborn, while respondents (except for male youth) from Toukh El Khail are least likely to agree on that. Almost 94% of women from Monshaat Al Maghalka village agreed that the newborn must be taken for postnatal care within one week of birth, compared to only 59% among women in Toukh El Khail. Regarding the attitudes of respondents towards postnatal checkup for the mother to begin using family planning, data of 2005 MVHS shows that 71% of women, 74% of husbands, 79% of female youth, and 86% of male youth agreed that a provider should be consulted within one week after the delivery to discuss starting the use of family planning.
Fig 4.11 Percentage agreeing a provider should be consulted within one week fo delivery to siscuss famlily 71
86
79
74
However, marked differences in attitudes toward postnatal care for women were observed between villages. Women, Women Husbands Never-married Never-married husbands, and female youth from Monshaat f emale youth male youth Al Maghalka village are most likely to agree that it is necessary to consult a health provider within one week of delivery to start using contraception (92%, 94%, and 97%, respectively). On the other hand, only about half of both women and husbands in Toukh El Khail village agree this is necessary. Nearly all never-married male youth from Koloba agree such a visit to discuss family planning is needed (98%). Advantages of postnatal care (Appendix A Table 4.12) The individual questionnaires addressed perceptions regarding the advantages of postnatal care for mother and newborn. The data show that the most often mentioned advantage of having postnatal care for the child is that it checks the child’s health. The second most mentioned advantage was early detection of childhood diseases. Some differences were observed between villages. For example, women in Monshaat Al Maghalka are more likely than women elsewhere to mention that postnatal care is important to check for the child’s health (98%).
Table 4.5 Advantages of Having Postnatal Medical Consultation for Mother and the Newborn Never-married Female Male Advantage of having postnatal care Women Husbands youth youth Percentage mentioning specific advantages of having postnatal care for child Check child's health Check child's umbilicus Early detection of any child's disease Percentage mentioning specific advantages of having postnatal care for mother Check mother's health Not to be pregnant/take family planning consultation Give her tonics Early detection of any postpartum disease
82 11 23
83 12 24
83 11 27
87 5 33
76
80
79
85
13 6
13 7
15 9
13 3
8
7
13
9
Regarding the advantages of postnatal care for mothers, the data show that the most commonly mentioned advantage is that it checks the mother’s health. The second most important advantage mentioned by all respondents was that it provides an opportunity to have a family planning consultation. Important differences were observed across villages. For example, while more than one third of women (21%) in Monshaat El Maghalka listed family planning consultation as one of the advantages of postnatal care, only 6% of women in Toukh El Khail cited that as an advantage.
34
CHILD HEALTH
5
Increasing the proportion of children who are vaccinated against the major preventable diseases is a cornerstone of Egypt's child survival programs. In addition, promoting the treatment of acute respiratory infection and diarrhea is one of the important aspects of child health. The 2005 MVHS collected information on the level of immunization among young children (12-23 months). Additionally, it considers information on the prevalence and treatment of diarrhea and acute respiratory infections, which are the most common causes of childhood deaths in Egypt. Finally, the chapter looks at breastfeeding data and vitamin A supplementation.
5.1
Immunization of Children
Egypt’s Ministry of Health and Population has adopted the World Health Organization guidelines for childhood immunizations that call for all children to receive several vaccinations during the 1st year of life. The recommended vaccinations include a BCG vaccination against tuberculosis, three doses of the DPT vaccine (DPT 1, DPT 2, and DPT 3) to prevent diphtheria, pertussis and tetanus, three doses of polio vaccine (Polio 1, Polio 2, and Polio 3), and a measles vaccination. In addition to these standard immunizations, the Egyptian childhood immunization program recommends that children receive three doses of the hepatitis vaccine, poster doses for DPT and polio, and the MMR vaccine against Measles, Mumps, and Rubella. Immunization levels (Appendix A Table 5.1) The 2005 MVHS collected immunization information for children ages 12-23 months. This age range was chosen to assess the current situation with respect to recommended child immunization coverage. The findings show that birth records and/or health cards were available and seen for 73% of those children. For children who did not have a birth certificate or a health card, the information on vaccinations was based on mother's report. Results of the 2005 MVHS reveal that 93% of children ages 12-23 months have received BCG;; around 90% have received the recommended three doses of the DPT and polio vaccines (DPT 1-3 and polio 1-3); and 92% have received a measles vaccination. Overall, 85% of children are considered fully immunized against all preventable childhood diseases; that is, they have received a BCG, the three doses of DPT, the three polio doses, and the measles immunizations.
Fig 5.1 Percentage of children 12-23 months who are fully immunized 92 85
MVHS 2005
MVHS 2004
Looking at the other vaccines, the coverage levels are relatively high for the hepatitis vaccine, with 87% of children reported as having received the third hepatitis vaccine dose. The data display low levels for the other vaccines. Only 26% of children had received the Polio 0 vaccine; 31% received Activated DPT; 37% received Activated Polio; and 38% received MMR. Differentials in vaccination coverage (Appendix A Table 5.1) Looking at the differences in the proportion of children considered fully immunized, there are no significant differences in immunization coverage between boys and girls (84% versus 86%, respectively). The lowest percentage of fully immunized children was found for children whose mother never attended school (80%), while the highest percentage was found among children whose mothers completed primary education or some secondary (100%). Children whose mothers are working for cash are more likely to be fully immunized (89%) than children whose mothers are not (84%).
35
5.2
Prevalence and Treatment of Diarrhea (Appendix A Table 5.2)
In the 2005 MVHS, mothers of children born since January 2002 were asked whether any of their children had diarrhea during the 2-week period prior to the survey. If the child had had diarrhea, the mother was asked about feeding practices during the diarrheal episode and about the actions that were taken to treat the diarrhea. Overall, 20% of children were reported as having had diarrhea in the 2-week period prior to the survey. The age pattern shows the typical peak in diarrhea prevalence among children age 6-23 months. The 2005 MVHS results indicate that some effort Fig 5.2 Percentage of children was made to treat the diarrhea in most young treated for diarrhea by a health children; mothers reported that nothing was done in provider only 19% of the cases. With regard to specific 64 actions taken when a child was ill with diarrhea, 38 mothers sought advice or treatment from a health 29 provider in 64% of the diarrheal episodes. Among those receiving medical advice, private health care providers were consulted more often than public sector providers (38% vs. 29%). However, Any health Public provider Private provider provider respondents seeking public or private provider care differed by mother’s educational levels. Mothers with high educational levels are more likely to seek private providers, while those of low educational levels tend to seek public providers. Almost 43% of the ill children received oral rehydration therapy (either ORS packets or RHS at home) to prevent dehydration. In addition, for almost 60% of ill children, the mothers reported that they give ORT and increase the amount of fluids during diarrheal episodes. Also, children of first birth order are more likely to receive antibiotics than children of higher orders. 5.3
Prevalence and Treatment of Acute Respiratory Infections (Appendix A Table 5.3)
Along with diarrhea, acute respiratory infection (ARI) is a common cause of death among infants and young children. The 2005 MVHS collected information on the prevalence and treatment of ARI and on the type of treatment children with ARI symptoms had received. The prevalence of cough with short, rapid breathing during the 2-week period prior to the survey was 9% among children born since January 2002. Figure 5.3 indicates that the highest rate of illness was among children 611 months (17%), followed by children under 6 months (10%), children 12-23 months and 24-35 months (9% each), and children and 36-47 months (3% each).
Fig 5.3 Pre valen ce of ARI among children 17
10
9
9 3
Under 6 6 - 11 12 - 23 24 - 35 36 - 47 Among children ill with ARI symptoms, the month majority (76%) were given medical treatment by a health provider, while 19% of children did not receive any treatment. Those who were most likely to receive medical care included male children, children who are first-born and whose mothers are not working for cash. In addition, 53% of ill children received antibiotics to treat respiratory illness.
36
5.4
Breastfeeding and Supplementation
Initiation of breastfeeding (Appendix A Table 5.4) Breastfeeding data for the 2005 MVHS was collected for children born during the period between the 2004 and 2005 surveys. Figure 5.4 shows that 97% of children born after the 2004 MVHS survey were breastfed. Among those children who were ever breastfed, the majority began breastfeeding soon after birth, 62% of the children were put to the breast within an hour of delivery, and 68% of children were breastfed within the 1st day. It is worth mentioning that less than two thirds of children (62%) received prelacteal feeding during the first 3 days after birth.
Fig 5.4 Percentage of children according to breastfeeding status 97 68
62
Ever breastf eed
Start within 1 hour
Start within 1 day
Introduction of complementary feeding (Appendix A Table 5.5) To obtain information on feeding patterns, mothers were asked about the breastfeeding status in the 24-hour period before the interview for all children born between the 2004 and 2005 surveys. They were also asked about other liquids or solids, if any, that had been given during that 24-hour period. Exclusive breastfeeding is common but not universal among very young infants, where 69% of infants under 2 months of age received only breast milk. This percentage decreased to 56% among children 2-3 months of age. As expected, older children are more likely to receive complementary foods or milk than younger children. Where as 22% of infants 3 months or less received complementary foods/milk, this figure increased to 54% among children 4-6 months of age and to 79% among children 79 months of age.
Fig 5.5 Percentage of children who are bottlefed, by mother's level of education 21 16
14 8
No education
Primary
Primary
Secondary
incomplete
comp/some
complete/higher
secondary
Differentials in the duration and frequency of breastfeeding and bottle-feeding (Appendix A Table 5.6) Data from the 2005 MVHS were used to calculate the median duration of breastfeeding and the prevalence of bottle-feeding for children born during the period between the 2004 and 2005 MVHS interviews. Overall, the 2005 MVHS median duration of breastfeeding is 6.9 months. Children are exclusively breastfed or predominantly breastfed for 2.7 months and 5.4 months, respectively. Given that the median duration of breastfeeding was calculated for the limited period between the two surveys, these figures are not as high as the baseline. Looking at differentials in the median breastfeeding duration, children born in health facilities are breastfed for a somewhat shorter period than those born at home. A similar pattern is observed for the relationship between assistance at delivery and breastfeeding durations. The median duration of breastfeeding for children whose mothers were assisted at delivery by a medical provider was 6.4 months, compared to 7.1 months for children whose mothers received assistance at delivery from a Daya. Looking at other characteristics, the median duration of breastfeeding for male babies tends to be shorter than for females (6 vs. 7.5 months).
37
Overall, 16% of children are bottle-fed. Bottle-feeding is more common among children born in health facilities than those born at home. Also, bottle-feeding is more common among children whose mothers were assisted at delivery by a medical provider than among children whose mothers received assistance at delivery from a Daya. In addition, children whose mothers completed secondary and/or higher education are more likely to be bottle-fed (21%) than children whose mothers were not educated or did not complete primary school (14% and 8%, respectively).
5.5
Vitamin A Supplementation among Children (Appendix A Table 5.7)
Beginning at the age of 9 months (typically at the same time the child receives the measles vaccination) young children are given one vitamin A capsule (100,000 international units). Two additional capsules are given to children at the age of 18 months; at the time when the activated polio dose is administered. Data of the 2005 MVHS examines coverage of vitamin A supplementation among children aged 12-23 months at the time of the survey. The rate of vitamin A supplementation is based on reports by the mother that the child received a capsule. About 68% of children aged 12-23 months have received a vitamin A capsule. Children of second and third order and those whose mothers have completed primary education and are working for cash are more likely to receive vitamin A than other children.
38
Fig 5.6 Percentage of children 1223 months who received vitamin A 68
64
MVHS 2005
MVHS 2004
KNOWLEDGE, ATTITUDES, PERCEPTIONS, AND PRACTICES RELATED TO HIV/AIDS, HEPATITIS C, AND SAFE INJECTIONS 6 The MVHS 2005 questionnaires included the same questions that were administered in the baseline on HIV/AIDS, Hepatitis C, and safe injection knowledge, attitudes, perceptions, and practices. Program efforts are aimed at increasing awareness about these topics. The data of this follow up survey assess these efforts over a period of one year as well as provide information on the channels through which people obtain their information.
6.1
Knowledge and Perceptions Related to HIV/AIDS
Respondents were asked a series of questions to assess their knowledge of HIV/AIDS and its modes of transmission, their sources of information on the topic, and their perceptions about HIV/AIDS. Knowledge of HIV/AIDS (Appendix A Table 6.1) All respondents in MVHS were asked if they had ever heard of HIV/AIDS. The data reveal that 79% of women had ever heard about HIV/AIDS, which was the lowest percentage among the different groups of respondents. Around ninety percent of husbands and never-married male youth and 88% of never-married female youth had ever heard about HIV/AIDS. Differentials between villages are clear, where for example; 97% of women from Nazlet Hussein had ever heard about HIV/AIDS compared with only 68% of women from Saft Al Khamar.
Fig 6.1 Percentage who are aware of HIV/AIDS , by group 92
88
91
79
Wo men
H usbands
N everN evermarried married male f emale yo ut h yo uth
Television was the most common source of knowledge by far. Ninety percent or more of respondents who were aware of HIV/AIDS reported hearing about it on television in the past 6 months. It is worth mentioning, that other sources of knowledge were negligible (4% or less each). There were no discrepancies among the villages with regard to the sources of knowledge. Modes of transmission of HIV/AIDS (Appendix A Table 6.2) Respondents who had heard about Table 6.1 Knowledge of Modes of Transmission of HIV/AIDS were asked to name at least HIV/AIDS (Among Respondents Aware of HIV/AIDS) two ways through which it could be Never-married transmitted. The data reveal that even Female Male among those aware of HIV/AIDS, a Women Husbands youth youth significant number of respondents lack Percentage Aware of sufficient knowledge about the modes of Various Modes of transmission, especially with regard to Transmission of mother-to-fetus transmission. Among HIV/AIDS respondents aware of HIV/AIDS, the Illicit sexual relations 57 69 50 55 percentage who mentioned that HIV/AIDS Blood transfusion 57 71 64 61 Infected needles 55 60 64 51 can be transmitted through illicit sexual 1,243 1,486 419 846 Number relations ranged from 50% for nevermarried female youth to 69% for husbands. Blood transfusion was cited as a mode of transmission by 57% of women and 71% of husbands. Only 3 % of respondents mentioned mother-to-fetus transmission (except for male
39
youth where 5 % mentioned blood transfusion). Data from the 2005 MVHS show that knowledge about the modes of HIV transmission varies across villages. For example, among those aware of HIV/AIDS, 75% of women in Zohra village mentioned illicit sexual relations as one of the modes of transmission of AIDS, compared to only 25% of women in Nazlet Hussein Ali. Of those who had heard of HIV/AIDS, almost 80% of husbands and 90% of never-married male youth in Koloba mentioned illicit sexual relations as one of the modes of transmission. By contrast, only 40% of husbands in Nazlet Hussein Ali and 14% of never-married male youth in Saft Al Khamar mentioned this as a mode of transmission. Respondents in Zohra were more likely to mention the transmission of AIDS “infected needles” than respondents in any other village. The data also disclose that a large number of women and female youth aware of HIV/AIDS in all villages are under the impression that casual physical contact is a mode of transmission (22% and 23% respectively). However, husbands and nevermarried male youth aware of HIV/AIDS were least likely to mention casual physical contact as a mode of transmission (3% and 8% respectively). Perceptions related to HIV/AIDS (Appendix A Table 6.3)
Fig 6.2 Percentage of target groups who believe that AIDS can be transmited through casual physical contact with an infected person, by group 23
22
8 3
Wo men
H usbands
N everN evermarried married male f emale yo ut h yo uth
A series of statements was read to respondents in all target groups to assess their perceptions related to HIV/AIDS. The responses were ranked/calibrated on a scale of 1-5 (strongly disagree, disagree, neutral, agree, and strongly agree). During the analysis stage, the responses were recoded into three categories: agree, disagree, and neutral. Almost all respondents aware of HIV/AIDS agree that acquiring an HIV/AIDS infection is severe (98% of women and female youth, and 99% of husbands, and male youth). Perceptions about the severity of HIV/AIDS vary little across villages. Among respondents aware of HIV/AIDS, approximately 25% believe it is possible that they could become infected with HIV/AIDS. Women from Toukh El Khail were less likely (less than 1%) than women from other villages to believe they could get infected, while husbands from Koloba were the least likely to believe so (8%). Most respondents who know about HIV/AIDS are not aware that using condoms is an effective way to prevent HIV/AIDS infection, and a significant number believe using condoms is ineffective. For example, among respondents aware of HIV/AIDS, 55% of women report not knowing whether using condoms is effective and 28% state that it is effective. Among husbands, 33% do not know if condoms are effective and 36% believe they are ineffective. Among nevermarried youth with knowledge of HIV/AIDS, awareness of the effectiveness of condoms for HIV/AIDS prevention is even lower: Sixty nine percent of never-married female youth and 35% of never-married male youth report not knowing if condoms are effective. The data show that more than two thirds of respondents aware of HIV/AIDS agreed that it is a serious problem in Egypt. However, significant differences were observed between villages for husbands and male youth. Among those aware of HIV/AIDS, around 90% of never-married male youth in Koloba agreed that HIV/AIDS is a serious problem in Egypt, compared to only 32% of never-married male youth in Monshaat Al Maghalka. Nearly half of all respondents who have knowledge of HIV/AIDS, with the exception nevermarried male youth, agree with the statement, “The HIV/AIDS problem in Egypt will increase in
40
the coming years” (48% of women, 57% of husbands, 45% of never-married female youth, and 63% of never-married male youth). Whereas 70% of never-married female youth in Saft Al Khamar agreed that the HIV/AIDS problem is likely to increase, only 12% in Koloba did. Most respondents are confident that they can protect themselves from HIV/AIDS (88% of husbands, 86% of never-married male youth, 82% of women, and 83% of never-married female youth).
6.2
Knowledge and Perceptions Related to Hepatitis C
A series of questions was asked to assess respondents’ knowledge of Hepatitis C and its modes of transmission, their source of information about Hepatitis C, and their perceptions about the disease. Knowledge of Hepatitis C (Appendix A Table 6.4) Around 60% or more of all respondents are aware of Hepatitis C (59% of women, 64% of never-married female youth, 70% of never-married male youth, and 77% of husbands). These findings indicate that knowledge about Hepatitis C is much lower than knowledge about HIV/AIDS among all groups. Awareness of Hepatitis C was higher among husbands and never-married male youth in Zohra than in any other village, while it was higher in Nazlet Hussein Ali among women and nevermarried female youth.
Fig 6.3 Percentage who ever heard about hepatitis C, by group 77
Wo men
70
64
59
H usbands
N everN evermarried married male f emale yo ut h yo ut h
Respondents who had heard about Hepatitis C were asked about their last source of information about the disease. Television was the most commonly mentioned source of information among all groups, and was cited by 76% of women, 77% of never-married female youth, 71% of nevermarried male youth, and 58% of husbands. The second most commonly noted source of information was the “other” category which includes relatives, friends and neighbors, and other sources. Twenty-nine percent of husbands, 17% of never-married male youth, 16% of nevermarried female youth, and 14% of women reported last hearing about Hepatitis C from these latter sources. Modes of transmission of Hepatitis C (Appendix A Table 6.5) Respondents who had heard about Hepatitis C were asked to name at least two ways by which Hepatitis C can be transmitted. As was the case with AIDS, the data reveal that even among those who had heard of Hepatitis C a large number lack sufficient knowledge about the modes of transmission.
Table 6.2 Knowledge of Modes of Transmission of Hepatitis C Never-married Female Male Women Husbands youth youth Percentage Aware of Various Modes of Transmission of Hepatitis C Blood transfusion Infected needles Casual physical contact with an infected person
60 64
70 75
58 70
56 73
Among respondents aware of 28 20 27 14 Hepatitis C, the most commonly 739 1022 229 526 Number mentioned mode of transmission was infected needles, which was mentioned by around two-thirds or more of respondents. However, respondents in Zohra, with exception to women, were more likely to mention infected needles as one of the modes of
41
transmission than respondents in any other village. The next most commonly mentioned mode of transmission was blood transfusion, which was listed by 56% of never-married male youth, 58% of never-married female youth, 70% of husbands, and 60% of ever- married women. A large percentage of the respondents aware of Hepatitis C have the notion that it can be transmitted through casual physical contact with an infected person (28% of women, 27% of never-married female youth, 20% of husbands, and 14% of never-married male youth). A small percentage of respondents aware of Hepatitis C mentioned that sexual relations can transmit Hepatitis C, with the highest percent reported by women (14 %) and the lowest percent reported by nevermarried male youth (3%).
Fig 6.4 Percentage of target groups who believe that Hepatitis C can be transmitted 14 through sexual relations, by group 11
11
3
Wo men
H usbands
N everN evermarried married male f emale yo ut h yo ut h
Perceptions related to Hepatitis C (Appendix A Table 6.6) Respondents were read a series of statements to assess their perceptions related to Hepatitis C. The answers were coded on a 3-point scale (disagree, neutral, agree). Almost all respondents aware of Hepatitis C agree that the infection is severe with limited differences between villages. The majority of these respondents believe that it is not possible for them to contract it, as indicated by the high disagreement with the statement, "It is possible that you will contract Hepatitis C". Forty percent of women, 34% of husbands, 23% of never-married male youth and 39% of never-married female youth aware of Hepatitis C, indicated that they do not think it is possible that they will contract Hepatitis C. The data show that respondents from Monshaat El Maghalka aware of Hepatitis C are most likely to believe they cannot contract it, while respondents from Saft El Khamar are least likely to believe they cannot contract the disease (except for never-married male youth). Never-married male youth from Toukh El Khail are most likely to believe they cannot contract Hepatitis C (60%), while those in Koloba are least likely to believe they cannot contract the disease (11%). Among respondents aware of Hepatitis C, around 90% agreed that use of disposable syringes is an effective way to prevent Hepatitis C.
6.3
Knowledge, Attitudes, and Practices Related to Blood Borne Diseases and Safe Injections
The 2005 MVHS included the same questions that were asked in the baseline survey concerning blood borne diseases and safe injections. These questions covered knowledge, attitudes and practices. Knowledge of blood borne diseases and safe injections practices (Appendix A Table 6.7) Respondents were asked if they had ever heard about blood borne diseases that can be transmitted through used needles. The results show that 56% of ever-married women and 68% of husbands had heard about blood borne diseases that can be transmitted through syringes. In addition, respondents from Zohra had higher awareness of blood borne diseases than respondents in other villages.
Table 6.3 Percentage Aware of Blood Borne Diseases that Can Be Transferred Through Used Needles
HIV/AIDS Hepatitis C Tetanus
Women
Husbands
61 48 7
80 66 6
Respondents who were aware of blood borne diseases were asked to list the ones they knew. HIV/AIDS was most often mentioned, followed by Hepatitis C and tetanus. HIV/AIDS was mentioned by 61% of women, 80% of husbands 70% of nevermarried female youth, and 81% of never-married male youth. Breakdown by village shows that 42
HIV/AIDS was most often mentioned by ever-married women and never-married male youth from Zohra (75% and 93% respectively), and by husbands from Koloba (96%). Tetanus was listed by only 7% of women, and 6% of husbands. Hepatitis C was mentioned by two-third of husbands (66%), but less by women (48%). However, in Nazlet Hussein Ali village Hepatitis C was mentioned by over three quarter of those aware of blood borne diseases. All respondents were asked to name the methods that prevent the risk of infection from infected needles. The most commonly mentioned way to prevent infection from needles was not to share or reuse needles, a method cited by 86% of ever-married women, 85% of never-married female youth, 88% of husbands, and 75% of nevermarried male youth. The second most mentioned method was to purchase disposable syringes for the provider to use. Twenty-eight percent of nevermarried male youth, 17% of husbands, 13% of never-married female youth, and 11% percent of ever-married women referred to this method.
Fig 6.5 Percentage who believe in selected methods of reducing the risk of infection from infected needles, by group 88
86
85 75
28 17
13
11
Wo men
H usbands
N ever-married f emale yo ut h
N ever- married male yo ut h
Not sh arin g/re using ne e dle s Pu rch asin g disposable syrin ge for the provide r to use
The percentage of respondents who did not know any method for preventing infection from infected needles was low, ranging from 6% (husbands) to 11% (ever-married women). Self-efficacy with respect to safe injection practices (Appendix A Table 6.8) Respondents were read several statements to assess their intentions with respect to safe injection practices. The responses were measured on a scale of 1-5 (very unlikely, unlikely, somewhat likely, likely, and very likely). During the analysis stage, the responses were recoded into three categories: likely, unlikely and somewhat likely. The first statement asked all respondents how likely they would be to ask a medical service provider to use a disposable syringe. The second statement asked about the likelihood of them asking the medical service provider to dispose of the needles/syringes properly. Almost all respondents reported being likely to ask the medical service provider to use a disposable syringe (94% of never-married male youth, 91% of husbands, 91% of never-married female youth, and 90% of ever-married women).
Fig 6.6 Percentage of respondents likely to ask a medical service provider to dispose of needles/ syringes properly, by group 75
78
Wo men
H usbands
73
81
N everN evermarried married male f emale yo uth yo uth
Most respondents reported being likely to ask the medical service provider to properly dispose of the needles/syringes, with percentages ranging from 73 % for never-married female youth to 81% for never-married male youth.
43
Practices related to safe injection (Appendix A Table 6.9) Quite a few respondents report ever having asked the service provider to use a disposable syringe (11% of ever-married women, 12% of husbands, 12% of never-married female youth, and 6% of never-married male youth). These percentages may reflect the fact that a relatively high percentage of respondents bring their own syringes with them (around one fifth of husbands, never-married female and male youth, and 31% of women). About two thirds of women and husbands and about half of never-married female and male youth mentioned that they had ever purchased or obtained syringes for use at home. When respondents who had ever purchased or obtained syringes for use at home were asked if they or any family member1 had ever reused a syringe, a relatively high number answered affirmatively. Fifteen percent of women, 13% of husbands, 15% of never-married male youth, and 15% of never-married female youth reported having reused a syringe at least once.
Fig 6.7 Percentage who had ever purchased a syringe, by group 15
15
15
13
Wo men
H usbands
N everN evermarried married male f emale yo ut h yo ut h
Respondents who had ever purchased or obtained syringes for use at home were asked about their method of disposal of syringes after use. Most of these respondents indicated that they throw the syringes in the garbage without destroying them. Nevertheless, there is a promising degree of awareness of the need to dispose of used syringes properly, as 29% of husbands, 38% of nevermarried male youth, 26% of never-married female youth, and 24% of women report destroying the needle so that it cannot be used again. Fig 6.8 Percentage of those who had ever purchased a syringe, who dispose of them by throwing it in the garbage, by group 88
87 83
77
Wo men
1
Included only in the women’s questionnaire.
44
H usbands
N everN evermarried married male f emale yo ut h yo ut h
HEALTHY LIFESTYLES AND PASSIVE SMOKING
7
Promoting healthy lifestyles of households is one of the main objectives of the CHL program. In order to encourage healthy behaviors and consequently health lifestyles, the program aims to increase demand for health services. Thus, with these objectives in mind, information about attitudes and practices related to healthy lifestyles, specifically, information on hand washing, smoking, and passive smoking, were collected.
7.1
Hand Washing Practices (Appendix A Table 7.1)
Respondents were asked about their hand washing practices. Overall, approximately half of the respondents indicate that they wash their hands 4-6 times a day. About one quarter of women and never-married female youth and one Fig 7.1 Percentage of respondents who report third of husbands and never-married selected daily hands washing practices male youth report washing their hands 1-3 times a day. In addition, 57 56 less than one percent of respondents 49 48 claim that they never wash their 34 35 hands. There are striking differences 25 between villages. Women, 22 20 19 17 16 husbands, and never-married female youth in Nazlet Hussein Ali were the most likely to wash their hands Wo men H usbands N ever-married N ever- married 4-6 times per day (73%, 55%, and f emale yo ut h male yo ut h 73%, respectively). Never-married 1-3 time s 4-6 time s 7 tim e s or m ore male youth from Zohra were most likely to wash their hands 4-6 times per day (86%). Respondents who reported washing Fig 7.2 Percentage of respondents who report their hands were asked when they washing their hands at specific times (among those tend to do so. Differences were who wash their hands) found among the target groups and 95 94 91 94 91 90 across villages. More than 90% of 87 88 85 84 83 80 the husbands and never-married 75 74 73 67 female and male youth wash their hands after eating compared to 87% of women. The percentage of those respondents who wash their hands before eating is much lower (80% of never-married female youth, 75% of Wo men H usbands N ever- married N ever- married husbands, 73% of women, and 67% female yo ut h male yo ut h of never-married male youth). Clear When waking up in the mo rning B efo re eat ing differences were observed across A ft er eat ing A f ter using the bat hro o m villages. While 93% of women from Toukh El Khail wash their hands before eating, only 44% from Ebshedat tend to do so. Ninety one percent of never-married female youth, 85% of women, 83% of husbands, and 74% of never-married male youth reported that they wash their hands when waking up in the morning, with clear variations across villages. While all never-married male youth from Koloba wash their hands when waking up in the morning, only 42% of never-married male youth from Zohra tend to do so. Moreover, 90% of never-married female youth, 88% of women, 94% of husbands, and 84% of never-married male youth reported that they tend to wash their hands after using the bathroom.
45
Clear differences were observed across villages. Almost all women from Nazlet Hussein Ali tend to wash their hands after defecation, compared with three quarter of women from Ebshedat.
7.2
Performing Usual Activities (Appendix A Table 7.2)
Respondents were asked about their Fig 7.3 Percentage of respondents who ability to perform their usual currently have difficulty in performing usual activities in order to assess their 96 health status. Overall, 96% of never86 86 married male youth, 86% of 74 husbands and never-married female youth had no difficulty in performing their usual activities. 23 13 13 Only, 23% of women, 13% of 4 3 1 1 0 husbands and never-married female Women Husbands Never-married Never-married youth, and 4% of never-married f emale youth male youth male youth had some difficulty in performing their usual activities. No difficu lty Some difficu lty Gre at difficulty Some differences were found between villages. About one quarter of husbands from Saft El Khamar village had some difficulties in performing their usual activities compared to only 4% of husbands from Koloba village. It is worth mentioning that almost all never-married male youth from Koloba village had no difficulties in performing their usual activities. Respondents were asked about the Fig 7.4 Percentage of respondents reporting to number of days that they were have been unable to perform usual activities for unable to perform their usual 0,1-7,8-14 days 86 activities or work during the month 76 73 preceding the survey. Results show 60 that about one third of women, 23% of husbands, 22% of never-married 33 23 22 female youth, and 12% of never12 married male youth reported that 3 2 1 1 they weren’t able to perform their Women Husbands Never-married Never-married male usual activities for 1-7 days during female youth youth the month preceding the survey. Differentials were observed between Non e 1-7 days 8-14 days villages. Forty four percent of women from Koloba village reported that they were not able to perform their usual work for 1-7 days, compared to one fifth of women from Monshaat El Maghalka. Moreover, results show that around three quarters of husbands and never-married female youth, and 86% of never-married male youth mentioned that they were able to perform their usual activities every day during the month preceding the survey.
7.3
Knowledge, Attitudes, Practices, and Perceptions Related to Smoking
Practices related to smoking (Appendix A Table 7.3) Respondents in the different groups were asked about their smoking practices. Due to the small number of female smokers, results are shown for males only. Results show that smoking is a common practice among males. Overall, 57% of husbands and 21% of never-married male youth reported that they smoke any kind of tobacco, with some differences across villages. Thirty percent of never-married male youth from Nazlet Hussein Ali reported that they smoke any kind of tobacco compared to 11% of never-married male youth from Monshaat El Maghalka. Those who smoke were asked about their smoking practices. Cigarette smoking is the most common type of smoking practice (74% of husbands and 82% of never-married male youth). The
46
data also show that 35% of husbands and 22% of never-married male youth report smoking a water pipe (“shisha”). Smoking rolled cigarettes is a rare practice. Differentials were observed across Fig 7.5 Percentage of males who smoke any kind of villages. While 91% of husbands who tobacco, by village smoke from Zohra village reported 69 smoking cigarettes, only 69% of 66 husbands from Nzalet Hussien Ali 56 54 52 reported smoking cigarettes. Among 48 43 never-married male youth who smoke, all respondents from Zohra and 30 25 21 Koloba reported smoking cigarettes. 18 17 13 The mean number of cigarettes 11 smoked per day by both husbands and never-married male youth was about Z o hra Saf t El N azlet T o ukg ElM o nshaat Ko lo ba Ebshedat 16. In terms of the water pipe Khamar H ussein Khail El A li M aghalka “Shisha”, the highest percentage of smoking among husbands was found Hu sbands Neve r-married male youth in Nazlet Hussein Ali (46%), while the highest percentage among never-married male youth was found in Ebshedat (41%). Attitudes toward smoking (Appendix A Table 7.4) Respondents were read a set of four statements to assess their attitudes toward smoking. Responses were presented on a scale of 1-5, where 5 means strongly agree and 1 means strongly disagree. For the purpose of the analysis, responses were regrouped into three categories: agree, disagree, and neutral.
Table 7.1 Attitudes Toward Smoking Never-married Female Male Women Husbands youth youth Smoking endangers the health of smokers (Mean) Smoking endangers the health of people around smokers (Mean) Smoking reduces a person's ability to participate in sports (Mean) Creating a nonsmoking area in your home is an effective way to reduce the harmful effects of exposure to secondhand smoke (Mean)
4.8
4.7
4.8
4.8
4.6
4.5
4.6
4.6
4.4
4.3
4.4
4.5
Results show that there is 4.3 4.2 4.4 4.4 almost a universal agreement among respondents that smoking endangers the health of both the smoker and the people around the smoker. Slight differences were observed among target groups and across villages. When respondents were asked whether smoking reduces a person’s ability to participate in sports, 93% of never-married male youth agreed with the statement compared with 85% of the other target groups. Some variations were observed across villages. Ninety seven percent of husbands from Koloba agreed that smoking reduces a person’s ability to participate in sports compared with 71% of husbands from Zohra. Respondents were also asked whether creating a nonsmoking area at home is an effective way to reduce the harmful effects of exposure to secondhand smoke. Results showed that never-married male youth reported the highest level of agreement (89%) compared with women (81%), husbands (80%), and never-married female youth (82%). Differences were clear across villages. While 94% of women from Monshaat El Maghalka agreed that creating a nonsmoking area at home is an effective way to reduce the harmful effects of exposure to secondhand smoke, only 70% of women from Toukh El Khail agreed with the same point. Knowledge of the health effects of secondhand smoke exposure (Appendix A Table 7.5) To assess their knowledge about health effects of secondhand smoke exposure, respondents were 47
asked to name some of them. The data show that respiratory problems Table 7.2 Knowledge of the Health Effects of Exposure to are the main health effect identified by the Secondhand Smoke respondents (87% of husbands, 86% of Never-married never-married male youth, 84% of Female Male women, and 83% of never-married female Women Husbands youth youth youth). Differences were observed across Heart Disease 36 39 38 37 villages. Ninety six percent of neverRespiratory problems 84 87 83 86 married female youth from Monshaat El High blood pressure 14 16 15 19 Maghalka reported respiratory problems Cancer 19 21 27 31 as the main health effect of exposure to secondhand smoke compared with 69% of never-married female youth from Saft El Khamar. Other main health effects of secondhand smoke exposure that the respondents mentioned were heart disease (39% of husbands, 38% of never-married female youth, 37% of never-married male youth, and 36% of women), cancer (31% of never-married male youth, 27% of never-married female youth, 21% of husbands, and 19% of women), and high blood pressure (19% of nevermarried male youth, 16% of husbands, 15% of never-married female youth, and 14% of women). However, the results differ across villages. While 63% of husbands from Koloba reported cancer as one of the health effects of exposure to secondhand smoke, only 8% of husbands from Monshaat El Maghalka mentioned cancer. Perceptions related to the health effects of secondhand smoke exposure (Appendix A Table7.6) Respondents were read a set of Table 7.3 Perceptions Related to the Health Effects of statements about the health effects of Exposure to Secondhand Smoke exposure to secondhand smoke. Never-married Almost all respondents agree that Likelihood that secondhand secondhand smoke may cause Female Male smokers will get Women Husbands youth youth respiratory problems (98% of neverHeart Disease 91 83 91 77 married male youth, 97% of neverRespiratory problems 96 95 97 98 married female youth, 96% of High blood pressure 82 79 84 83 women, and 95% of husbands). Cancer 79 76 84 83 Women and never-married female Low birth weight among youth were more likely than husbands 63 57 63 48 pregnant women Low growth rate among and never-married male youth to infants and children 55 52 55 45 agree that secondhand smokers will develop heart disease (91%, 91%, 83%, and 79% respectively), with differentials between regions. Ninety six percent of husbands from Zohra mentioned that secondhand smokers are likely to develop heart disease, compared with 67% of husbands from Koloba. When respondents were read the statement that secondhand smokers will likely acquire high blood pressure, around 8 in 10 respondents were in agreement. Differentials were clear across villages. Ninety four percent of women in Monshaat El Maghalka mentioned that secondhand smokers are likely to develop high blood pressure compared with 67% of women in Saft El Khamar. Almost the same pattern was found when respondents were read a statement about the likelihood that secondhand smokers will get cancer. Respondents were less likely to mention that pregnant women exposed to secondhand smoke are likely to have low birth weight babies (63% of women and never-married female youth, 57% of husbands, and 48% of never-married male youth). Marked differentials were observed across villages. Seventy four percent of never-married male youth in Zohra mentioned this health effect of secondhand smoke compared with only 20% of never-married male youth in Monshaat El Maghalka. 48
Moreover, respondents were also less likely to mention that secondhand smoke leads to low growth rate among infants and children (55% of women and never-married female youth, 52% of husbands, and 45% of never-married male youth). Clear differences were observed across villages. Three quarter of never-married male youth in Zohra mentioned that secondhand smokers are likely to have low growth rate among infants and children compared with only 16% of never-married male youth in Monshaat El Maghalka. Perceptions about people’s concern about the health effects of exposure to secondhand smoke (Appendix A Table 7.7) To assess their perceptions about the Fig 7.6 Percentage of respondents who believe public’s concern about the health none, very few, some, or most people are effect of exposure to secondhand concerned about the health effects of secondhand 54 smoke, respondents in the different smoke 51 43 target groups were asked to indicate 39 whether most, some, very few, or none 30 25 of the people who are living in their 16 16 15 15 15 14 area are concerned about these effects. 7 7 6 6 More than half of women and nevermarried female youth mentioned that Women Husbands Never-married Never-married none of the people are concerned f emale youth male youth about the health effects of exposure to Most Some Very few Non e secondhand smoke compared with 43% of husbands, and 39% of nevermarried male youth. Around 15% of respondents mentioned that most people are concerned about the health effects of exposure to secondhand smoke. Differentials exist between villages. Women and husbands from Ebshedat and never-married female and male youth from Zohra were more likely to mention that none of the people are concerned about the health effects of exposure to secondhand smoke.
7.4
Attitudes Toward Passive Smoking
Future attitudes toward passive smoking (Appendix A Table 7.8) Respondents were read two statements Fig 7.7 Percentage of respondents who regarding the likelihood that they would report it to be likely that they will stop engage in various smoking-related behaviors. smoking in their or in in the presence of The first statement asked about the likelihood children that the respondents who smoke will stop 43 smoking in the home/in the presence of 32 children and the second statement asked all respondents about the likelihood that they will ask visitors not to smoke at home/in the presence of children. The responses were Husbands Never-married male measured on a 5-point scale ranging from very youth unlikely to very likely. During the analysis stage, the responses were recoded into three categories: likely, unlikely, and somewhat likely. First, smokers were asked about the likelihood that they will stop smoking in their home or in the presence of children. Results for the first staement are not presented for females due to the small number of female smokers in the sample. Results show that never-married male youth were more likely than husbands to intend to stop smoking in their home/in the presence of children (43% and 32%, respectively). Differentials were observed across villages. Ninety five percent of never-married male youth from Koloba mentioned that they are likely to stop smoking in their home/in the presence of children compared with 16% of never-married male youth in Toukh El khail. Moreover, 63% of husabnds from Saft El Khamar reported that are likely to stop smoking in their home/in the presence of children compared with 49
23% of husbands in Nazlet Hussein Ali. When respondents were asked about the likelihood that they will ask visitors not to smoke in their home or in the presence of children, only 33% of never-married male youth, 23% of husbands, and 18% of women and never-married female youth reported that they are likely to do so. Never-married male youth and husbands from Koloba and women and nevermarried female youth from Saft El Khamar were the most likely to report that they will ask visitors not to smoke in their home or in the presence of children (83%, 51%, 45%, 35%, respectively).
Fig 7.8 Percentage who are likely to ask visitors not to smoke in your home/in the presence of children, by group 33 23 18
Wo men
18
H usbands
N evermarried f emale yo uth
N evermarried male yo ut h
Attitudes toward the created nonsmoking area (Appendix A Table 7.9) Respondents were asked if they currently have a nonsmoking area at home. Results show that few respondents have a nonsmoking area in their home (22% of husbands, 21% of never-married female youth, 20% of women, and 16% of nevermarried male youth). Results varied across region. Respondents in Toukh El Khail (except never-married male youth) were the least likely to indicate the presence of a nonsmoking area in their home.
Fig 7.9 Percentage of respondents that have a nonsmoking area at home 22 20
21 16
Women
Husbands
Never-married
Never-married
Respondents who indicated that they have f emale youth male youth a nonsmoking area in their home were asked how various people reacted to its creation. Ninety percent or more of women and husbands reported that their spouse and children were supportive. On the other hand almost all nevermarried female youth and all nevermarried male youth mentioned that Table 7.4 Percentage of Respondents Believing that Various their mothers were supportive. Persons Supported Creating the Nonsmoking Area Never-married Additionally, more than 8 out 10 of Female Male never-married female and male youth Women Husbands youth youth reported that their fathers were 92 100 N/A N/A reactive. Three quarters of never- Spouse’s reaction 90 96 N/A N/A married female youth mentioend that Children’s reaction Other family members’ their friend’s reaction were supportive reaction 78 81 86 78 compared with 61% of never-married Friends’ reaction 51 49 75 61 male youth, and around half women Husband’s friends’ reaction 25 N/A N/A N/A N/A N/A 96 100 and husabnds. Aproximately 8 out 10 Mother’s reaction N/A N/A 83 84 of repsondents with nonsmoking areas Father’s reaction mentioned that other family members were supportive.
50
Attitudes toward creating a nonsmoking area in the future (Appendix A Table 7.10) Respondents who indicated that they do not have a nonsmoking area in their home were asked about the likelihood that they will create a nonsmoking area in the future. In addition, those respondents were asked to predict the reaction of their friends and family to the creation of such an area. Results show that among respondents who do not have a nonsmoking area at home, only 49% of never-married male youth, 32% of husbands, 23% of never-married female youth, and 21% of women mentioned that they are likely to create a nonsmoking area at home in the future. Differentials were clear across villages. While women who do not have a nonsmoking area at home from Saft El Khamar mentioned that they are likely to create such an area in the future (59%) most frequently, never-married male youth from the same village mentioned it (16%) the least. Respondents who do not have a nonsmoking area at home were asked about the expected reaction of various persons regarding the creation of such an area in the future. Husbands were more likely to mention that their spouses will be supportive (96% and 42% respectively). Contrarily, 79% of women mentioned that children will be supportive compared with 59% of husbands.
Fig 7.10 Percentage of respondents who intend to have a nonsmoking area at home in the future, by group 49
32 23
21
Wo men
H usbands
N evermarried f emale yo uth
N evermarried male yo ut h
Table 7.5 Percentage of Respondents Believing that Various Persons Would Support Creating a Nonsmoking Area Never-married Female Male Women Husbands youth youth Spouse’s reaction Children’s reaction Other family members’ reaction Friends’ reaction Husband’s friends’ reaction Mother’s reaction Father’s reaction
42 59
96 79
N/A N/A
N/A N/A
44 36 15 N/A N/A
65 39 N/A N/A N/A
56 52 N/A 86 35
70 54 N/A 96 56
Ninety six percent of never-married male youth and 86% of never-married female youth without a nonsmoking area at home reported that they expect their mothers’ reaction to be supportive. When asked about father’s expect reaction, lower percentages of never-married male and female youth reported that they expect the reaction to be supportive (56% and 35% respectively). Never-married male and female youth were more likely than husbands and women to mention that they expect their friends’ reaction to be supportive (54%, 52%, 39%, and 36% respectively). Never-married male youth and husbands were more likely than never-married female youth and women to expect family member’s reaction to be supportive (70%, 65%, 56%, and 44% respectively).
51
LEADERSHIP, HEALTH INFORMATION, AND SUPPORT FOR HEALTH IMPROVEMENT
8
Leadership, health information, and support for health improvement are of importance to the CHL program. Individuals’ behaviors and attitudes in a community can be positively affected through communication with leaders. Questions about perceptions about different leadership characteristics, access to health information, and health family issues were included in the 2005 MVHS. In the following sections, different topics related to the previous issues will be discussed.
8.1
Perceptions about Leadership Characteristics (Appendix A Table 8.1)
The 2005 MVHS survey included questions about specific leadership characteristics. Each respondent was read a series of statements about specific leadership characteristics, and were asked to rate their importance. Responses were coded on a five point scale, where 5 means very important and 1 not important at all. During the data analysis, responses were coded as not important, moderately important, and important. More than 9 out of 10 respondents agreed that it is important for a leader to be concerned about the welfare of others, to be willing to share resources and benefits with others, and to understand local culture; and local community needs. Some differences were observed across villages. All nevermarried male youth from Zohra, Saft El-Khamar, and Toukh El-Khail agreed that it is important for the leader to be willing to share resources and benefits with others compared to approximately three-quarters of never-married male youth from Koloba. Table 8.1 Percentage of Respondents who Perceive Select Leadership Respondents were less likely to agree that the leader’s education is important. Eighty-nine percent of never-married female youth, 88% of never-married male youth, 86% of women, and 85% of husbands mentioned that it is important that the leader is well educated. A similar pattern was found for responses regarding a leader’s ability to appeal to high authorities for support and action.
Characteristics as Important. Never-married Female Male Women Husbands Youth Youth Leader is concerned about the welfare of others Leader is willing to share resources and benefits with others Leader understands the local culture Leader is well educated Leader can appeal for high authorities for support and action Leader can obtain resources from outside the community Leader understands local community needs
97
97
96
94
95 95 86
96 96 85
95 95 89
96 98 88
83
85
84
91
86
89
85
93
93
96
92
98
Husbands and never-married male youth were more likely than women and never-married female youth to mention that it is important that the leader can obtain resources from outside the community (89%, 93%, 86%, and 85% respectively). Some differences were observed across villages. Husbands and never-married male youth from Koloba and women and never-married female youth from Koloba were the less likely to mention that it is important that the leader can obtain resources from outside the community.
8.2
Perceptions about Actual Community Leaders (Appendix A Table 8.2)
Respondents from all groups were asked if there is someone who they consider to be a leader in their community. Results show that small percentages of respondents believed in the presence of an actual leader in their community. However, husbands and never-married male youth were more likely than women and never-married female youth to believe in the presence of an actual leader in the community (27%, 32%, 20%, and 16% respectively). Differentials were observed across 52
Fig 8.1 Percentage who can identify someone they consider to be a leader in their community 32 27 20 16
Women
Husbands
Never-married
Never-married
f emale youth
male youth
villages. Seventy-nine percent of never-married male youth from Saft El-Khamar reported the presence of an actual leader in their community compared with only 8% of never-married male youth from Koloba. Respondents who reported having a community leader were asked to what extent they agreed that this leader exhibited the characteristics mentioned previously. Responses were recorded on a five point scale where 5 means strongly agree and 1 means strongly disagree.
For analysis purposes, responses were recoded into three categories: agree, disagree, and neutral. More than 8 out of 10 women, husbands and never-married female youth agreed that their leader is concerned about the welfare of others, compared with almost all never-married male youth. All respondents from Koloba agreed with this issue. On the other hand, respondents from Nazlet Hussein Ali reported the lowest percentage of agreement.
Fig 8.3 Percentage who believe their communitiy leader is willing to share resoureces and benefits with others, by group 91
83
Wo men
78
H usbands
86
N evermarried f emale yo ut h
N evermarried male yo uth
All never-married male youth and more than 9 out of 10 women, husbands, and nevermarried female youth who report the presence of a community leader believed that their leader understands the local culture. Some differentials were observed across villages. All women from Zohra believed that their leader understands the local culture compared with 68% of women from Nazlet Hussein Ali.
Fig 8.2 Percentage who believe their community leader is concerned about the welfare of others 99
87
87
86
Wo men
H usbands
N evermarried f emale yo uth
N evermarried male yo ut h
Among those respondents reporting the presence of a community leader, 91% of nevermarried male youth, 86% of never-married female youth, 83% of women, and 78% of husbands believed that their leader is willing to share resources and benefits with others. It is worth mentioning that all husbands and women from Zohra, all never-married female youth from Monshaat Al-Maghalka, and all nevermarried male youth from Monshaat AlMaghalka and Koloba believed that their leader shared resources and benefits with others. Fig 8.4 Percentage Believing Their Community Leader Understands Local Culture 91
Wo men
95
94
100
H usbands
N ever-
N ever-
married married Respondents were also asked whether they f emale male yo uth believed that their community leader is well yo ut h educated. Low percentages of respondents who reported the presence of a community leader indicated that this leader is well educated (76% of never-married male youth, 60% of husbands, 55% of women, and 53% of never-married female youth).
53
Fig 8.5 Percentage who believe their community leader is well educated, by group 76 55
Wo men
60
H usbands
53
N evermarried f emale yo ut h
N evermarried male yo uth
female youth to believe that their leader can appeal to higher authorities for support and action (62%, 85%, 47%, and 58% respectively). The percentages who believe the leader can identify and obtain resources from outside the community and who believe that the leader understands local community needs are similar. It is worth mentioning that all never-married female and male youth from Zohra, Koloba, and Ebshedat believed that their community leader understands local community needs. Moreover, all husbands from Zohra and Koloba believed so.
8.3
Differentials were clear across villages. Women, husbands, and never-married female youth from Zohra were most likely to mention that their community leader is well educated while those from Toukh El-Khail were least likely to mention that their community leader is well educated. All never-married male youth from Koloba believed that their leader is well educated. Husbands and never-married male youth were more likely than women and never-married Fig 8.6 Percentage who believe their community leader can appeal to higher authorities for support and action, by group
85
62
58
H usbands
N evermarried female yo ut h
47
Wo men
N evermarried male yo ut h
Access to Health Information (Appendix A Table 8.3)
To assess their knowledge regarding access to health information, respondents were asked if they have enough information about health topics. Results show that relatively small percentages have enough information about health topics (52% of husbands, 49% of women and never-married female youth, and 45% of women). Clear differentials were observed across villages. Seventy seven percent of husbands from Ebshedat have enough information about health topics compared with 22% of husbands from Monshaat El Maghalka. A similar pattern was found among women and never-married female youth.
Fig 8.7 Percentage reporting that they have enough information about health topics 52 45
Women
Husbands
49
49
Never-married Never-married female youth
male youth
Respondents were also asked to estimate how confident they were that they could obtain information about various health topics. Responses were recoded into three categories: not confident, neutral, and confident. Nine-three percent of women, 87% of husbands and nevermarried male youth, and 86% of never-married female youth were confident that they can obtain information about use of family planning methods, with some differentials across villages. All never-married female youth from Nazlet Hussein Ali were confident that they can obtain information about use of family planning methods compared with 78% of never-married female youth from Monshaat El Maghalka. Less than 9 out of 10 respondents were confident that they can obtain information about keeping children healthy (87% of husbands, never-married female and male youth and 84% of women). Differentials were observed across villages. All women from Nazlet Hussein Ali reported that they are confident in their ability to obtain such information compared with almost three quarters of
54
women from Toukh El Khail. Around 7 out of 10 respondents were confident that they could obtain information about preventing unsafe injections. Respondents from Koloba were the most likely to report that they are confident that they can obtain such information.
Table 8.2 Percentage of Respondents who Are Confident that they Can Obtain Information about Various Health Topics Never-married Female Male Women Husbands Youth Youth Use of FP methods Keeping children healthy Preventing unsafe injection Healthy diet for the whole family Dangers of smoking and how to stop smoking How HIV/AIDS can be prevented Safe pregnancy and delivery
83 87 71
87 87 70
86 84 70
87 87 73
Never-married male youth and 78 82 77 89 husbands were more likely than women and never-married female 68 84 67 88 youth to report that they are confident 42 54 48 64 that they can obtain information about a healthy diet for the whole family 86 78 79 68 (89%, 82%, 78%, and 77% respectively) with differentials across villages. Ninety-three percent of women from Koloba reported that they are confident in their ability to obtain such information compared with 55% of women from Monshaat El Maghalka. Moreover, never-married male youth and husbands were also more likely than women and nevermarried female youth to report that they are confident that they can obtain information about the dangers of smoking and how to stop smoking (88%, 84%, 68%, and 67% respectively). Again, respondents from Koloba were the most likely to report that they are confident that they can obtain such information. Relatively low percentages of respondents reported that they are confident that they could obtain information about how HIV/AIDS can be prevented (64% of never-married male youth, 54% of husbands, 48% of never-married female youth, and 48% of women). Koloba respondents were more likely to report that they are confident that they can obtain such information. Women were more likely to report that they are confident that they could obtain information about safe pregnancy and delivery (86%) than never-married female youth, husbands, and never-married male youth (79%, 78%, and 68% respectively). It has to be mentioned that almost all nevermarried male youth from Saft El Khamar reported that they are confident that they could obtain such information.
8.4
Attitudes related to Maternal and Child Health (Appendix A Table 8.4)
The 2005 MVHS questionnaire asked respondents about the level of responsibility that the mother, father, whole family, health provider, and whole community have for ensuring a safe delivery for mother and child. Responses were coded as high responsibility, low responsibility, and not responsible at all.
Table 8.3 Percentage of respondents believing that various people/groups have high responsibility in matters related to Maternal and Child Health Never-married Female Male Women Husbands Youth Youth Mother has high responsibility Father has high resp. Whole family has high resp. Health provider has high resp. Whole community has high resp
99 94 77 92 54
99 96 84 94 61
98 93 81 92 58
98 97 89 96 75
There is almost universal agreement among all respondents that the mother is highly responsible for maternal and child health. Moreover, high percentages of respondents mentioned that the father is highly responsible as well (97% of never-married male youth, 96% of husbands, 94% of women, 93% of never-married female youth). Minor differences were observed between villages.
55
Relatively low percentages of respondents reported that the whole family is highly responsible for ensuring maternal and child health (89% of never-married male youth, 84% of husbands, 81% of never-married female youth, and 77% of women). Slight differentials were observed across villages. While 97% of never-married male youth from Toukh El Khail mentioned that the whole family is highly responsible for ensuring maternal and child health, only 58% of never-married male youth from Nazlet Hussein Ali reported the same opinion. More than 9 out of 10 respondents reported that the health provider is highly responsible for maternal and child health. On the other hand, lower percentages of respondents reported that the whole community is highly responsible (75% of never-married male youth, 61% of husbands, 58% of never-married female youth, and 54% of women). Differentials were observed across villages. Slightly more than three-quarters of women from Monshaat Al Maghalka reported that the whole community is highly responsible for maternal and child health compared with 32% of women from Koloba.
8.5
Attitudes related to Maternal Health (Appendix A Table 8.5)
All respondents were asked what they would do if a 6 month-pregnant woman in their family became ill. Multiple responses were permitted. Results show that around 8 out 10 respondents reported that they would consult a health service provider in such a case with differentials across villages. Ninety six percent of nevermarried male youth from Saft El Khamar reported that they would consult a health service provider compared with 31% of never-married male youth from Zohra.
Table 8.4 Beliefs About What Should Be Done If a 6-MonthPregnant Woman Becomes Ill Never-married Percentage Believing One Should:
Female Male Women Husbands Youth Youth
Do nothing; wait for her to get better Talk with the husband Talk with a relative Talk with a friend or neighbor Consult a health service provider Consult a pharmacist
8 5 1 1
10 10 2 2
4 4 3 2
9 3 1 1
81 2
78 2
78 2
78 11
Husbands and never-married male youth were more likely than women and never-married female youth to indicate that they would do nothing and wait for woman to get better (10%, 9%, 8%, and 4% respectively). Other reactions were mentioned by low percentages of respondents.
8.6
Willingness to Participate in Family Health Improvement Activities (Appendix A Table 8.6)
The 2005 MVHS also explored respondents’ willingness to participate in activities aimed at improving family health in their village. Overall, data showed that never-married male and female youth are more willing than husbands and women to participate in activities to improve family health in the village (46%, 41%, 32%, and 30% respectively). Striking variations were observed across villages. Eighty two percent of never-married male youth from Saft El Khamar reported that they are willing to participate in such activities compared with only 5% of never-married male youth from Koloba.
56
Fig 8.9 Percentage willing to participate in activities to improve family health in the village 41 30
32
Women
Husbands
46
Never-married Never-married f emale youth
male youth
Those respondents who Table 8.5 Willingness to Participate in Specific Family Health reported that they would be Improvement Activities (among those willing to participate) willing to participate in Never-married activities to improve family Percentage willing to perform Female Male health in their community were various roles in those activities Women Husbands Youth Youth asked which role they would be willing to perform for each of Attend meeting 98 98 98 98 Speak out in meetings 89 96 90 98 those activities. Almost all Help to assess community needs 81 94 88 98 respondents reported that they Help to plan activities 63 87 79 94 would attend meetings. Help implement the activities 59 82 74 94 Husbands and never-married Willing to be leader for activities 47 65 56 70 male youth were more willing Provide resources for activities 55 75 68 79 than women and never-married female youth to speak out in meetings. A similar pattern was found with the rest of the activities.
8.7
Perceptions about Families’ Ability to Avoid or Solve Health Problems (Appendix A Table 8.7)
The MVHS questionnaire also Table 8.6 Perceptions about Family Health Problems investigates respondents’ perceptions about family Never-married health problems. Respondents Female Male were presented with a number Percentage who agree that Women Husbands Youth Youth of scenarios and were asked Family health problems are too to indicate their level of complex for the family to agreement with the statement overcome by itself 69 68 66 68 Family is able to protect the health (disagree, neutral, agree). of its members 78 79 79 85 Around three quarters of Family has the resources it needs to respondents agree that family protect the health of its members 68 68 69 75 health problems are too People in the family are aware of complex for the family to 69 70 71 73 the most important health problems overcome by itself. Differentials were observed across villages. Almost all never-married male youth from Monshaat El Maghalka agreed with this issue compared with only 15% of never-married male youth from Zohra. Never-married male youth were more likely than husbands, never-married female youth and women to agree that the family is able to protect the health of its members (85%, 79%, 79%, and 78% respectively). Differentials were clear across villages. Ninety-seven percent of never-married male youth from Zohra agreed with this issue compared with 36% of never-married male youth from Saft El Khamar. Almost the same pattern is observed for the statement that the family has the resources to protect the health of its members. Around 7 out of 10 respondents agreed that people in the family are aware of the most important health problems.
8.8
Perceptions about Community Health Problems (Appendix A Table 8.8)
The MVHS questionnaire collected information on the respondents’ perceptions of community health problems. Respondents were presented with a number of scenarios and were asked about their level of agreement with various statements related to community health problems. As before, the responses were recoded into three categories: agree, disagree, and neutral. Never-married male youth and husbands were more likely than never-married female youth and women to agree that families should talk together about how to achieve and maintain good health (94%, 88%, 85%, and 82% respectively). Respondents from Koloba were the most likely to agree with this statement. A similar pattern was observed regarding perceptions about whether it is better for families to prevent health problems before they occur than to cure heath problems after they happen. 57
Lower percentages of Table 8.7 Perceptions about Community Health Problems respondents agreed that the village is able to solve the Never-married health problems it faces (56% Female Male of never-married male youth, Percentage who agree that Women Husbands Youth Youth 49% of women, 44% of Families should talk together about husbands, and 43% of neverhow to achieve and maintain good married female youth). health 82 88 85 94 It is better for families to prevent Differentials were clear health problems before they occur than across villages. Slightly more to cure heath problems after they than two-thirds of neverhappen 85 89 86 95 married female youth from Village is able to solve health problems it faces 49 44 43 56 Monshaat El Maghalka Village has resources it needs to solve agreed with this statement its health problems 40 38 38 50 compared with only 14% of Village factions make it difficult to never-married female youth work together 39 42 37 39 from Zohra. Almost the same People in the village are aware of most important health problems 43 42 42 51 pattern was observed regarding the statement that the village has the resources it needs to solve its health problems. Around 4 out of 10 respondents agreed that village factions make it difficult to work together. Respondents from Nazlet Hussein Ali and never-married male youth from Toukh El Khail were the most likely to agree with this issue. Around half of never-married male youth and slightly more than 4 out of 10 husbands, women, and never-married female youth agreed that people in their community are aware of the most important health problems. Striking differences were clear among villages. Eighty-seven percent of never-married male youth from Zohra agreed with this issue compared with only 11% of nevermarried male youth from Monshaat El Maghalka.
58
FEMALE CIRCUMCISION
9
Female circumcision is a widespread practice in Egypt. The 2005 MVHS questionnaire included several questions about knowledge, prevalence, attitudes, and practices related to female circumcision. Moreover, never-married female and male youth were asked about their intention to circumcise their daughters in the future.
9.1
Knowledge of Female Circumcision (Appendix A Table 9.1)
To assess knowledge about female circumcision, respondents were asked whether they had heard about the practice. Knowledge of female circumcision was found to be universal among the respondents, as 100% of all target groups indicated that they had heard about the practice.
9.2
Prevalence of Female Circumcision and Intention to Circumcise Daughters (Appendix A Table 9.2)
Women and never-married female youth were asked whether they had been circumcised. Additionally, never-married female and male youth were asked about their intention to circumcise their daughters in the future. Moreover, women and husbands were asked if they intend to circumcise other daughters in the future.
Fig 9.1 Percentage of married women and female youth who are circumcised 93
83
Overall, 93% of women and 83% of the neverWo men N ever- married f emale married female youth reported that they had been yo ut h circumcised. Toukh El Khail village reported the lowest prevalence of female circumcision (60% of women and only 8% of never-married female youth). On the other hand, over 98% of women and female youth in Koloba village reported that they had been circumcised. Approximately 4 in 10 husbands and women who have daughters reported that they have at least one circumcised daughter. The highest percentages were found in Koloba village (54% of husbands and 50% of women), while the lowest percentages were found in Toukh El Khail village (8% for both).
Fig 9.2 Percentage who say that they intend to have their daughters circumcised, by group 78
39
43
49
Regarding future intention to have any Wo men H usbands N everN evermarried married male daughter circumcised, differentials were f emale yo ut h yo ut h found among groups of respondents and across villages. Overall, 78% of never-married male youth intend to have daughters circumcised compared to 49% of never-married female youth, 43% of husbands, and 39% of women. Across villages clear variations were observed. Fifty nine percent of husbands from Nazlet Hussein Ali intend to have other daughters circumcised compared with 19% of husbands from Toukh El Khail village.
9.3
Support for Female Circumcision (Appendix A Table 9.3)
Respondents were asked whether they support or oppose female circumcision to assess their attitudes about the practice. Around three quarters of women, husbands, and never-married male youth indicated that the
59
practice should be continued, while slightly less than half of the never-married female youth reported that the practice should be continued. The highest percentage of support of female circumcision was found in Koloba village (91% of women, 95% of husbands, 68% of nevermarried female youth, and 94% percent of nevermarried male youth). The lowest percentage of support was found in Toukh Al Khail (except for never-married male youth).
Fig 9.3 Percentage that supports female circumcision, by group 72
77
75 48
Wo men
H usbands
N evermarried f emale yo ut h
N evermarried male yo ut h
Respondents who indicated that female circumcision should be continued were asked to list the reasons behind their opinion (multiple reasons could be mentioned). Sixty one percent and 47% of women who supported female circumcision indicated that the practice should be continued because it is a good tradition and required by religion respectively. The most common reasons indicated by husbands were that the practice Table 9.1 Percentage Indicating Citing Specific is required by religion (67%) and that it is a Reasons Female Circumcision Should Be Continued good tradition (61%). Fifty three percent of Never-married never-married female youth and 65% of never-married male youth indicated that the Female Male practice is a good tradition. Female Reasons Women Husbands youth youth circumcision as a religious requirement was Good tradition 61 61 53 51 sited by 53% and 51% of never-married Required by religion 47 67 49 65 Cleanliness 34 29 25 15 female and male youth respectively. Respondents who indicated that female circumcision should be discontinued were also Table 9.2 Percentage Indicating Select Reasons asked about the reasons for their beliefs. Why Female Circumcision Should Be Multiple responses were also permitted; Discontinued accordingly, percentages do not add to 100%. Never-married The most common reason provided by women, and never-married female and male Female Male Reasons Women Husbands youth youth youth who disapprove of the practice is that it causes many medical complications (52%, Bad tradition 44 45 54 41 Against religion 49 63 52 46 62% and 52%, respectively), while the most Medical common reason mentioned by husbands is that 52 46 62 52 complications it is against religion (63%). Bad tradition was mentioned by high percentages of respondents (54% of never-married female youth, 45% of husbands, 44% of women, and 41% of never-married male youth.
9.4
Perceptions about Female Circumcision (Appendix A Table 9.4)
To assess respondents’ perceptions about female circumcision, interviewers read a series of statements about female circumcision and asked respondents to indicate whether they agreed or disagreed with them. When asked whether circumcision is an important part of religious tradition, 77% of never-married male youth, 75% of husbands, 69% of women and 49% of never-married female youth agreed with the statement. Women and never-married female youth from Monshaat El Maghalka and husbands and never-married male youth from Koloba
60
Fig 9.4 Percentage who say that circumcision is an important part of religious tradition, by group 69
77
75 49
Wo men
H usbands
N evermarried f emale yo uth
N evermarried male yo uth
reported the highest percentages in comparision to other villages. When respondents were asked whether husbands prefer that their wives be circumcised, 74% of husbands, 68% of women, 64% of never-married male youth, and 35% of never-married female youth agreed with the statement. There were clear differences among villages. Ninety eight percent of never-married male youth from Koloba village agreed that husbands prefer their wives to be circumcised compared with only 16% of never-married male youth from Zohra village.
Fig 9.5 Percentage who believe that a husband prefers his wife to be cimcumcised, by group 68
74
64 35
Wo men
H usbands
N evermarried f emale yo uth
N evermarried male yo uth
Low percentages of respondents agreed with the statement (31% of never-married female youth, 22% of women, 18% of husbands, and 16% of never-married female youth) that circumcision can cause severe complications that may lead to the girl’s death, Among women, husbands, and never-married female youth, those in Toukh El Khail village were most likely to agree (45%, 39%, and 61%, respectively). However, among nevermarried male youth, those living in Ebshedat were most likely to agree that female circumcision can cause complications (36%). Respondents were asked about their opinion whether circumcision prevents adultery. Fifty nine percent of husbands, 58% of never-married male youth, 51% of women and 24% of nevermarried female youth agreed with the statement. The women, husbands, and never-married female youth living in Nazlet Hussein Ali village were most likely to agree that female circumcision prevents adultery (75%, 85%, and 35% respectively). However, among never-married male youth, those living in Koloba were most likely to agree with this statement (94%).
Fig 9.6 Percentage who believe that circumcision prevents adultery, by group 51
58
59
24
Wo men
H usbands
N evermarried f emale yo uth
N evermarried male yo ut h
Low percentages of respondents agreed that circumcision may cause a woman to have problems becoming pregnant (13% of never-married female youth, 10% of women, 6% of husbands, and 5% of never-married male youth). Respondents in Saft El Khamar reported the highest level of agreement with the statement (32% of never-married female youth, 21% of women, 18% of nevermarried male youth, and 16% of husbands). When asked whether female circumcision reduces sexual satisfaction for a couple, only 17% of women, 28% of husbands, 24% of nevermarried female youth, and 32% of never-married male youth believed this to be true. Among husbands and never-married male youth, those living in Koloba village were most likely to believe that female circumcision reduces sexual satisfaction (60% and 88%, respectively). Women and never-married female youth in Zohra were most likely to express this concern (44% and 29%, respectively).
Fig 9.7 Percentage who believe that circumcision lessens sexual satisfaction for a couple, by group 32
28 24 17
Women
Husbands
Never-married
Never-married
female youth
male youth
When respondents were also asked whether childbirth is more difficult for a woman who has been circumcised low percentages were reported (9% of never-married female youth, 8% of women, 6% of husbands, and 5% of never-married male youth). The women, husbands, and never-married
61
female youth living in Saft El Khamar village were more likely to agree that female circumcision makes childbirth more difficult (17%, 12% and 23%, respectively). Among never-married male youth, those in Monshaat El Maghalka were most likely to agree that it could make childbirth more difficult (13%).
62
RECALL OF MESSAGES FROM INFORMATION, EDUCATION, AND COMMUNICATION CAMPAIGNS 10 Communication interventions play a vital role in disseminating health education messages through mass media and interpersonal communication, increasing awareness, and stimulating behavior change. This chapter examines recall of recent messages from various sources of information about family planning, birth spacing, pre- and postnatal care, healthy lifestyles (smoking cessation), HIV/AIDS, safe injection practices, and female circumcision.
10.1
Communication about Family Planning
Family planning messages (Appendix A Table 10.1) The 2005 MVHS included questions about recall of recent messages about family planning. The data show that recall is higher among ever-married women and never-married female youth (71% and 66%), compared to husbands and never-married male youth (54% and 56%).
Fig 10.1 Percentage who recall seeing or hearing family planning messages, by group 71 66
56
54
The level of recall varies by village. Differences are fairly large with recall of messages in the control Wo men H usbands villages (Toukh El Khail and Ebshedat) being much lower than recall in the intervention villages. For example, 87% of ever-married women in Monshaat EL Maghalka heard/saw family planning information during the last 6 months compared with only 54% of women in Toukh El Khail.
N evermarried female yo ut h
N evermarried male yo ut h
Among those able to recall family planning messages, television is by far the most important source of information, followed by radio. Billboards and posters are less important sources of family planning information. For example, among ever-married women, television is the dominant source of information (96%), followed by radio 29%, posters (15%) and billboards (11%). Community meetings were reported as a source of information by only 3% of women, but meetings were a more common source for women in intervention than in control villages. Among husbands who recently received information about family planning, the main sources are television (95%), radio (27%), posters (8%) and billboards (6%). Never-married females reported television and radio as their main sources but were more likely to recall information from billboards than from posters. Never-married males also identified television, radio, and billboards as important sources of information (96%, 15%, and 6%, respectively). However, only 3% of never-married males reported that they receive their information from posters. Messages about family planning after the first birth (Appendix A Table 10.2) The 2005 MVHS investigated recall of messages about the use of family planning methods after the birth of the first child; 30% of ever-married women and 32% of never-married female youth were able to recall messages about this topic compared to 18% for husbands and 15% for never- married male youth.
Fig 10.2 Percentage who recall messages about family planning after the first birth, by group 32
30 18
Wo men
H usbands
15
N ever married f emale yo ut h
N ever married male yo ut h
Differences are clear between villages, for example about half of women in Zohra recalled such messages compared with only 15% in Monshaat El Maghalka. Recall is consistently below
63
average in Monshaat El Maghalka for all groups. Among those who could recall recent messages about the use of family planning methods after the birth of the first child, television is the main source of information. Between 88% and 92% of respondents in each of the four target groups reported that they received their information from television. Fourteen percent of women reported receiving information from medical providers. However, medical providers are listed by fewer than 6% of the other target groups. Only about 1 in 10 respondents reported other relatives or friends or neighbors as their source of information. Level of comfort discussing family planning (Appendix A Table 10.3) It is well-known that interpersonal communications can be an important source of information about family planning. In the 2005 MVHS, respondents were asked if they felt comfortable talking about family planning methods with other people. The results show that the majority of respondents feel comfortable discussing family planning. Only 6% of ever-married women and 7% of husbands reported that they do not feel comfortable discussing family planning with anyone. Even among never- married males, only 8% reported not feeling comfortable discussing family planning with others. However, about 1 in 5 never-married female youth (17%) do not feel comfortable discussing the topic. The highest percentages of never-married males who feel uncomfortable discussing family planning are in Monshaat El Maghalka (27%), Toukh El Khail (23%), and Nazlet Hussein Ali (18%). As shown in Table 10.2, the majority of Table 10.2 Percentage of Respondents Who Communicated married women feel comfortable with Others About Use of Family Planning Methods discussing family planning with service Never-married providers (58%) or their husband (45%). On the other hand, while the Female Male Women Husbands Youth Youth majority of husbands feel comfortable talking about family planning with their Spouse 45 78 wives (78%), only 41% feel Parents/parents-in-law 18 5 49 36 comfortable discussing the topic with a Other relatives 19 6 8 8 service provider. About half of neverService provider 58 41 36 48 married females (49%) and one-third of Friends/neighbors 17 5 18 19 never-married males (36%) reported No one 6 7 17 8 feeling comfortable discussing family planning with their parents. On the other hand, 48% of never-married males reported feeling comfortable discussing family planning with the service provider, compared to only 36% of never-married females. The percentage who feels comfortable discussing family planning methods with friends and neighbors and other relatives is very low, especially among husbands. The results show that levels of comfort discussing family planning with other people vary considerably from one village to another. For instance, while overall 58% of ever-married women reported feeling comfortable discussing family planning with a service provider, this percentage varies from 30% in Saft Al Khamar to 78% in Monshaat Al Maghalka. Table 10.3 Percentage of Respondents by Interpersonal communication about family planning (Appendix A Tables 10.4-10.5)
Frequency of Discussion with their Spouse about Family Planning Women Husbands
The 2005 MVHS also collected information about the frequency of spousal communication regarding Never 74 70 family planning during the 6 months prior to the Once or twice 18 22 survey. About 74% of ever-married women More often 7 8 reported not having discussed family planning with their husbands during the past 6 months, 18% reported having discussed it once or twice, and
64
only 7% discussed it more often. Similar results were obtained for husbands (70%, 22%, and 8%, respectively). The results differ greatly between villages. Toukh El Khail and Monshaat Al Maghalka have the lowest levels of spousal communication about family planning in the 6 months prior to the survey. On the other hand, respondents from Nazlet Hussein Ali and Zohra reported the highest levels of spousal communications about family planning during the 6 months preceding the survey. The level of contact with family planning workers was also investigated in the 2005 MVHS. Among currently married women who were nonusers of family planning, 43% reported having visited a public health facility and 25% visited a private health facility in the 6 months prior to the survey. About 56% of married women who were nonusers had some contact with a family planning worker at a health facility. The percentages of husbands who did so are much lower than the married women (23%, 15%, and 32%, respectively).
10.2
Communication about Birth Spacing
Messages about optimal birth spacing (Appendix A Table A10.6) Respondents were asked if they had received Fig 10.3 Percentage who recall optimal information about optimal birth spacing during birth spacing messages, by group the 6 months preceding the survey. About 30% 30 of ever-married women and 26% of never26 24 married female youth said they had seen or 19 heard such messages or information. Male respondents reported lower levels of recall. Only 19% of husbands and 24% of nevermarried male youth reported receiving Wo men H usbands N everN everinformation on optimal birth spacing. As with married married communication about family planning, the f emale male yo ut h yo ut h levels of recall vary considerably across villages. For example, the percentage of evermarried women receiving information about optimal birth spacing varies from 15% in Monshaat Al Maghalka to 46% in Zohra. Almost the same pattern was observed for husbands. As was the case for messages about family planning, television is the main source of information about optimal birth spacing. About 9 out of every 10 persons receiving such information reported television as their primary information source. Thirteen percent of ever-married women mentioned medical providers and 10% of never-married females reported friends/neighbors as their main source of information. Interpersonal communication about optimal birth spacing (Appendix A Table 10.7) The 2005 MVHS questionnaire collected information about whether the respondents discussed optimal birth spacing during the 6 months preceding the survey with other people. Nearly one-fifth of ever- married women (22%) and 13% of husbands reported that they recently have Fig 10.4 Percentage who report discussing optimal birth spacing with discussed optimal birth spacing with other others, by group people. As expected, discussion of optimal birth 22 spacing among the never-married youth is 13 13 considerably lower at 13% for never-married females and 0% of never-married males. Among ever-married women who recently discussed optimal birth spacing, 40% have done so with friends or neighbors, 33% with their husbands, and 27% with other relatives. Husbands who have discussed the same subject
0 Wo men
H usbands
N evermarried f emale yo ut h
N evermarried male yo uth
65
did so predominantly with their wives (74%) and less so with friends or neighbors (22%). Nevermarried female youth who have discussed optimal birth spacing did so predominantly with friends or neighbors (52%), and to a lesser extent with parents or other relatives. On the other hand, the majority of never-married males who discussed optimal birth spacing did so with their parents (48%).
10.3
Communication about Pre- and Postnatal Care
Messages about pre- and postnatal care (Appendix A Tables 10.8-10.9) The 2005 MVHS asked respondents if they received information about safe pregnancy during the 6 months preceding the survey. Overall, 18% of ever-married women and 17% of never-married female youth were able to recall messages about these topics. Recall of such information is much lower among males, husbands, and youth, Fig 10.5 Percentage who recall safe with 10% of husbands and 4% of neverpregnancy messages, by group married male youth able to recall seeing or 18 17 hearing such information during the previous 6 months. However, recall of safe pregnancy 10 information varies considerably across 4 villages. For example, recall among the evermarried women in Zohra is 40%, while it is Wo men H usbands N everN everless than 6% among those in some other married married male villages. f emale yo ut h yo uth Most ever-married women and husbands who recall information about safe pregnancy reported television as their most recent source of information (59% and 66%, respectively). (2) About 30% of ever-married women and 23% of husbands reported that the last information they received about safe pregnancy was obtained from medical providers. In order to increase the level of Table 10.4 Exposure to Postnatal/Neonatal Medical postnatal care, CHL communication Consultation Messages activities recommend that mothers Never-married should have postpartum and neonatal consultations within 1 Female Male week after the delivery. At the time Women Husbands Youth Youth of the survey, recall of these Percentage exposed to messages was still fairly low. The postnatal/neonatal 13 8 15 6 consultation messages results show that only 13% of everPercentage who received married women and 15% of neverthis information from: married female youth reported T.V. 72 80 85 89 receiving information about Medical provider 20 14 10 3 postpartum/ neonatal consultations. Among husbands and nevermarried males, this was the case for 8% and 6%, respectively. Again, the levels of recall vary considerably across villages. For instance, 34% of never-married women in Zohra could recall postpartum and neonatal medical consultation messages during the six months preceding the survey, while only 4% from Toukh El Khail recalled such messages. Almost the same level of recall is observed among husbands in those villages. The majority of the respondents from the four target groups who were able to recall information about the recommended consultations reported that they received their information from television (72% for women, 80% for husbands, 85% for female youth, and 89% for male youth). The second 2
Note that unlike the questions about exposure to communication activities about family planning, this question only asks about the last source of information about safe pregnancy (of those who were exposed to such information in the past 6 months).
66
most common source of information reported by all the respondents, except for male youth, was medical providers. For male youth, the second most important source of information was other relatives (18%). Level of comfort discussing pre- and postnatal care (Appendix A Tables 10.10-10.11) The 2005 MVHS investigated whether respondents feel comfortable talking about safe pregnancy and delivery with other people. The data obtained show that there is a high level of comfort discussing this topic with other people for all respondents. The percentage of respondents who reported that they would not feel comfortable discussing this subject with anyone ranges from 9% among ever-married women to 16% among never-married female youth.
Table 10.5 Level of Comfort Discussing Safe Pregnancy and Delivery Never-married Female Male Women Husbands Youth Youth Percentage who feel comfortable discussing these subjects with their: Spouse Parents/parents-in-law Service provider Friends/neighbors Brothers/sisters No one
31 15 56 11 9
61 6 43 3 9
42 36 12 18 16
23 60 7 13 12
Married women are most likely to feel comfortable discussing safe pregnancy and delivery with the service providers (56%) and with their husbands (31%). Husbands on the other hand feel comfortable discussing safe pregnancy with their wives (61%) and with the service providers (43%). Never-married females are most likely to feel comfortable discussing safe pregnancy with their parents (42%), service providers (36%), and siblings (18%). On the other hand, never-married males are most likely to feel comfortable discussing this topic with service providers (60%), parents (23%), and siblings (12%). The percentage of respondents who feel Table 10.6 Level of Comfort Discussing How to Keep comfortable discussing how to keep Babies Healthy babies healthy ranges from 85% among never-married females to 92% among Never-married husbands. Forty two percent of all Female Male married women feel comfortable Women Husbands Youth Youth discussing this subject with the service Percentage who feel providers, while 37% of them would comfortable feel comfortable discussing it with their discussing this subject with their: husbands, 18% with other relatives, and Spouse 37 68 16% with parents or parents-in-law. On Parents/parents-in-law 16 10 45 39 the other hand, most husbands feel Other relatives 18 9 7 7 comfortable discussing how to keep Service providers 42 31 31 45 Friends/neighbors 16 7 14 11 babies healthy with their spouse (86% ), Brothers/sisters 24 20 and about one third (31%) feel No one 9 8 15 7 comfortable doing so with service providers. Never-married female youth feel most comfortable discussing this subject with their parents (45%), service providers (31%), and siblings (24%). For never-married male youth, the majority feel comfortable discussing this subject with service providers (45%) than with their parents (39%). Interpersonal communication about postpartum/neonatal consultations (Appendix A Table 10.12) The results of the 2005 MVHS show that interpersonal communication about postpartum and neonatal medical consultations within the 1st week of delivery is very uncommon. As shown in Figure 10.6, only 13% of ever-married women and 7% of husbands have discussed such issue during the 6 months preceding the survey.
67
Differences between villages are very clear. While 33% of women in Zohra had discussed postpartum/ neonatal consultations, only 6% or less in some other villages had done so. Similar results are observed for husbands in those villages.
Fig 10.6 Percentage who have discussed postpartum/neonatal consultations with others, by group (%) 13
7
Women who discussed these consultations did so predominantly with their husbands (41%), friends and neighbors (22%), and relatives other than their parents (15%). Husbands who Wo men had such discussions are most likely to have spoken to their wives (66%) and friends and neighbors (19%).
10.4
H usbands
Communication about Healthy Lifestyles
Health messages about passive smoking (Appendix A Table 10.13) The results of the 2005 MVHS indicate that recall of health messages about passive smoking relatively low. About one quarter of all ever-married women, husbands, and never-married females reported receiving information about passive smoking in the 6 months preceding the survey. For nevermarried males, the percentage is much lower (18%).
Fig 10.7 Percentage who recall health messages about passive smoking, by group 27
25
24
18
Wo men
H usbands
N ever-
N ever-
Further inspection shows that recall of married married male f emale yo ut h yo ut h passive smoking messages varies considerably across villages. For example, the percentage of ever-married women who recall hearing or seeing such messages in the 6 months preceding the survey ranges from only 14% in Monshaat Al Maghalka to 34% in Koloba. A similar pattern was observed for husbands and never-married females. For never-married male youth there are strong differences across villages, with 87% of male youth in Koloba able to recall passive smoking messages compared to less than 16% in some other villages. Table 10.7 Level of Comfort Discussing the Dangers of The respondents who reported receiving information about passive smoking in the 6 months preceding the survey identified television as their main source of information (95% of women, 86% of husbands, 91% of female youth, and 92% of male youth). Level of comfort discussing smoking (Appendix A Table 10.14)
Smoking and Smoking Cessation Nevermarried Female Male Women Husbands Youth Youth Percentage comfortable discussing the subject with their: Spouse Parents/parents-in-law Other relatives Service providers Friends/neighbors Brothers/sisters No one
40 7 15 37 11 18
24 4 17 40 38 14
31 8 30 61 23 22
14 12 55 46 12 4
The data show that the majority of respondents feel comfortable talking with others about the dangers of smoking and how to quit this habit. Specifically, 82% of ever-married women, 86% of husbands, 78% of never-married females, and 96% of never-married males feel comfortable discussing this subject with other people.
68
Among married women, 40% reported feeling comfortable talking to their husband about smoking and how to quit, while 37% reported feeling comfortable discussing this topic with service providers. The majority of husbands on the other hand reported feeling comfortable discussing smoking with service providers (40%), friends and neighbors (38%), and their wives (24%). Never-married females feel comfortable discussing the subject with their parents (31%) and with service providers (30%). Most of the never- married male youth are comfortable discussing smoking with service providers (55%) and with their friends or neighbors (46%). Interpersonal communication about smoking (Appendix A Table 10.15) Although the majority of respondents tend to feel comfortable discussing the dangers of smoking and how to quit, this does not necessarily imply that such discussions actually take place. For example, the results show that only 16% of ever-married women and 19% of husbands reported having discussed passive smoking with other persons in the 6 months preceding the survey. This is also the case for young never-married respondents, as only 11% of females and 19% of males have discussed this issue with other persons during the 6 months preceding the survey.
Fig 10.8 Percentage who discussed secondhand smoke with others, by group 19
19
16 11
Wo men
H usbands
N everN evermarried married male f emale yo uth yo ut h
The data also show that married women who discussed passive smoking did so mainly with their husband (73%), other relatives (22%), and friends or neighbors (15%). Husbands who discussed passive smoking, however, did so mostly with friends and neighbors (55%), their spouse (50%), and other relatives (27%). Never-married females who discussed passive smoking spoke mostly with other relatives (56%), their parents (41%), and friends and neighbors (25%). Never married males spoke mainly with friends and neighbors (80%) and to some extent with relatives other than their parents (31%).
10.5
Communication about HIV/AIDS
Knowledge about HIV/AIDS As mentioned previously in chapter six, the 2005 MVHS data show that the awareness of HIV/AIDS among females is lower than among males. Seventy-nine percent of ever-married women and 88% among never-married female youth had ever heard about AIDS. AIDS awareness among males is higher, reaching 92% for husbands and 91% for never-married male youth. Inspection of differences between villages reveals that respondents from Nazlet Hussein Ali display the highest awareness of AIDS. Television was the most common recent source of knowledge of HIV/AIDS. Level of comfort discussing HIV/AIDS prevention (Appendix A Table 10.16) The results indicate that a considerable percentage of respondents do not feel comfortable discussing HIV/AIDS prevention. For instance, 36% of evermarried women and 25% of husbands reported not feeling comfortable discussing this subject with anyone. Likewise, 32% of never-married females and 13% of never-married
Table 10.8 Level of Comfort Discussing HIV/AIDS Prevention Never-married Female Male Women Husbands Youth Youth Percent comfortable discussing HIV/AIDS prevention with: Spouse Parents/Parents in law Service Provider Friends/neighbors No one
14 4 43 7 36
14 1 46 20 25
17 39 14 33
6 61 28 13
69
males do not feel comfortable discussing HIV/AIDS prevention. Many respondents are most comfortable discussing HIV/AIDS prevention with service providers (43% of women, 46% of husbands, 39% of female youth, and 61% of male youth). Considerable percentages of male respondents would feel comfortable discussing such issue with friends and neighbors (20% for husbands and 28% for male youth). Few female youth would feel comfortable discussing such issues with their parents (17%). Moreover, only 14% of ever-married respondents (women and husbands) would feel comfortable discussing this subject with their spouses. Interpersonal communication about HIV/AIDS prevention (Appendix A Table 10.17) In the 2005 MVHS survey, respondents who had heard of HIV/AIDS were asked if they had discussed the risk of contracting HIV/AIDS with other people during the 6 months preceding the survey. The results show that among married women who had heard of HIV/AIDS, only 11% have recently discussed the risk of contracting HIV with other people. For the husbands who are aware of HIV/AIDS, this was the case for 15% of them. Among those youth who heard about HIV/AIDS, only 10% of never-married female youth and 17% of never-married male youth have discussed the risk of contracting the disease with other people. The percentage of respondents who discussed the risk of contracting HIV/AIDS varies remarkably across villages. For example, although 41% of women who heard of HIV/AIDS in Zohra village have discussed this risk in the six months prior to the survey, only 1% of those women in Toukh El Khail have done so. Almost the same pattern is observed for husbands and never-married females. In Koloba, forty four percent of male youth who heard of HIV/AIDS have discussed the risk of contracting HIV/AIDS, compared to only 6% in Ebshedat.
Fig 10.10 Percentage who Discussed Risk of Contracting HIV/AIDS with others, by group 17 15 11
Wo men
10
H usbands
N evermarried female yo ut h
N evermarried male yo uth
Married women who discussed the risk of contracting HIV/AIDS spoke mostly with their husbands (53%) and to a lesser extent with friends or neighbors (31%) and other relatives (17%). The majority of husbands who discussed the topic did so with friends and neighbors (59%) and to a lesser extent with their wives (34%). Those never-married youth who discussed the risk of contracting HIV/AIDS mostly did so with friends (57% for females and 83% for males).
10.6
Communication about Hepatitis Prevention
Health messages about safe injections (Appendix A Table 10.18) Several communication programs have been developed to provide information Fig 10.11 Percentage who recall safe about safe injection practices in order to injection messages in the past 6 months, by reduce Hepatitis infections. In the 2005 groups 42 40 MVHS, respondents were asked if they 31 received information about safe injections 27 during the 6 months preceding the survey. Overall, recall of such messages is relatively low. Only 40% of ever-married women, 31% of husbands, 42% of nevermarried females, and 27% of never-married Wo men H usbands N everN evermales have recently received information married married male f emale yo uth yo ut h about safe injections. The level of recall of safe injection messages varies by village. For example, 58% of ever-married women in Nazlet Hussein Ali have recently received information about safe injections compared to only 22% of women in Monshaat Al Maghalka. 70
Almost all respondents who received information about safe injections reported that they were instructed to use only a syringe in a sealed packet (more than 90% of all respondents), and about two-third of respondents were instructed not to share syringes. For example, among ever-married women who learned about safe injections, 91% said they had learned to use only syringes in a sealed packet, and 66% learned not to share syringes. Very low percentages of respondents have received information about boiling/sterilizing the syringe before reuse. Among those who report receiving information about safe injections in the 6 months preceding the survey, the majority reported television as their last source of this information (69% for women, 71% for husbands, 79% for never-married females, and 84% for never-married males). Lower percentages of respondents reported medical providers as a source of such information (25% for women, 18% for husbands, 13% for female youth, and 7% for male youth). Level of comfort discussing unsafe injections (Appendix A Table 10.19) The results show that the majority of respondents feel comfortable discussing unsafe injections (over 80% for each of the four target groups). The majority of respondents from each of the four target groups appear to be most comfortable discussing this subject with service providers (ranging from 44% from never-married females to 77% from never-married males). Considerable percentages of husbands and ever-married women would feel comfortable discussing this issue with their spouses (20% for women and 30% for husbands). The results also show that a considerable percentage of never-married youth would be comfortable discussing the topic of unsafe injections with their parents (28% of females and 15% of males), siblings (16% of females and 9% of males), and friends or neighbors (12% of females and 17% of males).
10.7
Communication about Female Circumcision
Several recent surveys indicate that the practice of female circumcision is still very common in Egypt. (2003 EIDHS; El-Zanaty & Way, 2004). This was also confirmed in rural Menya. In recent years several programs have been implemented to reduce female circumcision. One of these programs is a television spot called “No for FGM, I am an Egyptian Girl.” This spot covers different important topics, including female education, early marriage, and FGM. Even so, 87% of women and 70% of the never-married female youth reported that they had been circumcised. But this trend may be starting to change. Only 4 in 10 husbands and women who have daughters reported that they have at least one circumcised daughter. In addition, 54% of husbands, 48% of women and 40% of never married females say that they intend to have their daughters circumcised in the future. However, 76% of never married males say they intend to have their daughters circumcised. Around two thirds of women and husbands and three quarters of, never-married male youth indicated that the practice should be continued, compared with 40% of never-married female youth. The most common reasons indicated by all respondents were that the practice is required by religion and is a good tradition. Health messages about female circumcision (Appendix A Table 10.20) Respondents were asked if they could recall any mass media or interpersonal communication about female circumcision. Among respondents who said they had heard information about female circumcision, most report receiving this information from television. This is the case for 72% of evermarried women, 64% of husbands, 72% of nevermarried female youth, and 73% of never-married
Fig 10.12 Percentage who recall FGM messages from television, by group
72
Wo men
64
H usbands
72
73
N evermarried f emale yo uth
N evermarried male yo ut h
71
male youth. Radio and magazines are less important sources of information about female circumcision. They were mentioned by fewer than 16% of respondents in each group. Similarly, local meetings, mosques, and churches are much less important sources of information. Discussions about female circumcision Respondents were also asked whether they discussed female circumcision with relatives, friends, or neighbors. Overall, 31% of ever-married women, 20% of husbands, 24% of never-married females, and only 15% of never-married males discussed the subject of female circumcision with relatives, friends, or neighbors.
10.8
Health Campaigns in Egypt (Appendix A Table 10.21)
The 2005 MVHS questionnaire also includes questions about recall of past health campaigns in Egypt. Respondents were asked if they remembered “Zeina and Zaki”, “Gold Star”, “Isaal Istasher”, and other health campaigns. These campaigns covered many important health topics such as antenatal care, family planning, birth spacing, “no for FGM,” early marriage, and other family health related issues.
Fig 10.13 Percentage who recall of the “Zeina and Zaki” campaign, by group 55
49
29
30
Wo men H usbands N everN everThe data show that females are more likely than married married males to remember the health campaigns. About f emale male yo ut h half of never-married female youth and everyo ut h married women remembered the “Zeina and Zaki” campaign, compared to slightly less than one third of husbands and never married male youth. Substantial differences were observed between villages. Respondents from Nazlet Hussein Ali and Monshaat Al Maghalka villages are most likely to remember such campaigns compared to other villages.
The data show that female respondents remembered the “Gold Star” campaign more than other campaigns, while male respondents remembered the “Isaal Istasher” campaign more than other campaigns.
Table 10.9 Percentage Who Recall Various Health Campaigns in Egypt
When respondents were asked whether they Percentage remembered any other health campaigns, very Recalling: few respondents (5% or fewer) from all Gold Star groups reported “No for FGM, I am an Isaal Istasher Egyptian Girl” and “Sehetna Bein Edeina, for Ahmed Maher.” These two campaigns were mentioned mostly by respondents in Nazlet Hussein Ali village.
72
Never-married Female Male Women Husbands Youth Youth
58 58
38 43
67 63
44 48
CHL BEHAVIOR CHANGES COMMUNICATION ACTIVITIES
11
Communication activities play a vital role in all health programs. The CHL program provides support across the following health areas: family planning and reproductive health, maternal and child health, infectious diseases control, healthy lifestyle, household preventive health, and health maintenance practices. Accordingly, to assess the behavior changes caused by different media interventions, recall of campaign messages, the perceived benefits and the effect of the messages on respondent’s behaviors were examined in the 2005 MVHS.
11.1
Recall of CHL Campaign Messages on TV
Television Watching Habits (Table 11.1) A series of questions were asked to assess media habits, including questions about frequency of TV viewing, preferred channels and preferred viewing times. The results of 2005 MVHS show that females are more likely to watch TV than male respondents, with 93% and 95% of women and female youth respectively reported that they watch TV regularly or sometimes, compared Table 11.1 Percentage of Respondents Who Watch TV and percentage who Watch Specific Channels to 90% among husbands and male youth. Most of those who watch TV prefer Never married Channels 1 and Two. They also prefer Female Male Channel Seven and satellite channels. Women Husbands Youth Youth However, male youth are more likely to watch satellite channels than other groups. 93 90 95 90 Watch TV (%) Respondents in Zohra, except male youth, Preferred TV Channels (%) prefer to watch satellite channels. 91 90 90 87 Respondents in Monshaat Al-Maghalka are Channel 1 80 76 80 81 least likely to watch satellite channels. Male Channel 2 youth in Saft Al-Khamar are most likely to Channel 7 47 48 48 62 watch satellite channels (63%), while those Satellite Channel 24 26 24 30 in Koloba are least likely to do so (15%). All groups of respondents prefer to watch the TV in the evening (6 pm to 9 pm) or at night (after 9 pm). However, more than half of all respondents do not have any preferred time for watching television. 11.1.1
Recall of CHL Campaign Messages from TV Programs (Table 11.2)
The CHL program develops several television programs that address issues related to use of family planning after the first birth, family health, smoking, safe injection, child health, etc. Respondents were asked whether they saw such TV programs during the past 12 months. If so, they were asked to recall the topics of these programs, what they learned from the programs and whether they believe these programs affected their behaviors.
Fig 11.1 Pe cce ntage who watche d a h ealthrelated TV program in the past ye ar, by grou p 17
16
Wo men
H usbands
18
N ever married f emale yo ut h
16
N ever married male yo ut h
Data from the 2005 MVHS show that about 17% of all groups of respondents reported that they saw a health-related television program during the last 12 months. Respondents in Koloba and Saft Al-Khamar were more likely to recall these programs compared to respondents in other villages.
73
Respondents were asked to name Table 11.2 Percentage of Respondent Who Recall TV programs the topics of these programs. The on Specific Health Topics most frequent topic mentioned by women was “Birth Spacing” (7%), Never married while “Danger of second hand Female Male smoke” was the most frequent Women Husbands Youth Youth message recalled by male respondents (10% of husbands and Birth Spacing 7 3 5 2 Multiple birth problems 9% of unmarried male youth). 6 6 6 6 “Multiple birth problems” and Antenatal Care 3 2 4 3 “Danger of second hand smoking” Danger of second hand smoking 6 10 6 9 are the messages most frequently mentioned by female youth. Differences were clear between villages. For example, 20% of women in Koloba recalled messages about birth spacing compared to only 3% of women in Zohra. Respondents were asked whether Table 11.3 Percentage of Respondents Who Report Learning they learned anything from these Specific Things from TV programs TV programs. If so, they were asked what they learned. Few Never married people were able to name Female Male spontaneously what they had Women Husbands Youth Youth learned from the television programs, but women were most Knew FP methods 6 5 8 4 likely to have learned about the Importance of Birth Spacing 7 4 6 4 importance of birth spacing, while Importance of protecting nonsmokers from smokers 3 6 4 8 female youth were most likely to Nothing / Did not see the have learned about family program 88 87 88 90 planning methods. Male respondents most often said they had learned about the importance of protecting nonsmokers from second-hand smoke (6% of husbands and 8% of male youth). Significant differences were observed between villages. For example, 18% of women in Koloba mentioned that they learned about the importance of birth spacing compared to only 2% of women in Zohra. Respondents were also asked if the Table 11.4 Percentage of Respondents who Reported Specific programs changes their practices, Behavior Changes as a Results of TV programs attitudes and intentions. Data from the 2005 MVHS show that TV Never married programs affect the self-reported Female Male behaviors of unmarried youth Women Husbands Youth Youth somewhat more than married respondents. Almost 90% of both Used FP methods 3 2 Spaced between births women and husbands reported that 2 1 these programs did not affect their Intend to use FP methods 2 2 9 6 behaviors, compared to almost Intend to space between births 2 1 5 3 88% of unmarried youth. Some No effect / Did not see the married respondents reported that program 90 91 87 88 they started using a family planning method as a result of TV programs (3% of women and 2% of husbands), while some unmarried youth reported that they now intend to use family planning methods after marriage (9% among female youth and 6% among male youth). Furthermore, some married respondents now intend to use family planning methods, while some youth intend to space between births. Differences were observed between villages. For example, almost 21% of male youth from Koloba
74
reported that they intend to use family planning methods after marriage as a result of the programs compared to less than 1% among male youth in Zohra and Monshaat Al-Maghalka.
11.2
Recall of CHL Campaign Messages from Printed Media
The 2005 MVHS also collected information about recall of health messages in the print media. Respondents who can read were asked how often they read any newspapers or magazines. Those who read newspapers or magazines were asked whether they read anything about the use of family planning after the first birth, family health, smoking, safe injection, or child health during the past 12 months. They were then asked about the topics they read about, what they learned from these print materials, and whether these materials affected their behavior. Reading Habits (Newspapers/Magazines) (Table 11.3) Data of the 2005 MVHS indicate that 34% of unmarried male youth, 26% of both husbands and unmarried female youth and 10% of women sometimes or regularly read newspapers/magazines. Differences were observed between villages. For example, 69% of male youth in Saft Al-Khamar regularly or sometimes read newspapers or magazines, compared to only 20% among male youth in Nazlet Hussein Ali. 11.2.1
Fig 11.2 Percentage who regularly or sometimes read newspapers or magazines, by group 34 26
26
H usbands
N evermarried f emale yo ut h
10
Wo men
N evermarried male yo ut h
Recall of CHL Campaign Messages from Newspapers/Magazines (Table 11.3)
Respondents were asked whether they read Fig 11.3 Percentage who read about FP or any subject about use of family planning after FH in newspapers/magazines, by group the first birth, family health, smoking, safe injection or child health during the 12 months 6 preceding the survey. The data show that only 4 4 a limited percentage of all respondents read about such health topics. Unmarried female 2 youth are more likely than other respondents to have read about such topics. The data revealed that 6% of unmarried females, 4% of Wo men H usbands N everN everboth husbands and unmarried males and only married married f emale male yo ut h 2% of women read about family health during yo ut h the past year . Husbands and male youth in Koloba, women in Zohra and female youth in Ebshadat are most likely to read such topics in newspapers/magazines. Respondents are most likely to recall messages about family planning, the danger of second hand smoke, multiple birth problems and birth spacing. Due to the small number of respondents who read about health topics, it is not possible to assess what they learned from these messages. 11.2.2
Recall of CHL Campaign Messages from posters/flyers/billboards (Table 11.4)
All respondents were asked if they saw posters, flyers, or billboards about use of family planning after the first birth, family health, smoking, safe injection or child health during the 12 months preceding the survey. Those who saw such posters/flyers/billboards were asked to list the messages they recall, what they learned from these messages, and to specify where they saw these posters/flyers/billboards.
75
Data from the 2005 MVHS indicate that recall of message from these types of print media is limited. However, females are more likely than males to recall seeing health topics on posters/flyers/billboards. The data show that 13% of both women and unmarried females, 6% of husbands and only 4% of unmarried males reported that they saw posters/flyers/billboards about health topics. Significant differences were observed among villages. Women in Koloba, husbands and female youth in Ebshadat and male youth in Nazlet Hussein Ali are most likely to have seen health-related posters/flyers/billboards.
Fig 11.4 Percentage who saw posters/flyers/billboards about FP and FH, by group 13
13
6
Wo men
4
H usbands
N evermarried f emale yo ut h
N evermarried male yo ut h
Respondents who saw Table 11.5 Percentage Who Recall Seeing posters/flyers/billboards were asked Posters/flyers/billboards about Specific Health Topics about the topics of these posters. One of the topics mentioned was that Never married family planning is a health essential. Female Male This topic was mentioned by 10% of Women Husbands Youth Youth both women and unmarried females, and by 3% of husbands and 2% of Antenatal Care 6 2 4 1 unmarried males. Females also noted Family planning is a health seeing messages about antenatal 10 3 10 2 essential FP and RH services for all care, while males mentioned seeing 3 1 2 0.2 materials about the danger of second Dangers of second hand smoking 1 2 3 2 hand smoke. Significant differences were observed between villages. For example, 17% of women in Koloba recalled the messages that family planning is a health essential, compared to only 3% of women in Monshaat Al-Maghalka. Respondents who saw posters/flyers/billboards were also asked what they learned from these materials. About 89% of women and 88% of unmarried females said they had learned nothing new, compared to 95% for male respondents. Respondents from Ebshadat are most likely to have learned something from posters/flyers/billboards.
Table 11.6 Percentage Who Report Learning Specific Health Issues from Posters/Flyers/Billboards Never married Female Male Women Husbands Youth Youth Importance of FP Importance of ANC Importance of protecting nonsmokers from smokers Nothing / Did not see the Posters/flyers/billboards
8 4
3 1
9 3
2 0.4
1
1
3
2
Respondents were most likely to 89 95 88 96 report having learned about the importance of family planning. Females also reported having learned about the importance of antenatal care, while males reported learning about the importance of protecting nonsmokers from second-hand smoke. Those who were able to recall receiving health information from posters/flyers/billboards report seeing these materials in the health unit. Few husbands mentioned that they saw these posters/flyers/billboards in the street and others mentioned seeing them in the pharmacy. The same pattern was observed among male youth. Differences were observed between villages. For example, husbands in Ebshedat are most likely to see such print materials in the health unit, while those in Nazlet Hussein Ali are most likely to see such them in the street.
76
11.3
Recall of CHL Campaign Messages from Seminars/Community Meetings (Table 11.5)
The CHL program also promoted community meetings and seminars that talk about family planning and family health. The 2005 MVHS investigates to what extent respondents recall information from those activities, what the main topics of these meetings were, what they learned from the meetings, and whether the meetings and seminars changed the respondents’ behavior. Respondents were asked whether they attended Fig 11.5 Percengage who attended any seminars or community meetings during the seminars/meetings about RH and FP 12 months preceding the survey that dealt with use of family planning after the first birth, family 5 health, smoking, safe injections or child health. As confirmed in many previous surveys, few 2.4 people attend community meetings. Recall of 1.6 1.5 messages from community meetings is very low overall. Only 5% of women and around 2% of all other groups of respondents had attended Wo men H usbands N ever N ever seminars or community meetings about family married married female male yo uth planning or reproductive health during the 12 yo ut h months preceding the survey. However, respondents—especially married women—in intervention villages were more likely than respondents in control villages to report community meetings or seminars as a source of health information. As much as 16% of married women in the intervention villages of Saft Al Khamar, 12% in Nazlet Hussein Ali, 8% in Zohra and 7% in Koloba reported community meetings as a source of FP/RH information, compared to Fig 11.6 Percentage who know someone who attended seminars/meetings about RH only 1% in the control villages of Toukh El and FP, by group Khail and Ebshedat. 14
12 Respondents were also asked if they know 9 someone who attended seminars or community 5 meetings about use of family planning after the first birth, family health, smoking, safe injection or child health during the 12 months Wo men H usbands N ever N ever preceding the survey. Data from the 2005 married married f emale male yo ut h MVHS show that females are more likely than yo uth males to report knowing someone who attended such meetings during the last 12 months. 14% of women, 12% of unmarried females, 9% of husbands and only 5% of unmarried males reported that they knew someone who attended seminars/community meetings about health in the preceding 12 months. Again, married women in intervention villages are much more likely to report knowing people attended such seminars/meetings than respondents in control villages.
11.4
Recall of CHL Campaign Messages from home visits (Table 11.5)
Because the CHL communication program promotes home visits by a health worker or Raida Refia, ever-married women were asked if a Raida Refia or health worker visited them during the last 12 months. If so, they were asked what they talked about. Overall about 8% of married women said that they were visited by a Raida Refia or a health worker, who was most likely to talk to them about family planning and antenatal care. Married women in intervention villages were more likely to report this source of health information than were women in control villages. For example, over 20% of married women in Saft Al Khamar reported a visit by a health worker compared to 1% in Toukh El Khail.
77
11.5
Recall of the CHL “Mabrouk” book (Table 11.6)
CHL produces a book called “Mabrouk” Fig.11.7 Percentage who recall the "Mabrouk" (“Congratulations”), which talks about book, by group family health and happiness, pregnancy, 4 safe delivery, childbirth and child caring and child vaccination. This book is 3 distributed to newly married couples. 2 Accordingly, respondents were asked if they saw the “Mabrouk” book. If so, they 1 were asked to list the topics that the book addresses. Data from the 2005 MVHS indicates that few respondents recall Wo men H usbands N everN evermarried married male seeing the book. Overall, only about 4% f emale yo ut h yo ut h of married women, 3% of female youth, 2% of husbands and only 1% of male youth said that they had seen the “Mabrouk” book, but less than 1% of women in control villages compared to 7% in intervention villages had seen it. Those who saw the book are most likely to recall that it dealt with family health and happiness.
11.6
Recall of Specific CHL Campaign Spots and Slogans
This section assesses recall of specific CHL campaing spots and slogans through prompted questions. All respondents were asked about specific campaign activities, such as the “Your Health is Your Wealth”, “Family doctor” and “Isaal Istashir” TV spots. Then they were asked about the messages conveyed by these spots, what they learned from the spot, and whether the spots affected their behavior. 11.6.1 Recall of the “Your Health is Your Wealth” Spot
Table 11.7 Percentage Who Recall Specific Messages of the “Your Health is Your Wealth” TV Spot Never married Female Male Women Husbands Youth Youth Parent’s health affect child’s health Family Health Care Antenatal Care Family Planning Birth Spacing
7 18
5 11
8 21
5 15
6 17 8
2 9 3
5 18 10
3 12 4
11.6.1.a Recall of the “Your Health is Your Wealth” TV Spot (Table 11.7) Respondents were asked if they watched the “Your Health is Your Wealth” TV spot during the 12 months preceding the survey. Those who reported watching the spot were asked what messages the spot conveyed, what they learned from these messages, and whether the spot affected their behavior. Around 40% of all respondents, except husbands (23%) reported seeing the “Your Health is Your Wealth” television spot in the 12 months preceding the survey, but recall was not appreciably different in control compared to intervention villages, as would be expected since the reach of mass media does not depend on localized outreach activity.
Fig 11.8 Percentage who watched the "Your health is your wealth" TV spot, by group 41
38
37
23
Wo men H usbands N everN everRespondents were most likely to say that the married married male spot was about family health care and family f emale yo ut h yo ut h planning and, to a lesser extent, birth spacing and antenatal care. Respondents from all groups were most likely to report that they had learned
78
about the importance of caring for the family’s health and were most likely to say that the spot had made them care more about caring for “my health and my spouse’s health.” Significant differences were observed between villages. For example, 26% of women in Ebshedat recalled that the spot talked about “family health care” compared to only 3% among women in Zohra. Respondents were asked whether they learned anything from the Table 11.8 Percentage Who Learned Specific Messages from the spot, and if so, what they learned. “Your health is your wealth” TV spot The data revealed that about 70% of all groups of respondents Never married (except husbands, 82%) learned Female Male nothing from the spot. Differences Women Husbands Youth Youth were observed between villages. If parent’s health is good, the Women and husbands from Nazlet child’s health will be good 6 4 7 6 Hussein Ali, female youth in Importance of family health Koloba and male youth in Saft Alcare 18 10 20 15 Khamar are more likely than other Importance of birth spacing from 3 to 5 years 9 2 11 6 groups to have learned something Nothing / Did not see the spot from the TV spot. Respondents are 72 82 69 70 most likely to have learned about the importance of family health care, which was reported by 18% of women, 10% of husbands, 20% of female youth and 15% of male youth. 9% of women and 11% of unmarried females reported learning about the importance of spacing birth 3 to 5 years. 4% of husbands and 6% of male youth reported learning that “If parent’s health is good the child’s health will be good.” Data from the survey show that youth are Fig 11.9 Percentage who reported that the more likely than married respondents to "Your health is your wealth" TV spot report that the TV spot affected their changed their behavior, by group behavior. More than one quarter of unmarried youth (26% of female youth and 27% of male 27 26 youth) reported that their behavior was 20 affected by the TV spot, compared to 20% of 13 women and 13% of husbands. Women and husbands reported that the spot encourage them to care for their health and that of their Wo men H usbands N everN everspouse, and to use family planning. Youth married married male f emale yo ut h yo ut h mentioned that the spot changed their intentions. Specifically, they are now more inclined to care for their own health and of their spouse, to use family planning methods and to space their births. Significant differences were observed between villages. For example, women and husbands from Nazlet Hussein Ali were more likely than those in other villages to mention that they cared for their health and that of their spouse (21% and 11% respectively). Additionally, female youth in Koloba and male youth in Saft Al-Khamar are more likely than others to mention that they intend to care for their health and their spouse’s health. Respondents were asked whether they talked with someone about the “Your Health is Your Wealth” TV spot. The data show that most respondents did not talk about the spot (ranging from 92% of women and male youth to 95% of husbands). Respondents who talked about the spot talked are most likely to have discussed it with their friends/neighbors, except for husbands. Husbands are most likely to have discussed it with their wives.
79
Recall of the “Your Health is Your Wealth” Slogan (Table 11.8) The questionnaire asked whether respondents Fig 11.10 Percentage who saw/heard the saw or heard the slogan “Your health is your "Your health is your wealth" slogan, by wealth” during the 12 month preceding the group survey and, if so, where they saw or heard this 49 44 40 slogan. The data from the 2005 MVHS show 34 that female respondents are more likely than male respondents to have seen or heard the slogan “Your Health is your Wealth”. Slightly less than half of never married female youth (49%) and 44% of women reported that they Wo men H usbands N everN eversaw/heard this slogan during the last 12 married married male f emale yo ut h yo ut h months, compared to 40% of unmarried male youth and 34% of husbands. Most respondents who recall seeing or hearing the slogan reported that they heard it on television. Recall of the “Family Doctor” TV Spot (Table 11.9) The CHL “Family doctor” TV spot informed Fig 11.11 Percentage who saw the "Family people that a family doctor is available in doctor" TV spot every health unit. The family doctor is a 19 19 private doctor who can check the health of all family members, and who will keep a medical 10 history of each family member. The spot also 6 clarified that family health clinics provide a wide range of health examinations. Data from the 2005 MVHS indicate that less than a Wo men H usbands N everN everquarter of all respondents had seen the married married male “Family Doctor” TV spot during the last 12 f emale yo ut h yo uth month. Female respondents are more likely than males to reported that they saw the spot. Almost one in five women and unmarried females (19% each), 10% of husbands and only 6% of unmarried male youth mentioned that they saw the TV spot during the last 12 months. Significant differences were observed between villages. Women in Koloba, husbands and female youth in Saft Al-Khamar and male youth in Nazlet Hussein Ali are more likely to have watched this spot than those in other villages. Respondents who saw the “Family doctor” TV spot were asked about messages that the spot conveyed. Data from the 2005 MVHS shows that the messages that were most often mentioned are: “A family doctor is available in every health unit”, “A family doctor is a private doctor who will check the health of all family members” and “Family health clinics offer all kinds of health examinations”. However, differentials were observed among different villages. For example, women in Ebshadat are more likely than women in Nazlet Hussein Ali to recall the message “A family doctor will be a private doctor who will check the health of all family members” (15% vs. 1%). Recall of the “Isaal Istashir” Campaign (Table 11.10) The “Isaal Istashir” campaign advises people to consult a doctor or pharmacist in any medical center or pharmacy that has the Isaal Istashir sign whenever they have health problems. The campaign encourages people to use family planning methods and gives information about contraceptive pills for breastfeeding women. The “Isaal Istashir” campaign includes television spots and posters at pharmacies, health units and clinics.
80
Respondents in 2005 MVHS were asked whether Fig 11.12 Ever seen/heard "Isaal they had ever seen or heard about the “Isaal Istashir" spot Istashir” campaign. Data indicated that females are 63 55 more likely than males to recall hearing or seeing 47 this campaign. Slightly less than two thirds of 42 unmarried females (63%) and 55% of women mentioned recalled seeing or hearing this campaign. Television is the main source. The same pattern was observed among male respondents, with 47% of unmarried males and 42% of Women Husbands Never-married Never-married husbands reported to have been the campaign. f emale youth male youth Again, television is the main source of this information, followed by posters in pharmacies or clinics. Differences were observed between villages. Women and female youth in Monshaat AlMaghalka, husbands in Nazlet Hussein Ali and male youth in Saft Al-Khamar are most likely to mention that they heard or saw the “Isaal Istashir” campaign. Respondents were asked if they Table 11.9 Percentage Who Recall Specific Messages of the “Isaal could recall the messages Istashir” campaign disseminated by the “Isaal Never married Istashir” campaign. The data revealed that respondents were Female Male most likely to recall that the Women Husbands Youth Youth campaign advised people to Advise people to consult a consult a doctor/pharmacist about 26 18 35 19 doctor about problems problems or inquiries. Female Promotes use of FP methods 16 10 19 9 respondents were more likely than Consult medical center that males to recall this message. More has (Isaal Istashir) sign 7 9 8 16 than one third of female youth Talk about FP methods 19 14 18 10 (35%) and 26% of women recalled this message compared to about 18% of husbands and unmarried male youth. Married respondents were also likely to recall that the campaign talked about family planning methods (19% among women and 14% among husbands). Unmarried female youth recalled that the campaign promotes use of family planning methods (19%), while male youth recall that the campaign encouraged them to consult a doctor/pharmacy/medical center that has the “Isaal Istashir” sign when they have health problems. Differences were observed between villages. For example, 44% of women in Monshaat Al-Maghalka mentioned that the campaign advises people to consult an Isaal Istashir doctor/pharmacist about health problems or inquiries compared to only 15% among women in Toukh El-Khail. Respondents in the 2005 MVHS Table 11.10 Percentage Who Learned Specific Things from the were asked whether they learned “Isaal Istashir” campaign anything from the “Isaal Istashir” Never married campaing, and if so, what they learned. The data revealed that Female Male unmarried female youth are more Women Husbands Youth Youth likely than other groups of Consult medical center that respondents to have learned has (Isaal Istashir) sign 23 16 33 21 something from this campaign. Consult a doctor/pharmacist Slightly less than half of about problems 13 10 17 13 unmarried female youth (48%) Knew the use of FP methods 15 11 15 12 reported that they did not learn Nothing 58 70 48 62 nothing from this campaign, compared to more than half of women (58%), 70% of husbands and 62% of unmarried male youth. Respondents in Monshaat Al-Maghalka (except unmarried male youth) are more likely than those
81
in other villages to mention that they learned something from this campaign. Unmarried male youth in Saft Al-Khamar are least likely to mention that they did not learn anything from the Isaal Istashir campaign. Respondents are most likely tho have learned that they should consult doctor/pharmacist or medical center that has “Isaal Istashir” sign. Married respondents are also likely to have learned about the use of family planning methods, while unmarried youth learned to consult doctor/pharmacist about health problems/inquiries”. Significant differences were observed between villages. For example, 31% of women in Nazlet Hussein Ali mentioned that they should consult a doctor or medical center that has the “Isaal Istashir” sign compared to only 14% among women in Toukh El-Khail. The private sector initiative progam provides training for pharmacists in interpersonal communication, to help them provide advice to women who need family planning. Pharmacies that have a trained pharmacist are marked with an “Isaal Istashir” sign. Accordingly, respondents were asked whether they have ever gone to a pharmacy that has the “Isaal Istashir” sign. The data from the 2005 MVHS revealed that less than one fifth of all respondents reported that they have gone to a pharmacy that carries the “Isaal Istashir” sign (14% of women, 19% of husbands, 16% of female youth and 14% of male youth). However, differences were observed between villages. Married respondents and never-married female youth in Nazlet Hussein Ali and never-married male youth in Toukh El-Khail are more likely than others to have been to a pharmacy that has the “Isaal Istashir” sign.
82