15th ICCRTS “The Evolution of C2” COAction: Enabling Collaborative Option Awareness Topic(s): 1, 3, 4, & 6 Authors: Gary L. Klein*, Jill L.Drury*, Mark Pfaff†, and Loretta More‡ POC: Gary L. Klein The MITRE Corporation 7515 Colshire Drive, McLean, VA 22102-7508 +1-703-983-5291
[email protected] Authors’ affiliations: The MITRE Corporation † Indiana University Indianapolis ‡ The Pennsylvania State University *
COAction: Enabling Collaborative Option Awareness ABSTRACT The authors previously have demonstrated the computational and psychological efficacy of providing “option awareness” under circumstances of deep uncertainty. They used exploratory modeling to forecast a landscape of plausible outcomes for a set of courses of action. Scoring the outcomes and displaying the resulting decision space in a frequency format allowed decision makers to identify robust options – ones that will have good outcomes across the broadest swath of plausible futures. Moreover, such decision support resulted in increased confidence in the chosen option. However, merely jointly executing the most robust individual options may not yield the most robust organizational option. The current paper explains the development of models to support collaborative decision spaces yielding collaborative option awareness to address this issue. The goal is to enable more robust tactical collaborative decision making even under the most difficult conditions, when interdependence is reciprocal (when collaborators pose contingencies for each other) and require constant mutual adjustment.
Introduction COAction (enabling Collaborative Option Awareness for joint actions) is a process to enable more robust tactical collaborative decision making even under the most difficult conditions. An example of such conditions is when collaborators impose requirements on each other’s actions (termed reciprocal interdependence) and must engage in detailed real-time negotiation (termed mutual adjustment coordination): see Thompson (1967), Klein & Adelman (2005), and Klein, Adelman & Kott (2008). The COAction process builds upon the distinction presented in Hall, Heller & McNeese (2007) between the situation space (consisting of facts about the environment such as the position and character of a target) and the decision space (information about the courses of action that a decision maker might take). We have integrated these concepts with the exploratory modeling approach of Bankes (1993). The resulting ability to compare options and understand the underlying factors that contribute to outcomes we have termed option awareness (Drury et al., 2009). COAction provides decision makers with a collaborative version of a decision space that enables collaborative option awareness. This process builds upon our previous work on developing individual option awareness. This paper includes a more complete description of option awareness than has been provided previously. Collaborative option awareness is defined for the first time and newly developed concepts are described that lay the foundation for this new extension of option awareness to support joint actions. It also describes how new empirical research could demonstrate the efficacy of providing collaborative option awareness to decision makers.
Background The robust decision-making process (RDMP) for course of action (COA) analysis can be considered an extension of the military decision-making process (MDMP). Instead of assessing 1
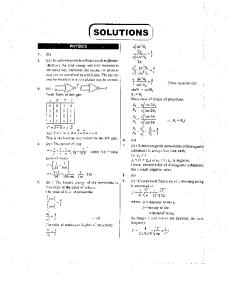
three options and a handful of projected outcomes typical of the staff-centered MDMP, the use of computer-based forecasting models for RDMP can result in the assessment of dozens of COAs with hundreds of variations due to uncertainty and yield a resulting landscape of plausible outcomes. A frequency format1 (Gigerenzer & Hoffrage, 1995; Hoffrage & Gigerenzer, 1998) approach to displaying the results (see Figure 1, explained further below) makes these results comprehensible, providing the decision maker with an ability to compare options and ultimately understand the underlying factors that contribute to outcomes.
Figure 1: A surface visualization of decision space provides Option Awareness
This is an example of one the situations we have used in simulation-based, human-in-loop experiments. For situation awareness, the subjects are trained to assess the textural event descriptions. They are provided with written rules of thumb and interactive training to assess the magnitude of emergency events, the impact of those events on immediate death, injury and damage, and for any implications for future resource needs. In this case, the magnitude is small because it is localized and not growing, the impact is moderately small because only one person is involved (albeit possibly gravely injured), and there are no implications for the future as there is no apparent persistent cause. Subjects are also trained to understand the decision space, such as that displayed in Figure 1. For each option in Figure 1, there is a distribution of possible consequences. Each distribution is a function of the uncertainty of the elements in the situation space (how big is the fire) and the uncertainty regarding executing the course of action defined in the decision option (what percent of fire trucks will get to the scene and when). While an optimal plan is one that will return the highest expected return on investment, under deep uncertainty (Lempert et. al. 2003), where situation and execution uncertainty are irreducible, optimal strategies lose their prescriptive value if they are sensitive to these uncertainties. That is, selecting an optimal strategy is problematic when there are multiple plausible futures for each option, as is the case in this example. Alternatively, Chandresekaran (2005) and Chandresekaran & Goldman (2007) note that for course of action planning under deep uncertainty one can shift from seeking optimality to seeking robustness. Robust options are those that result in acceptable outcomes across the 1
Displaying uncertainty information in terms of frequency distributions instead of probabilities
2
broadest swath of plausible futures. In this example case, sending one fire truck is forecasted to result in not only the lowest median cost, but also the lowest-cost worst case, and best case. This indicates that it is the most robust, that is the most insensitive to variations in the elements in the situation space. The factors leading to this result will be explained below. Figure 2 illustrates the details of generating such a decision space to identify a robust option. Each course of action is translated into values of endogenous variables that define that option in the simulation model. Uncertainty around each value of the endogenous variables is estimated and the values are respectively systematically varied (such as the actual number of fire trucks that would arrive in time to put out a fire) across multiple executions of the model. In addition, other exogenous variables that would not be under the control of a course of action, but would likely interact with it (like whether high winds will whip the flames in our simple example), are also systematically varied across these multiple executions of the model. The result is a set of combinations of different endogenous and exogenous variable values executed through the model, which, in turn, results in a landscape of plausible futures. Each of these futures can then be evaluated in terms of how much cost is generated by that future circumstance. For example, the aggregate cost of each fire-truck option is a function of the cost of sending the trucks, the immediate damage that occurred and damage that might occur elsewhere in the near future because the committed trucks are now unavailable. Such costs can be determined from authoritative sources, such as the cost of death based on actuarial tables. The robustness of an option is affected by both the uncertainty in the situation based on the forecast model and the uncertainty of costs based on the scoring model. Using the RDM approach a robust option can be found that is insensitive to both sources of uncertainty. Finding such an option is in fact crucial to facilitating collaborative decision making as explained further below. The costs in this instance are representative of the general classes of costs that would be used to score any outcome: the cost of acting on the course of action leading to the outcome the costs of the direct consequences resulting from the course of action any opportunity costs or additional costs that might occur in the future due to having taken the current course of action Plausible futures
Endogenous variables
COAs
Translation Model(s)
Forecasting Model(s)
Scoring Model(s)
Exogenous variables Uncertainty/Sensitivity Analysis
Figure 2: Model-based process for generating decision spaces.
3
The result of these cost evaluations for the landscape of futures under a given option is summarized graphically by the box plot2 for that option. As illustrated by the box-plot visualization of options in Figure 1, when the cost of all of the plausible futures for each option is compared, sending one fire truck seems to result in not only a lower median cost (the line inside the box), but also a relatively small range between the cost of the worst cases and the cost of the best cases (the distance between the “whiskers”). Therefore, sending one fire truck is the most robust decision option, returning the best cost profile across the range of plausible futures. A robust option will generate relatively tightly clustered outcome costs across multiple simulation runs, which indicates that its outcomes are relatively impervious to perturbations in exogenous and endogenous variable values. What we have described so far is only the lowest level of option awareness. As illustrated in Figure 3, three levels of option awareness can be distinguished that parallel the three levels of situation awareness defined by Endsley (2000):
Perception and comprehension of relative robustness of alternative options Level 1
Perception and comprehension of relationships between factors underlying the option outcomes Level 2
Projection of underlying relationships to adjusted or new options
Decision
Level 3
Figure 3: Three levels of Option Awareness
To illustrate higher levels of option awareness consider the somewhat more complicated decision space illustrated in Figure 4. This figure illustrates the decision space for options to mitigate the spreading of a pandemic disease, such as Swine Flu. In this decision space, public-health decision makers can engage in any or all of the following options: execute (or not) social distancing policies (e.g., telling people to stay home), target the vaccination of either 25% or 75% of the population, do vaccinations daily or monthly, and target the distribution of antivirals to 10% or 50% of the population. Taken in combination, there are 16 possible options visualized by the box plots in Figure 4. At only Level-1 option awareness, it may be difficult to select between option 1 and option 2. As illustrated in Figure 4, the two options have almost identical median costs; option 1 has a lower lowest-cost outcome, but it also has a much higher highest-cost outcome. Normally, such a choice might be resolved by the risk-seeking or risk-averse nature of the decision maker. But this decision space generated by RDMP enables a better resolution. Because the process preserves the linkage between the cost of an outcome and the underlying factors that contributed to that outcome, we can drill down and examine those factors to identify causal relationships. For example, in this illustration, the highest cost outcome, circled at the top of option 1, occurred under a low variation in the targeted 10% distribution of antivirals – only 9.67% received antivirals in this case. In the next much lower cost outcome (also circled), the target was actually 2
Tukey’s (1977) box plot is used here merely for illustration, as a common visualization option that typical research subjects can be readily trained to read. Of course, more complex decision spaces will require more domain-specific decision visualization methods.
4
Cost (1)
(2)
true 250 10 false
true 750 10 true
true 750 10 false
true 750 50 true
true 750 50 false
true 250 50 true
true 250 50 false
false 750 50 false
true 250 10 true
false 750 50 true
false 750 10 true
false 750 10 false
false 250 10 true
false 250 10 false
false 250 50 false
false 250 50 true
Figure 4: An example of higher levels of option awareness
slightly exceeded (10.17%). Further analysis does show this relationship between this antiviral factor and outcome-costs appears to hold across the landscape of outcomes. This comprehension of causal factors revealed by the decision space we have termed Option Awareness Level-2. This Level-2 option awareness can enable a decision maker to bring their experience and expertise to bear to craft new variations of the original option: perhaps to set the target for antivirals to 11% or to employ better quality control measures. To validate causal relationships, these new options would be evaluated through the generation of another decision space. This creation and evaluation of such novel options is termed Option Awareness Level-3. We have developed a research program to evaluate how to best facilitate each level of Option Awareness. So far, we have conducted research both into the psychological efficacy of providing Option Awareness Level-1to decision makers, and into the computational modeling requirements to generate decision spaces adequate to support all levels. Drury et al. (2009) describes an experiment with Option Awareness Level-1 to determine whether having this understanding would benefit individual decision makers. In the simulationbased, role-playing experiment, we asked participants to choose how many emergency resources (fire trucks or squad cars) to send to each of a series of fire and police events. All participants (a total of 35) received identical textual descriptions of situations (similar to the description 5
presented in Figure 1). Half of the participants (the “decision space” or DS group) were provided a visualization of the decision space such as the one illustrated in Figure 1. The remaining participants in a control group (the “situation space” or SS group) received only the textual description without the decision space visualization. This research revealed that providing this Option Awareness Level-1 decision space enhanced decision-making performance and confidence at a statistically significant level. The decisionaided group’s decisions were closer to the normatively correct decisions and this group rated the degree of decision support higher. The DS group made the correct resource allocation 68% of the time, compared to 40% in the SS group. Based on the odds ratio, individuals with the decision support were 3.15 times more likely to get the correct answer than those without. Furthermore, the decision-aided group’s confidence was higher, and this finding is particularly interesting. There has been much research in decision support tools, and many times the research tools help the decision maker to improve correctness. But even though the decision maker may choose the correct answer, when the correct answer is non-intuitive, they show less confidence in the answer (Klein, 1981). Using the RDMP, confidence may have increased with option awareness because it provides ranges of costs for each option that give a more complete picture of each option’s cost profile. So, it provides much more information than the typical estimation of a single average or median cost. Notice that in the decision space illustrated in Figure 4, if one considers only the median cost, the first five options would be considered equivalent, their differences lay in their cost distributions. Our computational modeling research has shown that in generating these decision spaces, we can save computational time and enable more tactical decision-making. To do this we must eliminate needless detail in the forecasting models, that is eliminate detail if it does not improve option awareness. Mathieu et al. (2010) describes how simpler low fidelity, low precision models can be proved to provide sufficient support to the decision maker. This was a pioneering application of exploratory modeling to address the human-computer integration requirements of tactical robust decision making. Klein et al. (2009) demonstrated that for an emergency response decision space, changes in the fidelity and precision of the forecasting models can significantly affect the forecasted differences between options, while not changing the order of the options in terms of their robustness. These results left open the question as to whether or not such changes translate into a substantial psychological impact on decision makers’ choices and confidence. In summary, this decision space research has shown that even at Option Awareness Level-1, decision making can be improved, and confidence can be increased. Moreover, using more parsimonious forecasting models can provide more tactically computable decision spaces. This work lays the foundation for a similar paradigm shift in collaborative decision making by changing the focus of collaboration from the situation space to the decision space.
COAction: enabling Collaborative Option Awareness for joint actions Today negotiations in collaborative decision making are still focused on the situation space: that is, upon the facts of the situation rather than on synergistic joint courses of action. Simply collaborating over individual decision spaces will not achieve collaborative option awareness because jointly executing the even the most robust individual options may not yield the most robust joint option. Collaborative decision making under these conditions is complex not only due to the difficulty of forecasting the impact of this synergy, but also the need to achieve a 6
common understanding among the joint participants. Therefore, new approaches are needed to extend option awareness to support joint actions. These new approaches will be discussed below. Without a decision space perspective, collaborators gather information (often irrelevant information) about a situation in hopes that a mutually viable option will become apparent. In time critical collaborative tasks like emergency response, airspace security, or battle management, time is wasted in the situation space instead of focusing on an option choice in the collaborative decision space. Collaborative decision making needs to move into the decision space paradigm. Consider the following example illustrated in Figure 5.
Figure 5: Fire at the Medical Center requires COAction
Cost
In this situation, a magnitude-3 fire has been reported near the Medical Center at 5:37pm on Saturday, just as the football game at Beaver Stadium is ending. The traffic from the football game will create significant congestion along the most direct route to the fire, increasing the time to get on scene and increasing the uncertainty around getting all dispatched fire trucks to the fire. The Fire Chief has an individual decision space like that illustrated in Figure 6.
Fire 4
Fire 5
Fire 3
Fire 0
Fire 1
Fire 2
Figure 6: The individual decision space for the Fire Chief
7
Sending four fire trucks is the most robust option. This is more fire trucks than would ordinarily be needed for a fire of this size, which is reflected in the higher than normal median cost for a fire of this magnitude. However, the delay caused by the congestions means that the fire will have more than normal time to grow in magnitude before they arrive. Sending four trucks will ensure that enough trucks make it through to adequately fight the larger fire. The down side is illustrated by the outlier (red dots) events, which are all cases where additional fires occur, and there will not be enough trucks in reserve to take care of them adequately, without calling upon Mutual Aid from another locality, which will cause extra response delays. Sending fewer fire trucks now to maintain a reserve for unlikely but potentially very costly futures, actually will result in higher projected costs because the immediately fire is likely to cause more damage and injury under those options. The police chief has an individual decision space like that illustrated in Figure 7.
Cost
Sending two squad cars will adequately handle the congestion while maintaining enough reserves to deal with most future police situations. Sending more increases immediate costs and does not improve the situation from a police perspective enough to offset those increases. In addition, sending more decreases reserves to handle future situations. Police 1
Police 2
Police 3
Police 4
Police 0
Police 5
However, sending two squad cars and four fire trucks ignores the Figure 7: The individual decision space for the Police Chief reciprocal interdependence between the police and fire departments in this situation and the synergy in possible joint action. This synergy is illustrated in Figure 8. Notice that in this decision space, not all of the possible combinations of resources are presented. The computer can be used to easily filter out options that are clearly less robust.
City Cost
In a joint action, by sending at least three squad cars the Police ensure that the stadium traffic congestion can be eliminated before the fire trucks arrive, consequently eliminating their delay in getting to the fire. This enables the Fire Chief to send only two fire trucks (the normal complement for a fire this size) to the Medical Center fire. In doing so, the Fire Chief can better maintain his reserves to fight future fires. The collaborative decision space also illustrates a
Fire22 Fire Police Police33
Fire 2 Police Police 44
Fire 3 Fire 3 Police 3 3 Police
Fire Fire 3 3 Police 4
Sort by Fire Resources Sort by Police Resources
Figure 8: The collaborative decision space
8
valuing of outcomes from a super-ordinate city perspective: while sending the additional squad car may not improve benefits for the Police Chief, it does improve the benefit for the city. From the city’s perspective, the likelihood and damage and injury of inadequately handling future fires outweighs the likelihood and cost of the few additional potential police situations that may go unhandled. Such joint environments are obviously particularly complex decision spaces. The question arises in such environments, “How can we develop a decision space in a tactical time frame?” How can we anticipate and model all of the complex synergistic ways in which our forces could jointly act? Klein, et al. (2009) suggests that highly complicated detailed models of the physics of interaction may not be needed to adequately support decision space generation. In the example above, the Fire Chief’s estimates of time to target with and without congestion, in conjunction with the Police Chief’s estimates of congestion resolution by squad cars, would likely be sufficient for a forecasting model to generate outcomes that will correctly order the joint options by robustness. These estimates could be entered directly into a forecasting model, leveraging human experience to translate from real-world behavior to model factor values. Indeed, the number of fire department performance factors (such as time to target and resource effectiveness) that the police could impact is rather limited, even though the behavioral ways by which they could impact those factors is quite large. If we rely on human experience for translation, then the modeling problem becomes tractable. In addition to developing a joint forecasting model, COAction will require the development of a super-ordinate scoring model. Indeed, the RDMP can tolerate the simultaneous comparison of multiple scoring models! An option that is robust across scoring models is likely to satisfy all of the joint participants. This is indeed a prime hypothesis to be tested, which addresses whether such approaches can overcome the frequent user experience of organizational resistance to collaborative use of other units’ organic assets.
COAction Empirical Research Methodology The concepts and processes presented above are testable in the laboratory. Below we describe examples of experiments to explore the impact of providing collaborative decision spaces using joint forecasting models and super-ordinate scoring models.
COAction Experiment 1 As a first step we can use a joint forecasting model in situations that do not require a superordinate scoring model. We can do this by creating scenarios where a single decision maker in a single department must coordinate resources across multiple sub-units. Reciprocal interdependence among the sub-units will introduce the complexity of synergistic joint action. However, because actions occur within a single department the outcomes will be scored from a single perspective. Consider an example (Figure 9) where the Fire Chief has to coordinate the application of fire trucks from multiple fire stations. In this example, Fire Station 1 is closer to the fire at the Agricultural Research Area, but has only two fire trucks available. Fire Station 2 has four fire trucks but is farther away. Even from a relatively simple perspective of available trucks, distances, and maintaining reserves, determining the most robust option is complex. 9
Figure 9: Time, distance and reserve levels must be coordinated across multiple fire stations
These kinds of situations will test the utility of applying collaborative decision spaces with synergistic joint actions even though there will be a single decision maker using an individual scoring model. Four main hypotheses could be tested in this way: 1. Those subjects receiving the decision space visualization will make more normatively correct decisions 2. Those subjects receiving the decision space visualization will be more confident in their decisions 3. Those subjects that receive the map information will make more normatively correct decisions than those who do not. 4. Across all conditions, decisions in the simple scenarios will be made quicker than decisions in more complex scenarios. Hypotheses 1 and 2 test the applicability of results of previous experiments that were conducted in less complex decision environments. Hypothesis 3 is based on the utility of having more and better situation space information in addition to the decision space. Hypothesis 4 also reflects results from previous research in less complex decision environments. Figure 10 illustrates an experimental design for this research.
Figure 10: Design for COAction Experiment 1
This is a fractional factorial design. Two levels of situation space support (with and without maps) can be tested between subjects. This can be crossed with two conditions of decision support (with and without decision spaces). Two level of forecast model fidelity can be tested between the groups of subjects within the decision space conditions. Finally, all subjects would receive simple and complex scenarios. 10
COAction Experiment 2 Building upon the results of Experiment 1, Experiment 2 can now introduce collaborative decision spaces based upon a super-ordinate scoring model to support inter-departmental decision making between two decision makers. Scenarios for decision making can be designed so that in some the most robust option for joint action will conflict with the most robust options in the individual decision spaces (as in the example illustrated in Figure 5). In other scenarios, the collaborative and individual decision spaces will agree. Three main hypotheses could be tested in this way: 1. Decisions will be most often correct if subjects see the collaborative decision space vs. only individual decision spaces vs. no decision space. This will be particularly true for conflicted scenarios. 2. Confidence will be highest in the collaborative decision space only condition 3. Discussion will be minimal in collaborative-only condition Hypothesis 1 is based on subjects receiving the most relevant information in the collaborative decision space conditions. Those without the collaborative decision spaces will need to construct collaborative options through discussion with their counterpart decision maker. In conflicted scenarios the impact of synergy will be less obvious to those without a collaborative decision space. Hypothesis 2 is based on previous work by the first author showing that alternative plausible conflicting analyses, regardless of their correctness, will interfere with confidence in the normatively correct analysis (Klein, 1981). Therefore, providing conflicting individual decision space analyses, even though the subjects will know the limits of these analyses, and even though the subjects may choose the recommendations of the collaborative decision space analysis, will reduce confidence in that choice. Hypothesis 3 is based on the same rationale as hypothesis 2: without conflicting analytic information, there will be less to discuss and discussion will focus on the comparing the option in the collaborative decision space. Figure 11 illustrates an experimental design for this research.
Both Decision Spaces
Only Individual Decision Space
Only Only Collaborative Situation Space Decision Space Figure 11: Design for COAction Experiment 2
This is a completely randomized 2 x 2 x 2 factorial design. Whether subjects receive individual decisions can be a between group manipulation. These conditions can be crossed with whether subjects receive a collaborative decision space visualization. Within all four conditions, subjects would receive both conflicted and unconflicted scenarios. All subjects would receive situation space information. In applicable conditions subjects would see each others’ decision spaces. In the collaborative decision space conditions, all subjects would see the same collaborative decision space. All subjects would be able to discuss the decision situation with their counterparts.
11
Summary Today collaborative decision making too often is focused on the situation space. The belief appears to be if we just had better situation awareness we could make better decisions. As the examples in this paper show, even with a high level of situation awareness and individual option awareness, the synergistic impact of joint action can be non-obvious. To address this issue, the current paper described the theoretical underpinnings for developing models to support collaborative decision spaces yielding collaborative option awareness. The goal is to enable more robust tactical collaborative decision making even under the most difficult conditions. The research experiments described will provide empirical data on whether collaborative decision spaces will yield collaborative option awareness that will result in more correct and confident collaborative decision making.
References Bankes, S. (1993). Exploratory modeling for policy analysis. Operations Research, Vol 41. No. 3 (May – June) pp. 435 – 449. Chandrasekaran, B. (2005). From optimal to robust COAs: challenges in providing integrated decision support for simulation-based COA planning. Laboratory for AI Research, The Ohio State University. Chandresekaran, B. & Goldman, M. (2007). Exploring robustness of plans for simulation-based course of action planning. Proceedings of the 2007 IEEE Symposium on Computational Intelligence in Multicriteria Decision Making Drury, J. L., Klein, G. L., Pfaff, M., and More, L. (2009). Dynamic decision support for emergency responders. Proc. of the 2009 IEEE Technologies for Homeland Security Conference, Waltham, MA Endsley, M.R. (2000). Theoretical underpinnings of situation awareness: a critical review, in M.R. Endsley & D.J. Garland (eds.), Situation Awareness Analysis and Measurement, Lawrence Erlbaum Assoc., Mahwah, New Jersey, pp. 3 – 32. Gigerenzer, G. & Hoffrage, U. (1995). How to improve bayesian reasoning without instruction: frequency formats, Psychological Review, 102 (4), 684-704, American Psychological Association. Hall, D. L., Hellar, B. and McNeese, M. (2007). Rethinking the data overload problem: Closing the gap between situation assessment and decision making, Proc. of the 2007 National Symposium on Sensor and Data Fusion (NSSDF) Military Sensing Symposia (MSS), McLean, VA. Hoffrage, U. and Gigerenzer, G. (1998). Using natural frequencies to improve diagnostic inferences. Academic Medicine, 73(5), 538 – 540. Klein, G.L. (1981). Heuristic influence on decision processes, A Dissertation in Psychology, Texas Tech University, Lubbock, TX Klein, G.L., & Adelman, L. (2005). A Collaboration Evaluation Framework, International Conference on Intelligence Analysis, McLean, VA
12
Klein, G.L., Adelman, L., Kott, A. (2008). Enabling decision making: realizing the potential of network enabled command, in A.Kott (ed.) Battle of Cognition, Praeger Security Intn’l, Westport , CN Klein, G.L., Pfaff, M., & Drury, J.L., (2009). Supporting a robust decision space, AAAI Spring Symposium on Technosocial Predictive Analytics, Stanford, CA Lempert, R. J., Popper, S. W., and Bankes, S. C. (2003). Shaping the next one hundred years: New methods for quantitative, long-term policy analysis. RAND MR-1626. Santa Monica, Calif.: The RAND Corporation. Mathieu, J.J., Pfaff, M, Klein, G.L., Drury, J.L., Goedecke, M., James, J.H., Mahoney, P.J., & Bobashev, G. (2010). Tactical Robust decision-making methodology: effect of disease spread model fidelity on option awareness, 7th International Conference on Information Systems for Crisis Response and Management, Seattle, WA Thompson, J.D. 1967. Organizations in action. NY: McGraw-Hill. Tukey, J. W. (1977). Exploratory Data Analysis. Reading, Mass: Addison-Wesley.
Author Information Dr. Gary L. Klein received his BA in Psychology from UCLA in 1974, and his PhD in cognitive social psychology from Texas Tech University in 1982. Dr. Klein’s work has focused on modeling how people acquire and use information. He co-developed a collaboration evaluation framework that has been applied to collaboration in intelligence, command and control, and air traffic flow management. Currently, he leads a number of projects on using simulation models to improve decision makers’ “option awareness” under deep uncertainty. He is the Senior Principal Scientist in cognitive science and artificial intelligence in the Command & Control Center at The MITRE Corporation. Dr. Jill Drury received a BA in Physics from Macalester College in 1980. She received MS degrees in Business Administration in 1986 and Computer Science in 1994, both from Boston University. A Doctor of Science (Sc.D) degree in Computer Science followed from the University of Massachusetts Lowell in 2002. Her research interests are in optimizing interactive technologies for team-based decision-making in safety-critical applications; particularly for work with real-time operations centers and command and control systems. She is Associate Department Head of the Collaboration and Multi-Media Department of The MITRE Corporation and an Adjunct Assistant Professor at the University of Massachusetts Lowell. Dr. Mark Pfaff received a Bachelor’s degree in visual arts from Pennsylvania State University in 1995, a master’s degree in multimedia technology from Dusquene University in 2001, and a Ph.D. in 2008 from the College of Information Sciences and Technology at the Pennsylvania State University. Dr. Pfaff is currently an Assistant Professor in the Indiana University School of Informatics (Indianapolis). His research explores the intersections of people, information, and technology in computer-supported cooperative work (CSCW) environments through the use of experimental simulations and mixed-methodological approaches. Mark is formerly an instructor in the Interactive Media department at Duquesne University where he taught multimedia development, Web design, human-computer interaction (HCI), and sound design. At Penn State 13
he managed the User Science and Engineering Lab at IST and was a research assistant for both the Multidisciplinary Initiatives in Naturalistic Decision Systems (MINDS) Group and the Center for Network-Centric Cognition and Information Fusion (NC2IF). Loretta More is a Project Assistant for the Center for Network-Centric Cognition and Information Fusion in the College of Information Sciences and Technology at the Pennsylvania State University. She has a Bachelors of Science degree in Information Sciences and Technology from the Pennsylvania State University and a Bachelors of Arts degree in Business Administration from Saint Leo University. Loretta’s research interest is in investigating decision aids to enhance support of emergency response decision making. Additionally, Loretta was a Signals Intelligence Analyst and Korean linguist in the Army and performed fusion analysis of intelligence during numerous XVIII Airborne Corps Warfighter exercises.
14