National Economic and Development Authority MIMAROPA Region 2015 MIMAROPA Regional Economic Situationer 2015 Gross Regional Domestic Product The region’s economy decelerated from 8.3 per cent in 2014 to 1.7 per cent in 2015. Unlike in 2014, the region missed its 2015 target in the updated regional development plan (RDP) which was set at a range of 4.2 per cent to 5.2 per cent. W ith 1.7 percent, the region is below its low target of 4.2 per cent. The AHFF sector accelerated from 2.3 per cent to 2.8 per cent in 2015. Agriculture and fishery managed to grow at a slower pace along with improved fishing. Agriculture and forestry slowed down from 4.0 per cent to 3.8 per cent. Industry contracted by 5.3 per cent in 2015, a reversal from its remarkable 17.1 p er cent growth in 2014. The 7.3 per cent slump in mining and quarrying, which accounted for 61.0 per cent of the sector’s output, pulled down industry’s overall growth. Services kept MIMAROPA’s economy afloat and remained to be the biggest contributor to the region’s economy with 43.7 per cent share in 2015, slightly higher than its 41.5 per cent share in 2014. The acceleration was brought about by the expansion in the following sub industries: other services, from 5.4 per cent to 12.9 per cent; transportation, storage and communication, from 7.1 per cent to 8.9 per cent; trade, from 2.9 per cent to 8.3 per cent. The growth in other services was mainly driven by influx of tourists in the region. A total of 1,422,580 tourist arrivals recorded in MIMAROPA for the year 2015. Consequently, tourist receipts were up to PhP1 4.9 billion, higher by 1 4.76 percent than a year ago. Other services such as health and education facilities, hotel and restaurants, recreational facilities, and other tourism related activitie s contributed significantly to the recorded increase in the service sector.
Table 1. GRDP Growth Rates by Industrial Origin, MIMAROPA , 2015 2013-2014 2.3 4.0 (2.6)
2014-2015 2.8 3.8 (0.5)
17.1 12.1 14.0 36.6 13.0
(5.3) (7.3) 0.2 (4.4) 13.4
III. Ser vice Sector a. Transportation, Stor age & Communicat ion b. Trade and Repair of Motor Vehicles, Motorcycles, Personal and Household Goods c. Financial Intermediation d. Real Estat e, Rent ing & Business Act ivities e. Public Adm inistration & Def ense; Compulsor y Social Securit y f . Other services
5.0 7.1 2.9
7.3 8.9 8.3
8.8 1.1 4.5
7.4 (0.3) 1.7
5.4
12.9
Gross Domest ic Product
8.3
1.7
I.
II.
Industr y AHFF a. Agriculture and Forestry b. Fishing Industr y Sector a. Mining and Quarr ying b. Manuf acturing c. Construction d. Electricit y, Gas, and W ater Supply
S ourc e : P hi l i p pi n e S ta tis t ic s A ut h or ity
Agriculture Agricultural production such as corn, cashew, calamansi, garlic and onion increased by 16.50 percent, 21.08 percent, 0.63 percent, 8.28 percent and 31.84 percent, respect ively, compared to last year. On the other hand, palay production slightly decreased by 0.001 percent. The decline in production of palay was attributed to the intense heat in Oriental Mindoro and Palawan that resulted to the minimal harvesting of palay. Some areas in Romblon were not also planted due to insufficient water supply.
Table 2. Volume of Production of Cereals, Livestock, Poultry and Fishery (in MT), MIMAROPA, 2014 -2015
Item
Percent Change (2015/2014)
2014
2015
1,081,878.00
1,081,833.00
107,723.00
125,492.00
163,821.57 83,746.15 1,794.50
198,360.18 84,279.40 1,943.04
21.08
13,333.94
17,579.28
31.84
Carabao Cattle
6,701 11,647
6,086 12,268
-9.18
Goat Swine
2,325 74,222
2,462 77,666
10,340 4,737
10,643 5,608
338 601
375 523
Commercial Marine Municipal
44,615.99 149,748.25
41,972.98 144,781.41
Inland Municipal
984.7
985.30
-5.92 -3.32 0.06
Aquaculture
366,708.41
400,537.76
9.23
Cereals (MT) Palay Corn Major Crops (MT) Cashew Calamansi Garlic Onion Livestock (MT)
-0.001 16.50
0.63 8.28
5.33 5.89 4.64
Poultry (MT) Chicken Chicken Eggs Duck Duck Eggs Fishery (MT)
2.93 18.39 10.95 -12.98
S ourc e : P hi l i p pi n e S ta tis t ic s A ut h or ity
Swine, cattle and goat production slightly increased to 77,666 MT, 12,268 MT and 2,462 MT in 2015 or an annual growth of 4.64 per cent, 5.33 per cent and 5.89 per cent, respectively. However, production of carabao decreased by 9.18 percent in 2015. Production of duck eggs registered decline by 12.98 per cent. Despite the decline, production of duck rose to 10.95 per cent compared to last year’s production. Chicken and chicken eggs production increased by 2.93 per cent and 18.39 per cent, respectively. Limited fish catch in commercial and marine municipal fisheries output across provinces was noted with 5.92 per cent and 3.32 per cent
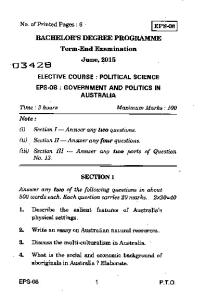
reduction, respectively. The decline in fishery production was due to rough seas brought about by northeast monsoon wind that resulted to less fishing days and less appearance of some species. On the other hand, inland municipal fishery production yielded a total of 985.30 MT in 2015 which was 0.06 per cent higher than the previous year. Agricultural fishery production also posted 9.23 per cent increase in 2015. P ALAY The MIMAROPA region recorded 6 per cent contribution to total national production. Oriental Mindoro recorded the highest production in the region contributing 36 per cent to the region’s total palay production.
Romblon 3% Palawan 26%
Marinduque 1% Occidental Mindoro 34%
Oriental Mindoro 36%
CASHEW Palawan recorded the highest production in the region contributing 99.90 per cent to the region’s total cashew production. Province MIMAROPA Marinduque Occidental Mindoro Oriental Mindoro Palawan Romblon
2015 198,360.18 0 188.85 3.21 198,168.12 0
CALAMANSI Oriental Mindoro recorded the highest production in the region contributing 98.67 per cent to the region’s total calamansi production. Province MIMAROPA Marinduque Occidental Mindoro Oriental Mindoro Palawan Romblon
2015 84,279.40 55.04 200.32 83,154.49 764.04 105.51
G ARLIC Occidental Mindoro recorded the highest production in the region contributing 89.50 per cent to the region’s total garlic production. Province MIMAROPA Marinduque Occidental Mindoro Oriental Mindoro Palawan Romblon
2015 1,943.04 17.17 1,739.00 60.61 0 22.25
ONION Occidental Mindoro recorded the highest production in the region contributing 94.29 per cent to the region’s total onion production. Province MIMAROPA Marinduque Occidental Mindoro Oriental Mindoro Palawan Romblon
2015 17,579.28 3.94 16,575.00 1,000.34 0 0
BANANA Oriental Mindoro recorded the highest production in the region contributing 75.21 per cent to the region’s total banana production. Province MIMAROPA Marinduque Occidental Mindoro Oriental Mindoro Palawan Romblon
2015 168,259.08 704.92 3,683.46 126,541.97 30,585.18 6,743.55
COCONUT Palawan recorded the highest production in the region contributing 50.35 per cent to the region’s total coconut production. Province MIMAROPA Marinduque Occidental Mindoro Oriental Mindoro Palawan Romblon
2015 863,314.95 83,898.94 12,851.41 108,076.93 434,705.80 223,781.87
Mining and Quarrying For the year 2015, production of metallic mining decreased while non metallic mining increased. The extracted sand and gravel in MIMAROPA in 2015 recorded a 27 percent drop compared to 2014 production. The quantity extracted in 2014 reached 463,422.15 cubi c meters with an amount of Php 22,271,711.90, compared to the 335,894.83 cubic meters with a value of PHP 31,984,166.00 for 2015. The quantity of sand and gravel extracted in the provinces Occidental and Oriental Mindoro decreased in 2015. On the other hand, the province of Romblon and Palawan increased its 2015 sand and gravel extraction. Palawan’s production is the highest in the same year. Limestone extraction in the province of Palawan increased by almost 500 per cent in 2015 at 748,500 metric tons c ompared to only 127,987 metric tons in 2014. The 2015 value of Php 505,227,099.98 is 434 percent higher than Php 94,606,710 in 2014. Production of nickel direct shipping ore and nickel content of ore decreased in 2015 while nickel mixed sulphide and nick el content of mixed sulphide increased. The quantity produced for nickel direct shipping ore in 2015 is 14.61 lesser than 2014 production and may be attributed to the shutdown of CMDC’s Sofronio Espanola mine project for five (5) months from July to Decem ber 2015 due to lower market price of nickel. 2015 production of nickel mixed sulphide increased by 6.45 percent with value of Php 11 billion. The number of ore export shipments in 2015 also slipped by 5 percent from 133 ore shipments in 2014 to 126 ore s hipments in 2015. In terms of volume, a total of 6,243,785 wet metric tons in 2015 against 6,736,079 wet metric tons in 2014, a difference of 492,294 wet metric tons. Overall, MIMAROPA Region is still the second largest nickel ore producer in the country f or 2015 next to CARAGA Region, considered as the nickel capital of the country.
Prices MIMAROPA recorded an average Consumer Price Index (CPI) of 144.8 in 2015, a 1.4 percent increase compared to the previous year. This indicates that the prices of consumer goods and services had slightly increases. Among the commodity groups, Food and Non -Alcoholic Beverages recorded the highest CPI of 161.6, followed by Alcoholic Beverages and Tobacco with 161.3. On the other hand, Communication registered the lowe st CPI of 90.0 among Non -Food commodities. Regional inflation rate registered significant decrease of 3.1 percentage points, from 4.5 percent in 2014 to 1.4 percent in 2015. The disinflation was brought about by the lowering price movement across all commodity groups. Relatively, the region’s average purchasing power of peso decreased by 0.01 percentage point, from 0.70 to 0.69. Table 3. Consumer Price Index, Inflation Rate and Purchasing Power of Peso, MIMAROPA, 2014 -2015 Item Average Consumer Price Index Food Food and Non-Alcoholic Beverages Alcoholic Beverages and Tobacco Non-Food Clothing and Footwear Housing, Water, Electricity, Gas and Other Fuels Furnishing, Household Equipment and Routine Maintenance Health Transport Communication Recreation and Culture Education Restaurant and Miscellaneous Goods and Services Average Inflation Rate Average Purchasing Power of Peso Source: Philippine Statistics Authority
2014
2015
142.8 159.2
144.8 163.4
Percent Change/ Difference (2015/2014) 1.4 2.6
157.4
161.6
2.7
158.8
161.3
1.6
128.5 133.6
128.4 137.2
-0.1 2.7
134.4
132.4
-1.5
129.2
131.0
1.4
128.0 124.5 90.0 107.7 134.8
128.8 122.0 90.0 108.6 140.0
0.6 -2.0 0 0.8 3.9
126.7
129.7
2.4
4.5 0.70
1.4 0.69
-3.1 -0.01
The year 2015 showed disinflation signifying a slowdown in the rate of price increases of all goods and services. The monthly inflation rate of the region were considerably lower than those for the same period of 2014. Moreover, the monthly purchasing po wer of peso (PPP) in MIMAROPA was lower compared to last year. W hile the CPI slowed down and the monthly inflation rate was generally on the downward trend, the PPP remained stable at Php 0.69 all throughout the year. Figure 1. Inf lation Rate, MI MAROPA, 2014-2015
6.0 4.0 2.0 0.0 -2.0
Jan
Feb
Mar
Apr
May
June
July
Aug
Sep
Oct
Nov
Dec
2014
Jan 3.6
Feb 3.6
Mar 4.0
Apr 4.4
May 4.8
June 4.9
July 5.3
Aug 5.5
Sep 4.9
Oct 4.6
Nov 4.5
Dec 3.8
2015
3.2
3.0
2.8
2.5
1.7
1.3
0.7
0.3
0.1
-0.1
0.3
0.6
Source: Philippine Statistics Authority
Figure 2. Purchasing Power of Peso, MI MAROPA, 2014-2015 0.71 0.70 0.69 0.68 Jan
Feb
Mar
Apr
May
June
July
Aug
Sep
Oct
Nov
Dec
2014
Jan 0.71
Feb 0.71
Mar 0.71
Apr 0.71
May 0.71
June 0.70
July 0.70
Aug 0.69
Sep 0.69
Oct 0.69
Nov 0.69
Dec 0.69
2015
0.69
0.69
0.69
0.69
0.69
0.69
0.69
0.69
0.69
0.69
0.69
0.69
Source: Philippine Statistics Authority
Labor and Employment In 2015, the region’s working age population grew at a rate of 2.4 per cent from the previous year. On the other hand, the labor force participation rate decreased by 1.7 percentage points from 67.2 per cent in 2014 to 65.5 per cent this year. The employment rate was estimated at 96.7 per cent which registered slight increase of 1.3 pe rcentage points from 95.4 per cent in 2014. Unemployment rate decreased by 1.3 percentage points compared to the previous year’s rate of 4.6 per cent. Moreover, slight increase in underemployment was recorded at 0.4 percentage point. The change in underemp loyment was attributed to the increasing number of employed persons who express ed desire to have additional hours of work in present job or to have additional job. Table 4. Labor and Employment Statistics , MIMAROPA, 2014 -2015
Item
Population 15 years & above (in '000) LF Participation Rate Employment Rate Unemployment Rate Underemployment Rate Source: Philippine Statistics Authority 4-B
2015
1,998 67.2 95.4 4.6 20.4
2014
2,045 65.5 96.7 3.3 20.8
Percent Change/ Difference (2015/2014) 2.4 -1.7 1.3 -1.3 0.4