November 2010 • No.
350
401(k) Plan Asset Allocation, Account Balances, and Loan Activity in 2009 By Jack VanDerhei, EBRI; Sarah Holden, ICI; and Luis Alonso, EBRI E X E C U T I V E
S U M M A R Y
CONSISTENT SAMPLE: Because 401(k) balances can fluctuate with market returns from year to year, meaningful
analysis of 401(k) plans must examine how participants’ accounts have performed over the long term. Looking at consistent participants in the EBRI/ICI 401(k) database over the six-year period from 2003 to 2009 (which included one of the worst bear markets for stocks since the Great Depression), the study found:
After rising in 2003 and for the next four consecutive years, the average 401(k) retirement account fell 27.8 percent in 2008, before rising 31.9 percent in 2009.
The average 401(k) account balance moved up and down with stock market performance, but over the entire sixyear time period increased at an average annual growth rate of 10.5 percent, attaining $109,723 at year-end 2009.
The median (or midpoint, half above and half below) 401(k) account balance increased at an average annual growth rate of 14.7 percent over the 2003–2009 period to $59,381 at year-end 2009.
THE BULK OF 401(K) ASSETS CONTINUED TO BE INVESTED IN STOCKS: On average, at year-end 2009, 60 percent of 401(k) participants’ assets were invested in equity securities through equity funds, the equity portion of balanced funds, and company stock. Thirty-six percent was in fixed-income securities such as stable-value investments and bond and money funds. MORE THAN THREE-QUARTERS OF 401(K) PLANS INCLUDED TARGET-DATE FUNDS IN THEIR INVESTMENT LINEUP AT YEAR-END 2009: At year-end 2009, nearly 10 percent of the assets in the EBRI/ICI 401(k) database was invested in target-date funds and 33 percent of 401(k) participants held target-date funds. Also known as lifecycle funds, they are designed to simplify investing and to automate account rebalancing. NEW EMPLOYEES CONTINUED TO USE BALANCED FUNDS, INCLUDING TARGET-DATE FUNDS: Across all but the oldest
age group, more new or recent hires invested their 401(k) assets in balanced funds, including target-date funds. At year-end 2009, about 42 percent of the account balances of recently hired participants in their 20s were invested in balanced funds, compared with 36 percent in 2008, and about 7 percent in 1998. At year-end 2009, 31 percent of the account balances of recently hired participants in their 20s was invested in lifecycle funds, compared with almost 23 percent at year-end 2008. 401(K) PARTICIPANTS CONTINUED TO SEEK DIVERSIFICATION OF THEIR INVESTMENTS: The share of 401(k)
accounts invested in company stock continued to shrink, falling by half of a percentage point (to 9.2 percent) in 2009. That continued a steady decline that started in 1999. Recently hired 401(k) participants contributed to this trend: They tended to be less likely to hold employer stock. PARTICIPANTS’ 401(K) LOAN ACTIVITY ROSE IN 2009: In 2009, 21 percent of all 401(k) participants eligible for loans
had a loan outstanding against their 401(k) account, compared with 18 percent at year-end 2008 and year-end 2007. Loans outstanding amounted to 15 percent of the remaining account balance, on average, at year-end 2009, compared with16 percent at year-end 2008. Loan amounts remained in line with the past few years in terms of typical dollar amounts. A research report from the EBRI Education and Research Fund © 2010 Employee Benefit Research Institute
Jack VanDerhei is director of research at the Employee Benefit Research Institute (EBRI). Sarah Holden is senior director of retirement and investor research at the Investment Company Institute. Luis Alonso is director of information technology and research databases at EBRI. Special thanks to Ashley Reives, EBRI, who helped prepare the figures. This Issue Brief was written with assistance from the Institute’s research and editorial staffs. Any views expressed in this report are those of the authors, and should not be ascribed to the officers, trustees, or other sponsors of EBRI, EBRI-ERF, or their staffs. Neither EBRI nor EBRI-ERF lobbies or takes positions on specific policy proposals. EBRI invites comment on this research.
Copyright Information: This report is copyrighted by the Employee Benefit Research Institute (EBRI). It may be used without permission but citation of the source is required.
Recommended Citation: Jack VanDerhei, Sarah Holden, and Luis Alonso, “401(k) Plan Asset Allocation, Account Balances, and Loan Activity in 2009,” EBRI Issue Brief, no. 350, and ICI Perspective, Vol. 16, no. 3, November 2010. Report availability: This report is available on the Internet at www.ebri.org and at www.ici.org This report is being published simultaneously as an EBRI Issue Brief and ICI Perspective and is available on both organizations’ websites at www.ebri.org/publications/ib and www.ici.org/research/perspective
Table of Contents Introduction ..................................................................................................................................................................... 5 EBRI/ICI 401(k) Database ................................................................................................................................................. 5 Sources and Type of Data ............................................................................................................................................. 5 Investment Options ...................................................................................................................................................... 5 About the EBRI/ICI 401(k) Database .................................................................................................................................. 6 Distribution of Plans, Participants, and Assets by Plan Size .............................................................................................. 6 Relationship of EBRI/ICI 401(k) Database Plans to the Universe of All 401(k) Plans .......................................................... 6 The Typical 401(k) Plan Participant ................................................................................................................................ 6 Changes in 401(k) Participants’ Account Balances ............................................................................................................... 6 Comparison of Consistent Group of 401(k) Participants to EBRI/ICI 401(k) Database ..................................................... 10 Factors That Affect 401(k) Participants’ Account Balances ............................................................................................. 10 Year-End 2009 Snapshot of 401(k) Participants’ Account Balances ..................................................................................... 13 Definition of 401(k) Account Balance ........................................................................................................................... 13 Size of 401(k) Account Balances .................................................................................................................................. 15 Relationship of Age and Tenure to Account Balances .................................................................................................... 15 Relationship Between Account Balances and Salary ...................................................................................................... 15 Year-End 2009 Snapshot of 401(k) Asset Allocation .......................................................................................................... 20 Changes in Asset Allocation Between Year-End 2008 and Year-End 2009 ....................................................................... 20 Asset Allocation and Participant Age ............................................................................................................................ 24 Asset Allocation and Investment Options...................................................................................................................... 24 Asset Allocation by Investment Options and Age, Salary, and Plan Size .......................................................................... 26 Distribution of Equity Fund Allocations and Participant Exposure to Equities ................................................................... 26 Distribution of Participants’ Balanced Fund Allocations by Age ....................................................................................... 26 Distribution of Participants’ Company Stock Allocations by Age ...................................................................................... 31 Asset Allocation of Recently Hired Participants .............................................................................................................. 31 Year-End 2009 Snapshot of 401(k) Plan Loan Activity........................................................................................................ 34 Availability and Use of 401(k) Plan Loans by Plan Size .................................................................................................. 34 401(k) Plan Loan Activity Varies with Participant Age, Tenure, Account Balance, and Salary ............................................ 34 Average Loan Balances ............................................................................................................................................... 34
ebri.org Issue Brief • November 2010 • No. 350
2
Appendix ........................................................................................................................................................................ 49 Comparison of 2003–2009 Consistent Group of 401(k) Participants to EBRI/ICI 401(k) Database .................................... 49 Analysis of the 1999–2009 Consistent Group ................................................................................................................ 49 Participants’ Ages, Tenures, and Account Balances in the 1999–2009 Consistent Group ............................................ 49 Changes in Participants’ Account Balances in the 1999–2009 Consistent Group ......................................................... 49 References ..................................................................................................................................................................... 59 Endnotes ........................................................................................................................................................................ 62
Figures Figure 1, 401(k) Plan Characteristics, by Number of Plan Participants, 2009 ......................................................................... 7 Figure 2, 401(k) Plan Characteristics, by Plan Assets, 2009 .................................................................................................. 7 Figure 3, EBRI/ICI 401(k) Database Represents Wide Cross-Section of 401(k) Universe ........................................................ 8 Figure 4, More Than One-Third of 401(k) Participants Are in Their 20s or 30s or Have Short Job Tenure ................................ 9 Figure 5, 401(k) Account Balances Among 401(k) Participants Present From Year-End 2003 Through Year-End 2009 .............11 Figure 6, Average Account Balances Among 401(k) Participants Present From Year-End 2003 Through Year-End 2009, by Participant Age and Tenure ...................................................................................................................................12 Figure 7, Percent Change in Average Account Balances Among 401(k) Participants Present From Year-End 2003 Through Year-End 2009, by Participant Age and Tenure ........................................................................................................11 Figure 8, Domestic Stock and Bond Market Indexes ...........................................................................................................14 Figure 9, Snapshot of Year-End Account Balances ..............................................................................................................16 Figure 10, Distribution of 401(k) Account Balances, by Size of Account Balance ...................................................................17 Figure 11, Age Composition of Selected 401(k) Account Balance Categories ........................................................................17 Figure 12, Tenure Composition of Selected 401(k) Account Balance Categories ...................................................................18 Figure 13, Account Balances Increase With Age and Tenure ...............................................................................................18 Figure 14, 401(k) Account Balances Less Than $10,000, by Participant Age and Tenure .......................................................19 Figure 15, 401(k) Account Balances Greater Than $100,000, by Participant Age and Tenure ................................................19 Figure 16, Median Account Balance Among Long-Tenured Participants, by Age and Salary, 2009 ..........................................21 Figure 17, Ratio of 401(k) Account Balance to Salary, by Age and Tenure ...........................................................................21 Figure 18, Ratio of 401(k) Account Balance to Salary for Participants in Their 20s, by Tenure ...............................................22 Figure 19, Ratio of 401(k) Account Balance to Salary for Participants in Their 60s, by Tenure ...............................................22 Figure 20, Asset Allocation of 401(k) Participants ...............................................................................................................23 Figure 21, Average Asset Allocation of 401(k) Accounts, by Participant Age .........................................................................25 Figure 22, Distribution of 401(k) Plans, Participants, and Assets, by Investment Options, 2009 .............................................25 Figure 23, Average Asset Allocation of Accounts, by Participant Age and Investment Options ...............................................27 Figure 24, Average Asset Allocation of 401(k) Accounts, by Participant Salary and Investment Options .................................28 Figure 25, Average Asset Allocation of 401(k) Accounts, by Plan Size and Investment Options..............................................29 Figure 26, Asset Allocation Distribution of 401(k) Account Balances to Equity Funds, by Participant Age ................................30 Figure 27, Asset Allocation Distribution of 401(k) Participant Account Balance to Equity Funds, by Participant Age, Tenure, or Salary ...................................................................................................................................................................32 Figure 28, Percentage of 401(k) Plan Participants Without Equity Fund Balances Who Have Equity Exposure, by Participant Age and Tenure, 2009 ...............................................................................................................................................32 Figure 29, Average Asset Allocation for 401(k) Plan Participants Without Equity Fund Balances, by Participant Age or Tenure .................................................................................................................................................................33 Figure 30, Asset Allocation to Equities Varied Widely Among Participants.............................................................................36 Figure 31, Asset Allocation Distribution of 401(k) Participant Account Balance to Balanced Funds, by Age .............................36
ebri.org Issue Brief • November 2010 • No. 350
3
Figure 32, Asset Allocation Distribution of 401(k) Participant Account Balance to Balanced Funds, by Tenure ........................37 Figure 33, Asset Allocation Distribution of Participant Account Balance to Company Stock in 401(k) Plans With Company Stock, by Age ............................................................................................................................................................38 Figure 34, More Recently Hired 401(k) Plan Participants Hold Balanced Funds .....................................................................38 Figure 35, Many Recently Hired 401(k) Plan Participants Hold Target-date Funds.................................................................38 Figure 36, Recently Hired 401(k) Participants Now Hold Higher Concentrations in Balanced Funds ........................................39 Figure 37, Many Recently Hired Participants Hold High Concentrations in Target-date Funds ................................................40 Figure 38, Asset Allocation Distribution of Account Balance to Balanced Funds Among Recently Hired 401(k) Participants, by Age ......................................................................................................................................................................41 Figure 39, Average Asset Allocation of 401(k) Accounts by Participant Age and Investment Options Among Participants With Two or Fewer Years of Tenure ...........................................................................................................................42 Figure 40, Recently Hired 401(k) Plan Participants Are Less Likely to Hold Company Stock ...................................................43 Figure 41, New Participants Tend Not to Hold High Concentrations in Company Stock ..........................................................43 Figure 42, Asset Allocation Distribution of Recently Hired Participant Account Balance to Company Stock in 401(k) Plans With Company Stock, by Participant Age.....................................................................................................................43 Figure 43, Percentage of 401(k) Plans Offering Loans, by Plan Size, 2009 ...........................................................................44 Figure 44, Percentage of Eligible 401(k) Plan Participants With 401(k) Plan Loans, by Plan Size, 2009...................................44 Figure 45, Loan Balances as a Percentage of 401(k) Account Balances for Participants With 401(k) Plan Loans, by Plan Size, 2009 .................................................................................................................................................................45 Figure 46, Few 401(k) Participants Had Outstanding 401(k) Loans; Loans Tended to be Small, 1996–2009 ...........................45 Figure 47, Percentage of Eligible Participants With 401(k) Loans, by Participant Age, Tenure, Account Size, or Salary, Selected Years ..........................................................................................................................................................46 Figure 48, 401(k) Loan Balances .......................................................................................................................................47 Figure 49, Loan Balances as a Percentage of 401(k) Account Balances for Participants With Loans, by Participant Age, Tenure, Account Size, or Salary, Selected Years ..........................................................................................................48 Figure 50, Loans From 401(k) Plans Tended to Be Small ....................................................................................................48 Figure A1, Age Distribution of 2003–2009 Consistent Group ...............................................................................................51 Figure A2, Tenure Distribution of 2003–2009 Consistent Group...........................................................................................51 Figure A3, Distribution of 401(k) Account Balances, by Size of Account Balance ...................................................................52 Figure A4, Average Asset Allocation of 401(k) Accounts of 2003–2009 Consistent Group, by Participant Age .........................52 Figure A5, Asset Allocation to Equities Varied Widely Among Participants in the 2003–2009 Consistent Group .......................53 Figure A6, 1999–2009 Consistent Group Was Older Than All Participants in EBRI/ICI 401(k) Database at Year-End 2009 .......54 Figure A7, 1999–2009 Consistent Group Had Longer Tenure Than All Participants in EBRI/ICI 401(k) Database at Year-End 2009.........................................................................................................................................................................54 Figure A8, 401(k) Account Balances Among 401(k) Participants Present From Year-End 1999 Through Year-End 2009 ..........55 Figure A9, Average Account Balances Among 401(k) Participants Present From Year-End 1999 Through Year-End 2009, by Age and Tenure ....................................................................................................................................................56 Figure A10, Percent Change in Average Account Balances Among 401(k) Participants Present From Year-End 1999 Through Year-End 2009, by Age and Tenure ............................................................................................................................56 Figure A11, Average Asset Allocation of 401(k) Accounts of 1999–2009 Consistent Group, by Participant Age .......................57 Figure A12, Asset Allocation to Equities Varied Widely Among Participants in the 1999–2009 Consistent Group .....................57 Figure A13, Changes in Consistent Participants' Investment in Equity Funds, 2008–2009......................................................58 Figure A14, Changes in Consistent Participants' Investment in Bond Funds, 2008–2009 .......................................................58
ebri.org Issue Brief • November 2010 • No. 350
4
Introduction Over the past two decades, 401(k) plans have grown to be the most widespread private-sector employer-sponsored retirement plan in the United States1 and now serve as the most popular defined contribution (DC) plan, representing the largest number of participants and assets. In 2009, 49.0 million American workers were active 401(k) plan participants.2 By year-end 2009, 401(k) plan assets had grown to represent 17 percent of all retirement assets, amounting to $2.8 trillion.3 In an ongoing collaborative effort, the Employee Benefit Research Institute (EBRI)4 and the Investment Company Institute (ICI)5 collect annual data on millions of 401(k) plan participants as a means to accurately portray how these participants manage their accounts. This report is an update of EBRI and ICI’s ongoing research into 401(k) plan participants’ activity through year-end 2009.6 The report is divided into five sections: The first describes the EBRI/ICI 401(k) database; the second focuses on changes in participant account balances over time, analyzing a group of consistent 401(k) participants; the third presents a snapshot of participant account balances at year-end 2009; the fourth looks at participants’ asset allocations, including analysis of 401(k) participants’ use of target-date funds (also called “lifecycle” funds); and the fifth focuses on participants’ 401(k) loan activity.
EBRI/ICI 401(k) Database Sources and Type of Data Several recordkeeping organizations provided records on active participants in 401(k) plans at year-end 2009. These plan recordkeepers include mutual fund companies, insurance companies, and consulting firms. Although the EBRI/ICI project has collected data from 1996 through 2009, the universe of data providers varies from year to year. In addition, the sample of plans at any given provider can change. Thus, aggregate figures in this report generally should not be used to estimate time trends, unless otherwise indicated. Records were encrypted prior to inclusion in the database to conceal the identity of employers and employees, but were coded so that both could be tracked by researchers over multiple years.7 Data provided for each participant include date of birth, from which an age group is assigned; date of hire, from which a tenure range is assigned; outstanding loan balance; funds in the participant’s investment portfolios; and asset values attributed to those funds. An account balance for each participant is the sum of the participant’s assets in all funds.8 Plan balances are constructed as the sum of all participant balances in the plan. Plan size is estimated as the sum of active participants in the plan and, as such, does not necessarily represent the total number of employees at the sponsoring firm. A new feature in the year-end 2009 database is the ability to link individuals across plans and across recordkeepers. This improved the identification of active participants and resulted in the reclassification of nearly 1.5 million participant accounts that were multiple accounts owned by single individuals. This procedure also allowed EBRI and ICI to begin to consolidate account balances for individuals across data providers to provide a more accurate estimate of average account balances per individual.9
Investment Options Investment options are grouped into eight broad categories.10 Equity funds consist of pooled investments primarily invested in stocks; these funds include equity mutual funds, bank collective trusts, life insurance separate accounts, and other pooled investments. Similarly, bond funds are any pooled account primarily invested in bonds. Balanced funds are pooled accounts invested in both stocks and bonds. They are classified into two subcategories: target-date funds and non-target-date balanced funds. A target-date fund pursues a long-term investment strategy, using a mix of asset classes, or asset allocation, that the fund provider adjusts to become less focused on growth and more focused on income over time.11 Non-target-date balanced funds include asset allocation or hybrid funds, in addition to target-date funds.12 Company stock is equity in the plan’s sponsor (the employer). Money funds consist of those funds designed to maintain a stable share price. Stable value products, such as guaranteed investment contracts (GICs)13 and other stable value funds,14 are reported as one category. The other category is the residual for other investments, such as real estate funds. The final category, unknown, consists of funds that could not be identified.15
ebri.org Issue Brief • November 2010 • No. 350
5
About the EBRI/ICI 401(k) Database The EBRI/ICI Participant-Directed Retirement Plan Data Collection Project is the largest, most representative repository of information about individual 401(k) plan participant accounts. As of December 31, 2009, the database included statistical information about: 20.7 million 401(k) plan participants, in 51,852 employer-sponsored 401(k) plans, holding $1.210 trillion in assets. The 2009 database covered 42 percent of the universe of active 401(k) plan participants, 10 percent of plans, and 44 percent of 401(k) plan assets. The EBRI/ICI project is unique because it includes data provided by a wide variety of plan recordkeepers and, therefore, portrays the activity of participants in 401(k) plans of varying sizes—from very large corporations to small businesses—with a variety of investment options.
Distribution of Plans, Participants, and Assets by Plan Size The 2009 EBRI/ICI 401(k) database contains information on 51,852 401(k) plans with $1.210 trillion in assets and 20.7 million participants (Figure 1). Most of the plans in the database are small: 44 percent of the plans have 25 or fewer participants, and 30 percent have 26 to 100 participants. In contrast, only 5 percent of the plans have more than 1,000 participants. However, participants and assets are concentrated in large plans. For example, 79 percent of participants are in plans with more than 1,000 participants, and these same plans account for 83 percent of all plan assets. Because most of the plans have a small number of participants, the asset size for many plans is modest. About 19 percent of the plans have assets of $250,000 or less, and another 31 percent have plan assets between $250,001 and $1,250,000 (Figure 2).
Relationship of EBRI/ICI 401(k) Database Plans to the Universe of All 401(k) Plans The 2009 EBRI/ICI 401(k) database is a representative sample of the estimated universe of 401(k) plans. At year-end 2009, all 401(k) plans held a total of $2.8 trillion in assets, and the database represents about 44 percent of that total.16 The database also covers 42 percent of the universe of active 401(k) plan participants and 10 percent of all 401(k) plans.17 The distribution of assets, participants, and plans in the database for 2009 is similar to that reported for the universe of plans as estimated by Cerulli Associates (Figure 3).
The Typical 401(k) Plan Participant The database includes 401(k) participants across a wide range of age and tenure. Fifty-three percent of participants were in their 30s or 40s, while 13 percent of participants were in their 20s and 9 percent were in their 60s (Figure 4). The median age of the participants in the 2009 database is 45 years, one year older than in 2008. In 2009, 38 percent of the participants had five or fewer years of tenure and 6 percent had more than 30 years of tenure. The median tenure at the current employer was six years in 2009, compared with seven years in 2008. The tenure composition in the year-end 2009 database is similar to the tenure composition of the year-end 2008 database, but the tenure distribution of 2007, 2008, and 2009 shows an increase in lower-tenured participants compared with 2006 and earlier. Although the database does not contain information on automatic enrollment, it is likely that automatic enrollment is playing a role in bringing in newly hired workers, which lowers the average tenure.18
Changes in 401(k) Participants’ Account Balances As a cross-section, or snapshot, of the entire population of 401(k) plan participants, the database includes 401(k) participants who are young and individuals who are new to their jobs, as well as older participants and those who have
ebri.org Issue Brief • November 2010 • No. 350
6
Figure 1 401(k) Plan Characteristics, by Number of Plan Participants, 2009 Number of Plan Participants 1–10
Total Plans
Total Participants
Total Assets
Average Account Balance
11,410
63,199
$3,450,224,322
$54,593
11–25
11,518
197,472
$10,195,105,081
$51,628
26–50
8,717
316,512
$15,894,079,012
$50,216
51–100
6,840
485,134
$24,151,482,187
$49,783
101–250
6,004
955,964
$45,979,081,708
$48,097
251–500
2,832
998,267
$47,263,774,919
$47,346
501–1,000
1,839
1,303,936
$63,301,430,136
$48,546
1,001–2,500
1,394
2,182,496
$112,210,922,205
$51,414
2,501–5,000
640
2,234,030
$122,068,002,953
$54,640
5,001–10,000
327
2,268,966
$150,408,723,529
$66,290
>10,000
331
9,737,755
$615,491,992,885
$63,207
51,852
20,743,731
$1,210,414,818,938
$58,351
All
Source: Tabulations from EBRI/ICI Participant-Directed Retirement Plan Data Collection Project. Note: The median account balance at year-end 2009 was $17,794.
Figure 2 401(k) Plan Characteristics, by Plan Assets, 2009 Total Plan Assets
Total Plans
Total Participants
Total Assets
$0–$250,000
9,597
86,045
$1,019,080,598
$11,844
>$250,000–$625,000
8,161
151,990
$3,452,162,443
$22,713
>$625,000–$1,250,000
7,879
242,060
$7,121,180,347
$29,419
>$1,250,000–$2,500,000
7,694
414,735
$13,741,687,164
$33,134
>$2,500,000–$6,250,000
7,737
800,721
$30,796,702,552
$38,461
>$6,250,000–$12,500,000
3,961
866,833
$34,703,285,828
$40,035
>$12,500,000–$25,000,000
2,652
1,116,783
$46,415,289,211
$41,562
>$25,000,000–$62,500,000
2,007
1,819,271
$78,805,522,642
$43,317
>$62,500,000–$125,000,000
883
1,669,553
$76,732,201,388
$45,960
>$125,000,000–$250,000,000
544
1,838,633
$95,265,460,247
$51,813
737
11,737,107
$822,362,246,519
$70,065
51,852
20,743,731
$1,210,414,818,938
$58,351
>$250,000,000 All
Average Account Balance
Source: Tabulations from EBRI/ICI Participant-Directed Retirement Plan Data Collection Project. Note: The median account balance at year-end 2009 was $17,794.
ebri.org Issue Brief • November 2010 • No. 350
7
Figure 3 EBRI/ICI 401(k) Database Represents Wide Cross-Section of 401(k) Universe 401(k) plan characteristics by number of participants: EBRI/ICI 401(k) database vs. Cerulli estimates for all 401(k) plans, 2009 Plan Assets (percentage of Assets) 100 80 60
EBRI/ICI
40 Cerulli 20 0 <100 participants
100–500
501–1,000
1,001–5,000
>5,000
Participants (percentage of Participants) 100 80 60
EBRI/ICI
40 Cerulli 20 0 <100 participants
100–500
501–1,000
1,001–5,000
>5,000
501–1,000
1,001–5,000
>5,000
Plans (percentage of Plans) 100 Cerulli
80 60 40
EBRI/ICI
20 0 <100 participants
100–500
Sources: Tabulations from EBRI/ICI Participant-Directed Retirement Plan Data Collection Project, Cerulli Associates.
ebri.org Issue Brief • November 2010 • No. 350
8
Figure 4 40(k) Participants 401(k) ParticipantsRepresent RepresentAARange RangeOf Ofges Ages And And Job Tenures Job Tenures Percentage of 401(k) plan participants by age or tenure, 2009
By Age Group (Median Age: 45 Years) 60s 20s 9%
13%
50s 25%
24%
30s
29%
40s
By Tenure (Median Tenure: 6 Years) >30 Years >20–30 Years
6% 16%
11%
>10–20 Years
0–2 Years
>2–5 Years
23%
22%
23%
>5–10 Years
Source: Tabulations from EBRI/ICI Participant-Directed Retirement Plan Data Collection Project. Note: Components may not add to 100 percent because of rounding. The tenure variable is generally years working at current employer, and thus may overstate years of participation in the 401(k) plan.
ebri.org Issue Brief • November 2010 • No. 350
9
been with their current employers for many years. These annual updates of the database provide snapshots of 401(k) account balances, asset allocation, and loan activity across wide cross-sections of participants. However, the crosssectional analysis is not well suited to addressing the question of the impact of participation in 401(k) plans over time. Cross-sections change in composition over time because the selection of data providers and sample of plans using a given provider vary from year to year and because 401(k) participants join or leave plans.19 In addition, the database contains only the account balances held in the 401(k) plans at participants’ current employers. Retirement savings held in plans at previous employers or rolled over into individual retirement accounts (IRAs) are not included in the analysis.20, 21 To explore the questions of the impact of ongoing participation in 401(k) plans and to understand how typical 401(k) plan participants have fared over a given time period, it is important to analyze a group of consistent participants (a longitudinal sample). This consistent group of participants is drawn from the annual cross-sections. This report analyzes two different consistent groups drawn from the database: (1) a group of 4.3 million participants with account balances at the end of each year at least from year-end 2003 through year-end 2009, and (2) a consistent group of 1.6 million participants with accounts at the end of each year at least from year-end 1999 through year-end 2009. The “2003– 2009 consistent group” is introduced because the tenure of the “1999–2009 consistent group” has grown longer, and the age composition has gotten significantly older compared with the cross-sectional snapshots of participants.22 The results from the 1999–2009 consistent group are presented in the appendix of this report.
Comparison of Consistent Group of 401(k) Participants to EBRI/ICI 401(k) Database About 3 in 10, or 4.3 million, of the 401(k) participants with accounts at the end of 2003 in the EBRI/ICI 401(k) database had accounts at the end of each year from 2003 through 2009.23 These 4.3 million 401(k) participants make up a group of consistent participants (or a longitudinal sample), which removes the effect of participants and plans entering and leaving the database. This group is similar with respect to age and tenure composition to the entire database at year-end 2003. By year-end 2009, these participants had a minimum tenure of six years and were slightly older in age composition when compared with the year-end 2009 cross-sectional database.24 In addition, the 2003– 2009 consistent group’s account balances tended to be higher compared with account balances in the cross-sectional database at year-end 2009. Nevertheless, with respect to average asset allocation at year-end 2009, the 2003–2009 consistent group had similar asset allocation by participant age as participants in the entire year-end 2009 database.25 Reflecting their higher average age and tenure, the 2003–2009 consistent group also had median and average account balances that were much higher than the median and average account balances of the broader database (Figure 5). At year-end 2009, the average 401(k) account balance of the consistent group was $109,723, almost double the average account balance of $58,351 among participants in the entire database. The median 401(k) account balance among the consistent participants was $59,381 at year-end 2009, nearly three-and-one-half times the median account balance of $17,794 among participants in the entire database.26 401(k) account balances varied with both age and tenure among the consistent group of participants, as they do in the cross-sectional database. Younger participants or those with shorter job tenure tended to have smaller account balances, while those who were older or had longer job tenure tended to have higher account balances. For example, within the consistent group, participants in their 20s at year-end 2009 had an average account balance of $24,462, compared with an average of $144,004 for participants in their 60s (Figure 6).
Factors That Affect 401(k) Participants’ Account Balances In any given year, the change in a participant’s account balance is the sum of three factors: New contributions by the participant or the employer or both; Total investment return on account balances, which depends on the performance of financial markets and on the allocation of assets in an individual’s account; and Withdrawals, borrowing, and loan repayments.
ebri.org Issue Brief • November 2010 • No. 350
10
Figure 5 401(k) Account Balancesa Among 401(k) Participants Present From Year-End 2003 Through Year-End 2009b
$140,000
Average
$120,000
$115,257 $109,723 $99,644
$100,000 $83,161
$82,768 $80,000
$72,173 $60,144
$60,000
$40,000
$20,000
$0
2003
2004
2005
2006
2007
2008
2009
$70,000 $60,858
Median (mid-point)
$60,000
$59,381
$51,712
$50,000
$46,338 $41,233
$40,000 $34,037 $30,000
$26,098
$20,000
$10,000
$0
2003
2004
2005
2006
2007
2008
2009
Source: Tabulations from EBRI/ICI Participant-Directed Retirement Plan Data Collection Project. a Account balances are participant account balances held in 401(k) plans at the participants' current employers and are net of plan loans. Retirement savings held in plans at previous employers or rolled over into IRAs are not included. b The analysis is based on a sample of 4.3 million participants with account balances at the end of each year from 2003 through 2009.
ebri.org Issue Brief • November 2010 • No. 350
11
Figure 6 Average Account Balances Among 401(k) Participants Present From a b Year-End 2003 Through Year-End 2009, by Participant Age and Tenure b
Age Group
b
Tenure (years)
2004 $6,864
2005 $10,560
2006 $15,367
2007 $20,371
2008 $15,598
2009 $24,462
$3,426
$6,845
$10,686
$15,646
$20,836
$16,231
$25,106
$17,662 $12,292 $24,369
$24,712 $19,146 $31,749
$31,789 $26,262 $38,859
$41,791 $35,771 $49,558
$51,619 $45,274 $59,904
$36,842 $32,772 $42,388
$54,167 $49,458 $60,422
$45,200 $19,808 $44,740 $80,015
$56,402 $29,200 $55,572 $94,757
$66,814 $38,613 $65,760 $107,253
$82,748 $51,191 $81,347 $128,751
$97,805 $63,501 $96,200 $148,253
$68,502 $44,546 $66,077 $106,955
$95,185 $67,254 $92,998 $138,566
All >5–10 >10–20 >20–30 >30
$77,059 $23,033 $52,192 $113,980 $115,624
$92,137 $33,161 $64,371 $133,432 $133,968
$105,335 $43,255 $75,666 $149,906 $148,592
$126,711 $56,672 $92,748 $178,125 $174,777
$146,877 $70,032 $108,990 $204,604 $198,844
$106,850 $49,179 $74,249 $150,642 $152,786
$139,932 $74,908 $106,334 $190,348 $184,329
60s
All >5–10 >10–20 >20–30 >30
$100,344 $24,715 $55,734 $122,455 $160,083
$115,145 $35,016 $68,281 $140,700 $176,702
$126,536 $45,010 $79,374 $154,882 $187,193
$145,818 $58,024 $95,303 $178,266 $209,625
$161,576 $70,230 $109,103 $196,658 $227,070
$118,283 $47,817 $71,684 $142,913 $175,890
$144,004 $71,527 $100,363 $171,744 $197,472
Alla
All
$60,144
$72,173
$82,768
$99,644
$115,257
$83,161
$109,723
20s
All >5–10
30s
All >5–10 >10–20
40s
All >5–10 >10–20 >20–30
50s
2003 $3,563
Source: Tabulations from EBRI/ICI Participant-Directed Retirement Plan Data Collection Project. a The analysis is based on a sample of 4.3 million participants with account balances at the end of each year from 2003 through 2009. b Age and tenure groups are based on participant age and tenure at year-end 2009.
Figure 7 Percent Change in Average Account Balances Among 401(k) Participants Present From Year-End 2003 Through Year-End 2009,a by Participant Age and Tenureb Age Groupb
Tenure (years)b
2003–2004
2004–2005
2005–2006
2006–2007
2007–2008
2008-2009
2003–2009
20s
All >5–10
92.6% 99.8%
53.8% 56.1%
45.5% 46.4%
32.6% 33.2%
-23.4% -22.1%
56.8% 54.7%
586.6% 632.8%
30s
All >5–10 >10–20
39.9% 55.8% 30.3%
28.6% 37.2% 22.4%
31.5% 36.2% 27.5%
23.5% 26.6% 20.9%
-28.6% -27.6% -29.2%
47.0% 50.9% 42.5%
206.7% 302.4% 147.9%
40s
All >5–10 >10–20 >20–30
24.8% 47.4% 24.2% 18.4%
18.5% 32.2% 18.3% 13.2%
23.8% 32.6% 23.7% 20.0%
18.2% 24.0% 18.3% 15.1%
-30.0% -29.8% -31.3% -27.9%
39.0% 51.0% 40.7% 29.6%
110.6% 239.5% 107.9% 73.2%
50s
All >5–10 >10–20 >20–30 >30
19.6% 44.0% 23.3% 17.1% 15.9%
14.3% 30.4% 17.5% 12.3% 10.9%
20.3% 31.0% 22.6% 18.8% 17.6%
15.9% 23.6% 17.5% 14.9% 13.8%
-27.3% -29.8% -31.9% -26.4% -23.2%
31.0% 52.3% 43.2% 26.4% 20.6%
81.6% 225.2% 103.7% 67.0% 59.4%
60s
All >5–10 >10–20 >20–30 >30
14.8% 41.7% 22.5% 14.9% 10.4%
9.9% 28.5% 16.2% 10.1% 5.9%
15.2% 28.9% 20.1% 15.1% 12.0%
10.8% 21.0% 14.5% 10.3% 8.3%
-26.8% -31.9% -34.3% -27.3% -22.5%
21.7% 49.6% 40.0% 20.2% 12.3%
43.5% 189.4% 80.1% 40.3% 23.4%
Alla
All
20.0%
14.7%
20.4%
15.7%
-27.8%
31.9%
82.4%
Source: Tabulations from EBRI/ICI Participant-Directed Retirement Plan Data Collection Project. a The analysis is based on a sample of 4.3 million participants with account balances at the end of each year from 2003 through 2009. b Age and tenure groups are based on participant age and tenure at year-end 2009.
ebri.org Issue Brief • November 2010 • No. 350
12
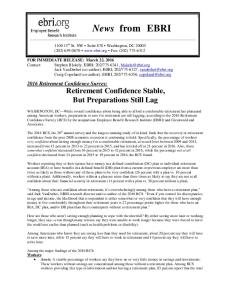
The change in any individual participant’s account balance is influenced by the magnitudes of these three factors relative to the starting account balance. For example, a contribution of a given dollar amount produces a larger growth rate when added to a smaller account. On the other hand, investment returns of a given percentage produce larger dollar increases (or decreases) when compounded on a larger asset base. All told, from year-end 2003 through year-end 2009, the average account balance among the group of consistent participants grew 82.4 percent, rising from $60,144 at year-end 2003 to $109,723 at year-end 2009 (Figures 5 and 7). This translates into an annual average growth rate of 10.5 percent over the six-year period. The median account balance (or midpoint, with half above and half below) among this consistent group also grew, more than doubling from $26,098 in 2003 to $59,381 in 2009 (an annual average growth rate of 14.7 percent; Figure 5). Among the consistent group, there was a wide range of individual participant experience, often influenced by the relationship among the three factors mentioned above: contributions, investment returns, and withdrawal and loan activity. Participants who were younger or had fewer years of tenure experienced the largest increases in average account balance between year-end 2003 and year-end 2009. For example, the average account balance of participants in their 20s rose 586.6 percent (a 37.9 percent annual average growth rate) between the end of 2003 and the end of 2009 (Figures 6 and 7). Because younger participants’ account balances tended to be small (Figure 6), contributions produced significant account balance growth. In contrast, the average account balance of older participants or those with longer tenures showed more modest growth (Figure 7). For example, the average account balance of participants in their 60s increased 43.5 percent (a 6.2 percent annual average growth rate) between year-end 2003 and year-end 2009. Investment returns, rather than annual contributions, generally account for most of the change in accounts with larger balances. In addition, participants in their 60s tend to have a higher propensity to make withdrawals.27 These changes in participant account balances also reflect changes in asset values during the six-year time period (Figure 8). Although asset allocation varied with age and many participants held a range of investments, the impact of stock market performance showed through in 401(k) accounts because 401(k) plan participants tended to be heavily invested in equity securities. At year-end 2009, whether looking at the 2003–2009 consistent group or the entire EBRI/ICI 401(k) database, equity securities—equity funds, the equity portion of balanced funds,28 and company stock— represented about 60 percent of 401(k) plan participants’ assets.29 The asset allocation of participants in the consistent group varied with participant age, a pattern that is also observed in the cross-sectional EBRI/ ICI 401(k) database. Younger participants generally tended to favor equity and balanced funds, while older participants were more likely to invest in fixed-income securities such as bond funds, GICs and other stable value funds, or money funds. Given these investment patterns, the growth pattern of 401(k) balances is influenced by stock market returns. As stock market values generally moved upward between 2003 and 2007, the average account balance of the 2003–2009 consistent group rose, on average, 17.7 percent per year over that four-year time period. In 2008, stock market performance turned sharply negative, with the S&P 500 total return index falling 37.0 percent (only in 1931, when the total return on large-company stock fell 43.3 percent, did that measure perform as poorly on an annual basis as the market did in 2008)30 and the Russell 2000 Index falling 33.8 percent (Figure 8). In 2008, the average 401(k) account balance of the 2003–2009 consistent group fell by a smaller amount—27.8 percent—likely reflecting diversified portfolios and ongoing contributions.31 In 2009, the stock market rose and the average 401(k) account balances of the 2003–2009 consistent group increased 31.9 percent.
Year-End 2009 Snapshot of 401(k) Participants’ Account Balances Definition of 401(k) Account Balance In any given year, the EBRI/ICI 401(k) database provides a snapshot of the 401(k) account balances across all active participants’ accounts. The database contains only the account balances held in the 401(k) plans at participants’ current employers and reflects the entrance of new plans and new participants and the exit of participants who retire or change jobs. Retirement savings held in plans at previous employers or rolled over into IRAs are not included in the database. Furthermore, account balances are net of unpaid loan balances. Because of all these factors, it is not correct to
ebri.org Issue Brief • November 2010 • No. 350
13
Figure 8 Domestic Stock and Bond Market Indexes 280
Month-end level,1 December 1996 to September 2010
260 240
S&P 500
220
2
200 180 160 Barclays Capital U.S.4 Aggregate Bond Index
140 120 100 3
Russell 2000 Index 80
Dec- Jun- Dec- Jun- Dec- Jun- Dec- Jun- Dec- Jun- Dec- Jun- Dec- Jun- Dec- Jun- Dec- Jun- Dec- Jun- Dec- Jun- Dec- Jun- Dec- Jun- Dec- Jun96 97 97 98 98 99 99 00 00 01 01 02 02 03 03 04 04 05 05 06 06 07 07 08 08 09 09 10 60%
Annual Percent Change in Total Return Index
50 %
Russell 2000 Index
40 % 33.4
3
4
28.6
30%
Barclays Capital U.S. Aggregate Bond Index
28.7
22.4
21.0 21.3
18.3
20% 10%
2
S&P 500
47.3
26.5 27.2
18.4 15.8
11.6
9.7
8.7
8.4
10.9
10.3
4.3
4.1
2.5
4.9 4.6 2.4
4.3
7.0
5.5
5.2
5.9
9.1 7.9 3.9
0 -2.5
-0.8
-10%
-1.6
-3.0 -9.1 -11.9
-20% -22.1
-20.5
-30% -33.8
-40%
-37.0
-50% 1997
1998
1999
2000
2001
2002
2003
2004
2005
2006
2007
2008
2009
Sep-10
Sources: Bloomberg, Barclays Global Investors, Frank Russell Company, and Standard & Poor's. 1 All indexes are set to 100 in December 1996. 2 The S&P 500 is an index of 500 stocks chosen for market size, liquidity, and industry group representation. 3 The Russell 2000 Index measures the performance of the 2,000 smallest U.S. companies (based on total market capitalization) included in the Russell 3000 Index (which tracks the 3,000 largest U.S. companies). 4 Formerly the Lehman Brothers U.S. Aggregate Bond Index, the Barclays Capital U.S. Aggregate Bond Index is composed of securities covering government and corporate bonds, mortgage-backed securities, and asset-backed securities index (rebalanced monthly by market capitalization). The index's total return consists of price appreciation/depreciation plus income as a percentage of the original investment.
ebri.org Issue Brief • November 2010 • No. 350
14
presume that the change in the average or median account balance for the database as a whole reflects the experience of “typical” 401(k) plan participants.
Size of 401(k) Account Balances At year-end 2009, the average account balance was $58,351 and the median account balance was $17,794 (Figure 9). There is wide variation in 401(k) plan participants’ account balances at year-end 2009. Almost three-quarters of the participants in the 2009 EBRI/ICI 401(k) database had account balances that were lower than $58,351, the size of the average account balance. In fact, 38.9 percent of participants had account balances of less than $10,000, while 16.6 percent of participants had account balances greater than $100,000 (Figure 10). The variation in account balances partly reflects the effects of participant age, tenure, salary, contribution behavior, rollovers from other plans, asset allocation, withdrawals, loan activity, and employer contribution rates. This research report examines the relationship between account balances and participants’ age, tenure, and salary.
Relationship of Age and Tenure to Account Balances There is a positive correlation between age and account balance among participants covered by the 2009 database.32 Examination of the age composition of account balances finds that 52 percent of participants with account balances of less than $10,000 were in their 20s or 30s (Figure 11). Similarly, 59 percent of participants with account balances greater than $100,000 were in their 50s or 60s. The positive correlation between age and account balance is expected because younger workers are likely to have lower incomes and to have had less time to accumulate a balance with their current employer. In addition, they are less likely to have rollovers from a previous employer’s plan in their current plan accounts. There is also a positive correlation between account balance and tenure among participants represented by the 2009 database. A participant’s tenure with an employer serves as a proxy for the length of time a worker has participated in the 401(k) plan.33 Indeed, 61 percent of participants with account balances of less than $10,000 had five or fewer years of tenure, while 79 percent of participants with account balances greater than $100,000 had more than 10 years of tenure (Figure 12).34 Examining the interaction of both age and tenure with account balances reveals that, for a given age group, average account balances tend to increase with tenure. For example, the average account balance of participants in their 60s with up to two years of tenure was $23,796, compared with $198,993 for participants in their 60s with more than 30 years of tenure (Figure 13).35 Similarly, the average account balance of participants in their 40s with up to two years of tenure was $16,146, compared with $125,257 for participants in their 40s with more than 20 years of tenure. The distribution of account balances underscores the effects of age and tenure on account balances. In a given age group, shorter tenure tends to mean that a higher percentage of participants will have account balances of less than $10,000. For example, 85 percent of participants in their 20s with two or fewer years of tenure had account balances of less than $10,000 in 2009, compared with 57 percent of participants in their 20s with between five and 10 years of tenure (Figure 14). Older workers display a similar pattern. For example, 59 percent of participants in their 60s with two or fewer years of tenure had account balances of less than $10,000. In contrast, only 17 percent of those in their 60s with more than 20 years of tenure had account balances of less than $10,000.36 In a given age group, longer tenure tends to mean that a higher percentage of participants will have account balances greater than $100,000. For example, 16 percent of participants in their 60s with five to 10 years of tenure had account balances in excess of $100,000 in 2009 (Figure 15). However, 43 percent of participants in their 60s with between 20 and 30 years of tenure with their current employer had account balances greater than $100,000. The percentage increases to 49 percent for participants in their 60s with more than 30 years of tenure.
Relationship Between Account Balances and Salary Participants’ account balances vary not only with age and tenure, but also with salary. Figure 16 reports the account balances of longer-tenured participants at their current employers’ 401(k) plans. Retirement savings held at previous employers or amounts rolled over to IRAs are not included in the analysis. To capture as long a savings history as
ebri.org Issue Brief • November 2010 • No. 350
15
Figure 9 Snapshot of Year-End 401(k) Account Balances 401(k) plan participant account balances,* 1996–2009 $70,000 $65,454 $61,346
Average $60,000
$58,351
$58,328 $56,878
$55,502 $51,569
$50,000
$49,024
$47,004
$45,519 $43,215
$41,156
$40,000
$39,885
$37,323
$30,000
$20,000
$10,000
$0 1996
1997
1998
1999
2000
2001
2002
2003
2004
2005
2006
2007
2008
2009
$25,000
Median (mid-point)
$19,926 $19,398
$20,000
$18,986 $18 986
$18,942
$17,909
$17,794
$15,246
$15,000
$13,493
$13,038
$12,810
$11,873 $11,600
$12,655
$12,578
$10,000
$5,000
$0 1996
1997
1998
1999
2000
2001
2002
2003
2004
2005
2006
2007
2008
2009
Source: Tabulations from EBRI/ICI Participant-Directed Retirement Plan Data Collection Project. *Account balances are participant account balances held in 401(k) plans at the participants' current employers and are net of plan loans. Retirement savings held in plans at previous employers or rolled over into IRAs are not included. Note: The sample of participants changes over time.
ebri.org Issue Brief • November 2010 • No. 350
16
Figure 10 Distribution of 401(k) Account Balances, by Size of Account Balance Percentage of participants with account balances in specified ranges, 2009 38.9%
13.5% 9.5% 9 5%
8.2% 5.8%
7.1% 4.5%
3.5%
2.9%
2.4%
2.0%
1.7%
0
Size of Account Balance Source: Tabulations from EBRI/ICI Participant-Directed Retirement Plan Data Collection Project. Note: At year-end 2009, the average account balance among all 20.7 million 401(k) particiants was $58,351; the median account balance was $17,794.
Figure 11 Age Composition of Selected 401(k) Account Balance Categories Percentage of participants with account balances in specified ranges, 2009 100% 7%
10%
90%
Age Group 17%
16%
60s
80% 28%
50s
70% 40s
24%
43%
60% 30s
50% 33%
40%
20s
28%
30% 32%
20% 25%
10%
24% 9% 4%
0%
Less Than $10,000
>$40,000–$50,000
<0.5%
More Than $100,000
Size of Account Balance Source: Tabulations from EBRI/ICI Participant-Directed Retirement Plan Data Collection Project. Note: Percentages may not add to 100 percent because of rounding.
ebri.org Issue Brief • November 2010 • No. 350
17
Figure 12 Tenure Composition of Selected 401(k) Account Balance Categories Percentage of participants with account balances in specified ranges, 2009 4%
5%
2%
16%
12%
12%
Tenure
20% 31%
29% >30 Years >20–30 Years >10–20 Years
30%
>5–10 Years
27%
34%
>2–5 Years 2 5Y 0–2 Years
18%
31%
16%
1%
7% Less Than $10,000
4%
>$40,000–$50,000
More Than $100,000
Size of Account Balance Source: Tabulations from EBRI/ICI Participant-Directed Retirement Plan Data Collection Project. Note: Percentages do not add to 100 percent because of rounding. Job tenure is generally years working at current employer, and thus may overstate years of participation in the 401(k) plan.
Figure 13 401(k) Account Balances Increase With Age and Tenure Average 401(k) account balance, by age and tenure, 2009 Age Group
Tenure (years) >5–10 >10–20
>20–30
0–2
>2–5
20s
$4,976
$10,064
$14,920
>30
30s
$11,052
$20,355
$36,091
$50,696
40s
$16,146
$26,975
$49,222
$82,127
$125,257
50s
$20,817
$30,768
$54,169
$92,304
$171,290
$179,150
60s
$23,796
$30,990
$51,887
$86,694
$155,662
$198,993
Source: Tabulations from EBRI/ICI Participant-Directed Retirement Plan Data Collection Project. Note: At year-end 2009, the average account balance among all 20.7 million 401(k) particiants was $58,351; the median account balance was $17,794. The tenure variable is generally years working at current employer, and thus may overstate years of participation in the 401(k) plan.
ebri.org Issue Brief • November 2010 • No. 350
18
Figure 14 401(k) Account Balances Less Than $10,000, by Participant Age and Tenure Percentage of participants with account balances less than $10,000 at year-end 2009 90%
80%
70%
60%
20s
50%
40%
30%
30s 20%
60s 40s
10%
50s
0% 0–2
>2–5
>5–10
>10–20
>20–30
>30
Years of Tenure Source: Tabulations from EBRI/ICI Participant-Directed Retirement Plan Data Collection Project. Note: The tenure variable is generally years working at current employer, and thus may overstate years of participation in the 401(k) plan.
Figure 15 401(k) Account Balances Greater Than $100,000, by Participant Age and Tenure Percentage of participants with account balances greater than $100,000 at year-end 2009 60%
50s 50%
60s
40s 40%
30%
20%
30s 10%
20s 0% 0–2
>2–5
>5–10
>10–20
>20–30
>30
Years of Tenure Source: Tabulations from EBRI/ICI Participant-Directed Retirement Plan Data Collection Project. Note: The tenure variable is generally years working at current employer, and thus may overstate years of participation in the 401(k) plan.
ebri.org Issue Brief • November 2010 • No. 350
19
possible, only long-tenured participants are included in this analysis. However, it is important to note that the tenure variable is the time that individuals have been at their current jobs and may not reflect the length of time they have participated in a 401(k) plan (particularly among older participants, since 401(k) plans were introduced only about 29 years ago).37 Older, longer-tenured, and higher-income participants tend to have larger account balances, which are important for meeting their income-replacement needs in retirement.38 For longer-tenured participants in their 20s with salaries between $20,000 to $40,000, the median account balance was $5,778 in 2009 (Figure 16). Longer-tenured participants in their 20s earning more than $100,000 had a median account balance of $57,935. Among longer-tenured participants in their 60s with $20,000 to $40,000 in salary in 2009, the median account balance was $49,178. For longer-tenured participants in their 60s earning more than $100,000, the median account balance was $327,871. The ratio of participant account balance to salary is positively correlated with age and tenure.39 Participants in their 60s—having had more time to accumulate assets—tend to have higher ratios, while those in their 20s had the lowest ratios (Figure 17). In addition, for any given age and tenure combination, the ratio of account balance to salary varies somewhat with salary. For example, among participants in their 20s, the ratio tends to increase slightly with salary for low-to-moderate salary groups (Figure 18). However, at high salary levels the ratio tends to decline somewhat. A similar pattern occurs among participants in their 60s (Figure 19).40
Year-End 2009 Snapshot of 401(k) Asset Allocation As tends to occur when the stock market rises in value, the percentage of 401(k) assets invested in equities rose in 2009. At year-end 2009, 41 percent of 401(k) plan participants’ account balances was invested in equity funds, on average, compared with 37 percent at year-end 2008, 48 percent at year-end 2007, and 40 percent at year-end 2002 (Figure 20, top panel). Altogether, equity securities—equity funds, the equity portion of balanced funds,41 and company stock—represented about 60 percent of 401(k) plan participants’ assets.
Changes in Asset Allocation Between Year-End 2008 and Year-End 2009 Investment performance likely explains much of the changes in 401(k) participants’ asset allocations over time. Much of the movement in the largest component, equity funds, tends to reflect overall equity market prices, which generally rose from 1996 through 1999, before falling through 2002, rising again from 2003 through 2007, then dropping in 2008, and rising in 2009 (Figures 8 and 20). At year-end 2009, equity funds were 41 percent of the assets in the EBRI/ICI 401(k) database, compared with a 37 percent share at year-end 2008. Balanced funds, which invest in equities and fixed-income securities, also increased in share, accounting for 17 percent of the assets in the database at year-end 2009. Despite the increases in shares of equity and balanced funds and the decreases in the shares of bond funds, GICs and other stable value funds, and money funds, most 401(k) participants appeared not to have made dramatic shifts in their asset allocations in 2009.42 Transaction activity is not tracked in the EBRI/ICI 401(k) database; nevertheless, some participant asset allocation activity can be inferred by analyzing the year-end snapshots of a consistent group of participants. For example, participant action can be discerned by studying the cases of a change from either a 0 percent (none) or a 100 percent allocation to any other allocation. Between year-end 2008 and year-end 2009, among the 16.7 million 401(k) participants with account balances in both years, the percentages of participants holding either all or none of their account balances in any particular investment option were little changed (Figure 20, lower panel).43 For example, at year-end 2008, 40.2 percent of these participants held no equity funds. At year-end 2009, 38.5 percent continued to hold no equity funds, but 1.7 percent of participants were holding equity funds at year-end 2009 when they had held none at year-end 2008.44 Conversely, the asset allocation to equity funds changed for 4.7 percent of 401(k) participants from holding equity funds at year-end 2008 to holding none at year-end 2009. On net, the percentage of participants holding no equity funds edged up only slightly, from 40.2 percent to 43.2 percent between year-end 2008 and year-end 2009 (Figure 20, lower panel).
ebri.org Issue Brief • November 2010 • No. 350
20
Figure 16 Median Account Balancea Among Longer-Tenuredb Participants, by Age and Salary, 2009 Participant Age Group 20s
30s
40s
50s
60s
$20,000–$40,000
$5,778
$14,378
$38,847
$53,239
$49,178
>$40,000–$60,000
$12,673
$26,824
$60,760
$81,450
$81,700
>$60,000–$80,000
$29,612
$50,318
$107,614
$135,800
$139,928
>$80,000–$100,000
$44,780
$84,982
$164,466
$196,485
$212,205
>$100,000
$57,935
$130,689
$251,767
$318,340
$327,871
Salary Range
Source: Tabulations from EBRI/ICI Participant-Directed Retirement Plan Data Collection Project. a Account balances are based on administrative records and cover the account balance at the 401(k) plan participant's current employer. Retirement savings held in plans at previous employers or rolled over into IRAs are not included. Account balances are net of loan balances. b Longer-tenured participants are used in this analysis to capture as long a work and savings history as possible. The tenure variable tends to be years with the current employer rather than years of participation in the 401(k) plan. Particularly among older participants, job tenure may not reflect length of participation in the 401(k) plans; the regulations for the 401(k) plans were introduced about 28 years ago.
Figure 17 Ratio of 401(k) Account Balance to Salary, by Participant Age and Tenure Percentage, 2009 300%
250%
60s 50s
200%
40s 150%
100% 30s
50% 20s
0% 0 to 2
>2–5
>5–10
>10–20
>20–30
>30
Years of Tenure Source: Tabulations from EBRI/ICI Participant-Directed Retirement Plan Data Collection Project. Note: The Tenure variable is generally years working at current employer, and thus may overstate years of participation in the 401(k) plan.
ebri.org Issue Brief • November 2010 • No. 350
21
Figure 18 Ratio of 401(k) Account Balance to Salary for Participants in Their 20s, by Tenure Percentage, 2009 70%
60%
50%
40% >5–10 Years 30% >2–5 Years 20%
0–2 Years
10%
0%
Salary Range Source: Tabulations from EBRI/ICI 401(k) Participant-Directed Retirement Plan Data Collection Project. Note: The tenure variable is generally years working at current employer, and thus may overstate years of participation in the 401(k) plan.
Figure 19 Ratio of 401(k) Account Balance to Salary for Participants in Their 60s, by Tenure Percentage, 2009 400%
350%
300% >20 Years 250%
200%
>10–20 Years
150% >5–10 Years 100% >2–5 Years 50% 0–2 Years 0%
Salary Range Source: Tabulations from EBRI/ICI Participant-Directed Retirement Plan Data Collection Project. Note: The tenure variable is generally years working at current employer, and thus may overstate years of participation in the 401(k) plan.
ebri.org Issue Brief • November 2010 • No. 350
22
Figure 20 Asset Allocation of 401(k) Participants 401(k) Plan Assets Concentrated in Equity Funds 401(k) plan average asset allocation, percentage of total assets,a selected years
53%
37%
40%
44%
48%
Year 1996 1999 2002 2007 2008 2009
41%
19% 19%
9%
7%
5%
7%
11%
11% 9% 8%
12% 11%
8%
11% 10%
Company Stock
Balanced Funds
15% 13% 5% 4% 6% 4%
c
Equity Funds
16%
16%
15% 15%
11%
17%
16%
Bond Funds
Investment Category
c,d
GICs and Other Stable-Value Fundsc
7%
5%
Money Funds
100% 90% 80%
Changes in All-or-Nothing 401(k) Plan Participant Asset Allocation, by Investment Category, 2008–2009 Percentage of participantsb
80.0%
2008
76.6%
2009 70%
77.6%
72.4% 72.9% 64.6% 64 6%
67.6%
66.5%
77.3%
79.9%
81.1%
67.5%
60% 50%
43.2% 40.2%
40% 30% 20% 10% 0%
13.3% 13.2% 8.4% 8.0%
None 100% Equity Funds
3.0% 2.9%
None 100% Bond Funds
3.0% 2.9%
2.1% 2.0%
None 100% Company Stockc
None 100% Target-date Funds
None 100% Non-Targetdate Funds
Balanced Funds
4.0% 4.0%
None 100% GICsc,d and Other StableV l F d c Value Funds
3.5% 3.3%
None 100% Money Funds
Investment Category Source: Tabulations from EBRI/ICI Participant-Directed Retirement Plan Data Collection Project. a Minor investment options are not shown; therefore, percentages do not add to 100 percent. Percentages are dollar-weighted averages. b Includes the 16.7 million participants with accounts at the end of each year from 2008 through 2009. A given participant may be counted in multiple investment categories. For example, a participant who is 100 percent invested in equities will be counted as "none" in each of the other investment categories. c Not all participants are offered this investment option. See Figure 22. d GICs are guaranteed investment contracts. Note: “Funds” include mutual funds funds, bank collective trusts trusts, life insurance separate accounts accounts, and any pooled investment product primarily invested in the security indicated.
ebri.org Issue Brief • November 2010 • No. 350
23
Similarly, there was a small decline in the percentage of participants allocating 100 percent of their accounts to equity funds (Figure 20, lower panel). At year-end 2008, 8.4 percent of participants with accounts in both 2008 and 2009 were 100 percent invested in equity funds. At year-end 2009, 7.2 percent continued to hold 100 percent of their accounts in equity funds.45 In addition, 0.9 percent of participants had increased their asset allocation to equity funds to 100 percent at year-end 2009 from lower allocations at year-end 2008. However, 1.1 percent of participants reduced their allocation to equity funds from 100 percent to less than all of their account. On net, the percentage of participants with their full account balance allocated to equity funds edged down slightly in 2009 to 8.0 percent of participants. The net changes in percentages of participants 100 percent invested in the non-equity fund EBRI/ICI investment categories were generally small. The largest net change involved the share of participants completely eschewing nontarget-date balanced funds, which increased 3.4 percentage points between 2008 and 2009 (Figure 20, lower panel). At year-end 2008, 76.6 percent of participants held no non-target-date balanced funds. At year-end 2009, 80.0 percent of participants held no non-target-date balanced funds. The second-largest net change in asset allocation to non-equity fund investments involved the share of participants completely eschewing bond funds, which increased 1.9 percentage points between 2008 and 2009 (Figure 20, lower panel). At year-end 2008, 64.6 percent of participants held no bond funds. At year-end 2009, 62.0 percent of participants continued to hold no bond funds, but 2.6 percent of participants held at least some of their accounts in bond funds at year-end 2009 when they had held no bond funds at year-end 2008.46 Conversely, 4.5 percent of participants held no bond funds at year-end 2009 when they had held bond funds at year-end 2008. On net, the percentage of participants holding no bond funds increased to 66.5 percent at year-end 2009. Between year-end 2008 and year-end 2009, on net, the percentage of participants allocating 100 percent of their account balance to bond funds edged up from 2.9 percent to 3.0 percent of participants. In sum, the EBRI/ICI 401(k) database does not contain information on participant transaction activity but can be used to analyze the year-end asset allocations of the consistent group of participants with accounts at year-end 2008 and year-end 2009. The analysis suggests that there is no evidence of a significant shift by a large percentage of participants away from their year-end 2008 asset allocations.
Asset Allocation and Participant Age As in previous years, the database for year-end 2009 finds that participants’ asset allocation varied considerably with age.47 Younger participants tended to favor equity funds, while older participants were more likely to invest in fixedincome securities such as bond funds, GICs and other stable value funds, or money funds (Figure 21). For example, among participants in their 20s, the average allocation to equity and balanced funds was 73 percent of assets, compared with 47 percent of assets among participants in their 60s. Among participants in their 20s, the average allocation to equity funds was 38 percent of assets, compared with 32 percent of assets among participants in their 60s. Younger participants also had higher allocations to balanced funds, particularly to target-date funds. A targetdate, or lifecycle fund pursues a long-term investment strategies, using a mix of asset classes that follow a predetermined reallocation, typically rebalancing to shift their focus from growth to income over time.48 At year-end 2009, nearly 10 percent of 401(k) assets in the database were invested in target-date funds. Among participants in their 20s, nearly 24 percent of their 401(k) assets were invested in target-date funds, while among participants in their 60s, almost 8 percent of their 401(k) assets was invested in target-date funds.
Asset Allocation and Investment Options The investment options that a plan sponsor offers significantly affect how participants allocate their 401(k) assets. Figure 22 presents the distribution of plans, participants, and assets by four combinations of investment offerings. The first category is the base group, which consists of plans that do not offer company stock, GICs, or other stable-value funds. Thirty percent of participants in the 2009 database were in these plans, which generally offer equity funds, bond funds, money funds, and balanced funds as investment options. Another 24 percent of participants were in plans that offer GICs and other stable-value funds as an investment option, in addition to the “base” options. Alternatively, 16 percent of participants were in plans that offer company stock, but no stable-value products, while the remaining 30 percent of participants were offered both company stock and stable-value products, in addition to the base options.
ebri.org Issue Brief • November 2010 • No. 350
24
Figure 21
Average Asset Allocation of 401(k) Accounts, by Participant Age Percentage of account balances, 2009 Non-Target-date Balanced Bond Funds Funds
Target-date Funds a
20s
38.3%
23.5%
11.2%
7.7%
3.5%
5.5%
7.3%
1.2%
2.1%
30s
48.3%
13.5%
7.7%
9.2%
3.8%
5.7%
8.0%
2.1%
2.1%
100%
40s
47.3%
9.9%
7.1%
9.9%
4.2%
8.3%
9.4%
2.6%
1.6%
100%
Age Group
Money Funds
GICs b/Stable- Compan Companyy Value Funds Stock Other
Equity Funds
Unknown
Total c c 100%
50s
39.0%
8.7%
7.2%
12.0%
5.4%
13.5%
10.2%
2.9%
1.5%
100%
60s
32.2%
7.6%
6.9%
13.9%
7.3%
19.9%
8.3%
2.9%
1.2%
100%
All
40.6%
9.5%
7.2%
11.4%
5.3%
12.6%
9.2%
2.7%
1.6%
100%
So urce: Tabulatio ns fro m EB RI/ICI P articipant-Directed Retirement P lan Data Co llectio n P ro ject. aA
target-date fund typically rebalances its po rtfo lio to beco me less fo cused o n gro wth and mo re fo cused o n inco me as it appro aches and passes the target date o f the fund, which is usually included in the fund’ s name. b GICs
are guaranteed investment co ntracts.
c Ro w percentages
may no t add up to 100 percent because o f ro unding. P ercentages are do llar-weighted averages. No te: “ Funds” include mutual funds, bank co llective trusts, life insurance separate acco unts, and any po o led investment pro duct primarily invested in the security indicated.
Figure 22 Distribution of 401(k) Plans, Participants, and Assets, by Investment Options, 2009 Investment Options Offered by Plan
Plans
Participants
Assets
Equity, bond, money, and/or balanced funds Of which: target-date fundsa an option
27,879 21,466
6,276,906 4,690,890
$298,127,169,373 $216,951,883,385
Equity, bond, money, and/or balanced funds, b and GICs and/or other stable value funds Of which: target-date fundsa an option
22,404 17,197
4,988,736 3,945,915
$250,001,456,068 $192,078,616,530
Equity, bond, money, and/or balanced funds, and company stock a Of which: target-date funds an option
644 479
3,223,670 1 934 680 1,934,680
$192,188,040,515 $126 937 250 457 $126,937,250,457
Equity, bond, money, and/or balanced funds, and company stock, and GICsb and/or other stable value funds Of which: target-date fundsa an option
925 731
6,254,419 4,213,175
$470,098,152,981 $325,628,206,556
51,852
20,743,731
1,210,414,818,938
39,873
14,784,660
861,595,956,927
Percentage of plans
Percentage of participants
Percentage of assets
All a
Of which: target-date funds an option Investment Options Offered by Plan Equity, bond, money, and/or balanced funds a Of which: target-date funds an option
53.8%
30.3%
24.6%
41.4%
22.6%
17.9%
Equity, bond, money, and/or balanced funds, b and GICs and/or other stable value funds
43.2%
24.0%
20.7%
33.2%
19.0%
15.9%
1.2%
15.5%
15.9%
0.9%
9.3%
10.5%
a
Of which: target-date funds an option Equity, bond, money, and/or balanced funds, and company stock a Of which: target-date funds an option Equity, bond, money, and/or balanced funds, b and company stock, and GICs and/or other stable value funds Of which: target-date fundsa an option All
c
Of which: target date fundsa an option
1.8%
30.2%
38.8%
1.4%
20.3%
26.9%
100%
100%
100%
76.9%
71.3%
71.2%
Source: Tabulations from EBRI/ICI 401(k) Participant-Directed Retirement Plan Data Collection Project. A target-date fund typically rebalances its portfolio to become less focused on growth and more focused on income as it approaches and passes the target date of the fund, which is usually included in the fund’s name. b GICs are guaranteed investment contracts. c Column percentages may not add to 100 percent because of rounding. a
ebri.org Issue Brief • November 2010 • No. 350
25
Target-date funds were available in 77 percent of 401(k) plans in the year-end 2009 database (Figure 22), up from 75 percent of plans in the year-end 2008 EBRI/ICI 401(k) database49 and 67 percent of plans in the year-end 2007 EBRI/ICI 401(k) database.50 These plans offered target-date funds to 71 percent of the participants in 2009.51 Among participants offered target-date funds, 46 percent held them at year-end 2009. Target-date fund assets represented 13 percent of the assets of plans offering such funds in their investment lineups.
Asset Allocation by Investment Options and Age, Salary, and Plan Size As discussed above, asset allocation varies with participant age. Thus, Figure 23 presents the analysis of asset allocation by investment options and also by participants’ age. Salary information is available for a subset of participants in the 2009 EBRI/ICI 401(k) database. Because asset allocation is influenced by the investment options available to participants, Figure 24 presents asset allocation by salary range and by investment options. Participant asset allocation also varies with plan size (Figure 25, top panel), but much of the variation can be explained by differences in the investment options offered by plan sponsors. For example, the percentage of plan assets invested in company stock rises with plan size. A portion of this trend occurs because few small plans offered company stock as an investment option. For example, less than 1 percent of participants in small plans were offered company stock as an investment option, while 66 percent of participants in plans with more than 5,000 participants were offered company stock as an investment option in 2009. Thus, to analyze the potential effect of plan size, the remaining panels of Figure 25 group plans by investment options and plan size.
Distribution of Equity Fund Allocations and Participant Exposure to Equities The year-end 2009 EBRI/ICI 401(k) database shows that, on average, 41 percent of participant account balances were allocated to equity funds (Figure 21). However, individual asset allocations varied widely across participants. For example, about 45 percent of participants held no equity funds, while 15 percent of participants held more than 80 percent of their balances in equity funds (Figures 26 and 27). Furthermore, the percentage of participants holding no equity funds varied with age, with 60 percent of participants in their 20s, 40 percent of participants in their 40s, and 48 percent of participants in their 60s holding no equity funds. The percentage of 401(k) participants holding no equity funds also varied with tenure, with participants with five or fewer years of tenure more likely not to be invested in equity funds. The percentage of participants holding no equity funds tends to fall as salary increases (Figure 27). Participants with no equity fund balances may still have exposure to the stock market through company stock or balanced funds, which include target-date funds. Indeed, 71 percent of participants with no equity funds had investments in either company stock or balanced funds at year-end 2009 (Figure 28). For example, 77 percent of participants in their 20s without equity funds held equities through company stock, balanced funds, or both. Indeed, 48 percent of participants in their 20s without equity funds held target-date funds—which will tend to be highly concentrated in equity securities for that age group—as their only equity investment. Another 8 percent of participants in their 20s without equity funds had equity exposure through non-target-date balanced funds, and another 5 percent held company stock as their only equity investment. Sixteen percent held some combination of target-date funds, nontarget-date balanced funds, or company stock as their equity investment. As a result, many participants with no equity funds had exposure to equity-related investments through company stock or balanced funds or both (Figure 29). Among individual participants, the allocation of account balances to equities (equity funds, company stock, and the equity portion of balanced funds) varies widely around the average of 60 percent for all participants in the 2009 database. Thirty-nine percent of participants had more than 80 percent of their account balances invested in equities, while 13 percent held no equities at all in 2009 (Figure 30).
Distribution of Participants’ Balanced Fund Allocations by Age Individual 401(k) participants’ asset allocation to balanced funds varies widely around an average of 17 percent (Figure 20, top panel). For example, half of participants held no balanced funds, while 22 percent of participants held more than 80 percent of their accounts in balanced funds in 2009 (Figure 31). At year-end 2009, half of 401(k) participants held balanced funds, similar to 51 percent of participants at year-end 2008.52 At year-end 2009, balanced fund use by
ebri.org Issue Brief • November 2010 • No. 350
26
Figure 23 Average Asset Allocation of 401(k) Accounts, by Participant Age and Investment Options Percentage of account balances,a 2009 Equity Funds
Target-date Fundsb
Non-Target-date Balanced Funds
Investment Options, All Ages Equity, bond, money, and/or balanced funds 13.2% 7.0% 48.4% Equity, bond, money, and/or balanced funds; and GICsc and/or other stable-value funds 42.3% 10.0% 10.1% Equity, bond, money, and/or balanced funds; and company stock 35.9% 9.9% 4.4% Equity, bond, money, and/or balanced funds, company stock; and GICsc and/or other stablevalue funds 36.6% 6.8% 6.9% Plans Without Company Stock, GICs,c or Other Stable-Value Funds Age Group 20s 44.3% 27.5% 7.3% 30s 53.9% 16.6% 6.1% 40s 53.7% 12.9% 6.7% 50s 46.6% 12.7% 7.3% 60s 40.3% 11.3% 7.1% Plans With GICsc and/or Other Stable-Value Funds 20s 39.2% 20.9% 19.6% 30s 50.1% 13.9% 12.1% 40s 50.0% 10.8% 10.3% 50s 41.6% 9.5% 9.8% 60s 33.7% 7.8% 9.4% Plans With Company Stock 20s 33.6% 30.5% 5.0% 30s 44.0% 14.9% 4.3% 40s 42.1% 10.4% 4.4% 8.4% 4.8% 50s 33.8% 60s 26.7% 7.5% 4.1% Plans With Company Stock and GICs,c and/or Other Stable-Value Funds 20s 35.8% 18.7% 11.8% 30s 45.0% 10.6% 7.9% 40s 43.7% 7.3% 6.9% 50s 35.4% 6.2% 6.8% 60s 28.3% 5.2% 6.5%
Bonds Funds
Money Funds
18.6%
8.5%
8.5%
3.3%
14.7%
10.0%
7.1%
2.3%
11.4% 13.4% 15.1% 19.4% 24.5%
6.0% 5.9% 6.8% 9.1% 11.8%
7.1% 7.3% 7.7% 9.1% 9.8%
2.0% 2.5% 2.8% 3.4% 4.3%
8.5% 10.2% 11.7% 16.1% 19.7%
4.9% 5.5% 6.9% 10.4% 16.4%
5.1% 6.5% 6.8% 7.7% 7.4%
2.0% 2.0% 2.0% 2.5% 2.9%
GICsc/StableValue Funds
Company Stock
21.6%
19.7%
20.7%
15.7%
10.1% 11.4% 15.9% 23.8% 31.8% 12.3% 16.4% 19.7% 21.2% 19.8% 9.5% 10.0% 13.6% 21.3% 32.6%
15.2% 15.0% 16.4% 16.8% 14.2%
Source: Tabulations from EBRI/ICI Participant-Directed Retirement Plan Data Collection Project. Minor investment options are not shown; therefore, row percentages will not add to 100 percent. Percentages are dollar-weighted averages.
a a
A target-date fund typically rebalances its portfolio to become less focused on growth and more focused on income as it approaches and passes the target date of the fund, which is usually included in the fund’s name. c GICs are guaranteed investment contracts. Note: "Funds" include mutual funds, bank collective trusts, life insurance separate accounts, and any pooled investment product primarily invested in the security indicated.
ebri.org Issue Brief • November 2010 • No. 350
27
ebri.org Issue Brief • November 2010 • No. 350
28
7.1% 7.9% 7.9% 7.8% 5.5% 6.9%
5.5% 6.1% 6.7% 7.2% 7.3% 7.1%
13.3% 15.3% 14.1% 11.7% 13.8% 14.7%
9.2% 8.9% 8.9% 9.5% 9.9% 8.5%
19.0% 18.2% 17.4% 17.7% 19.0% 18.6%
Funds
Bonds
1.8% 2.6% 2.6% 2.5% 2.4% 2.3%
12.9% 9.9% 9.4% 9.7% 7.1% 10.0%
3.3% 3.1% 3.1% 2.5% 2.9% 3.3%
8.7% 8.3% 8.2% 8.0% 7.3% 8.5%
Funds
Money
24.0% 21.1% 18.3% 16.7% 17.2% 20.7%
23.2% 23.5% 22.3% 21.6% 21.3% 21.6%
Value Funds
GICsd/Stable-
20.0% 19.6% 18.8% 18.3% 18.1% 15.7%
20.8% 17.2% 17.6% 20.2% 20.3% 19.7%
Stock
Company
a
Source: Tabulations from EBRI/ICI Participant-Directed Retirement Plan Data Collection Project. Minor investment options are not shown; therefore, row percentages will not add to 100 percent. Percentages are dollar-weighed averages. b Salary information is available for a subset of participants in the EBRI/ICI database. c A target-date fund typically rebalances its portfolio to become less focused on growth and more focused on income as it approaches and passes the target date of the fund, which is usually included in the fund’s name. d GICs are guaranteed investment contracts.
Plans With Company Stock and GICsd and/or Other Stable-Value Funds $20,000–$40,000 30.9% 8.2% >$40,000–$60,000 33.4% 7.1% >$60,000–$80,000 36.4% 7.7% >$80,000–$100,000 39.0% 7.1% >$100,000 42.0% 6.8% All 36.6% 6.8%
3.2% 4.8% 5.3% 5.0% 5.7% 4.4%
13.5% 11.3% 9.9% 6.7% 7.8% 9.9%
Plans With Company Stock $20,000–$40,000 >$40,000–$60,000 >$60,000–$80,000 >$80,000–$100,000 >$100,000 All 32.8% 37.8% 39.9% 43.5% 40.3% 35.9%
9.5% 11.0% 10.2% 9.7% 9.2% 10.1%
16.4% 14.2% 11.8% 11.1% 9.9% 10.0%
Balanced Funds
Non-Target-date
Plans With GICsd and/or Other Stable-Value Funds $20,000–$40,000 35.4% >$40,000–$60,000 39.0% >$60,000–$80,000 43.8% >$80,000–$100,000 44.5% >$100,000 45.8% All 42.3%
Target-date Fundsc 6.3% 6.6% 6.7% 5.4% 6.6% 7.0%
Funds
Equity
Plans Without Company Stock, GICs,d or Other Stable-Value Funds $20,000–$40,000 41.6% 21.9% >$40,000–$60,000 45.0% 19.4% >$60,000–$80,000 47.6% 17.5% >$80,000–$100,000 49.6% 16.8% >$100,000 50.4% 13.7% All 48.4% 13.2%
Salary
b
Percentage of account balances,a 2009
Figure 24 Average Asset Allocation of 401(k) Accounts, by Participant Salary and Investment Options
Figure 25 Average Asset Allocation of 401(k) Accounts, by Plan Size and Investment Options Percentage of account balances,a 2009 Non-TargetTarget-date date Balanced Equity Funds Funds Fundsb Plan Size by Number of Participants All Plans 1–100 44.5% 10.5% 13.1% 101–500 45.2% 12.7% 8.9% 501–1,000 44.2% 12.9% 7.9% 1,001–5,000 43.2% 12.1% 7.2% >5,000 39.0% 8.1% 6.6% All 40.6% 9.5% 7.2% Plans Without Company Stock, GICsc/Stable-Value Funds 1–100 45.2% 16.3% 7.2% 101–500 46.8% 15.5% 6.3% 501–1,000 47.2% 14.5% 6.6% 1001–5,000 48.2% 14.0% 7.3% >5,000 50.4% 9.4% 7.0% All 48.4% 13.2% 7.0% Plans With GICsc/Stable-Value Funds 1–100 101–500 501–1,000 1,001–5,000 >5,000 All
43.7% 43.8% 43.8% 42.3% 42.9% 42.3%
1.6% 7.1% 10.9% 12.9% 10.8% 10.0%
22.4% 14.5% 10.5% 8.2% 8.2% 10.1%
Plans With Company Stock 1–100d 38.2% 8.9% 4.3% 101–500 39.4% 11.4% 5.0% 501–1,000 37.5% 11.4% 3.8% 1,001–5,000 41.5% 8.7% 5.3% >5,000 34.2% 10.2% 4.2% All 35.9% 9.9% 4.4% Plans With Company Stock and GICsc/Stable-Value Funds 1–100 32.7% 13.7% 6.0% 101–500 34.8% 11.9% 9.2% 501–1,000 33.9% 11.4% 8.6% 1,001–5,000 36.9% 10.4% 7.1% >5,000 37.0% 6.3% 6.8% All 36.6% 6.8% 6.9%
Bond Funds
Money Funds
GICsc/StableValue
Company Stock
12.2% 14.0% 13.7% 12.7% 10.5% 11.4%
10.0% 8.2% 7.0% 5.7% 4.3% 5.3%
6.8% 6.9% 8.2% 9.8% 15.0% 12.6%
0.1% 0.6% 2.6% 4.9% 12.9% 9.2%
15.4% 17.4% 18.5% 17.9% 20.8% 18.6%
11.7% 10.0% 9.3% 8.2% 6.4% 8.5%
7.5% 8.1% 7.7% 8.1% 9.4% 8.5%
7.4% 4.7% 3.7% 2.5% 2.6% 3.3%
12.4% 13.9% 14.1% 15.9% 14.3% 14.7%
13.9% 12.4% 10.4% 8.4% 10.4% 10.0%
9.5% 8.0% 6.7% 6.8% 7.2% 7.1%
6.8% 4.0% 3.4% 3.5% 2.2% 2.3%
16.9% 19.8% 20.6% 22.2% 23.5% 21.6% 15.9% 12.5% 19.0% 15.7% 20.9% 19.7% 16.6% 17.9% 17.4% 18.1% 21.2% 20.7%
7.3% 6.6% 13.5% 11.4% 16.5% 15.7%
Source: Tabulations from EBRI/ICI Participant-Directed Retirement Plan Data Collection Project. Minor investment options are not shown; therefore, row percentages will not add to 100 percent. Percentages are dollar-weighted averages. a A target-date fund typically rebalances its portfolio to become less focused on growth and more focused on income as it approaches and passes the target date of the fund, which is usually included in the fund’s name. c GICs are guaranteed investment contracts. d Because few plans fall into this category, these percentages may be heavily influenced by a few outliers. Note: “Funds” include mutual funds, bank collective trusts, life insurance separate accounts, and any pooled investment product primarily invested in the security indicated. a
ebri.org Issue Brief • November 2010 • No. 350
29
ebri.org Issue Brief • November 2010 • No. 350
30
60.0%
43.8%
39.7%
41.3%
47.8%
44.8%
20s
30s
40s
50s
60s
All
4.2%
5.6%
5.2%
4.1%
3.5%
2.9%
1–10%
3.6%
4.4%
4.3%
3.6%
3.2%
2.3%
11–20%
4.4%
5.0%
5.1%
4.5%
4.1%
3.1%
4.6%
5.0%
5.3%
4.8%
4.4%
3.1%
31–40%
Row percentages may not add to 100 percent because of rounding.
5.9%
5.3%
6.4%
6.5%
6.0%
4.2%
51–60%
5.6%
4.3%
6.0%
6.4%
6.0%
4.0%
61–70%
5.6%
3.9%
5.5%
6.6%
6.3%
4.1%
71–80%
Note: "Equity funds” include mutual funds, bank collective trusts, life insurance separate accounts, and any pooled investment product primarily invested in equities.
b
5.7%
5.8%
6.6%
6.2%
5.6%
3.7%
41–50%
Percentage of Account Balance Invested in Equity Funds 21–30%
Source: Tabulations from EBRI/ICI 401(k) Participant-Directed Retirement Plan Data Collection Project. a The analysis includes the 20.7 million participants in the year-end 2009 EBRI/ICI database.
Zero
Age Group
Percentage of participants,a,b 2009
4.3%
2.6%
3.7%
5.1%
5.2%
3.8%
81–90%
Figure 26 Asset Allocation Distribution of 401(k) Account Balances to Equity Funds, by Participant Age
11.1%
10.3%
10.6%
12.6%
11.8%
8.8%
91–100%
participants was about evenly split between target-date funds and non-target-date balanced funds: 33 percent of 401(k) participants held target-date funds, 20 percent held non-target-date balanced funds, and nearly 3 percent held both. The increase in balanced fund use between year-end 2008 and year-end 2009 resulted from the increased use of target-date funds; at year-end 2008, 31 percent of 401(k) participants held target-date funds. Target-date fund use varies with participant age and tenure. Younger participants were more likely to hold target-date funds than older participants. At year-end 2009, 44 percent of participants in their 20s held target-date funds, compared with 24 percent of participants in their 60s in 2009 (Figure 31). More recently hired participants were more likely to hold target-date funds than participants with more years on the job: at year-end 2009, 47 percent of participants with two or fewer years of tenure held target-date funds, compared with 29 percent of participants with five to 10 years of tenure, and 19 percent of participants with more than 30 years of tenure (Figure 32).
Distribution of Participants’ Company Stock Allocations by Age
Participants’ allocations to company stock remained in line with previous years. Forty-six percent (or 9.5 million) of the 401(k) participants in the 2009 EBRI/ICI 401(k) database were in plans that offered company stock as an investment option (Figure 22). Among these participants, 72 percent held 20 percent or less of their account balances in company stock, including 48 percent who held none (Figure 33). On the other hand, about 5 percent had more than 80 percent of their account balances invested in company stock.
Asset Allocation of Recently Hired Participants
Comparing snapshots of newly hired 401(k) plan participants’ asset allocations provides further insight into the recent investment allocation activity of plan participants. Balanced funds, which include target-date funds, have increased in popularity among 401(k) participants. Recently hired participants in 2009 tended to be more likely to hold balanced funds compared with recent hires in the past. Sixty-one percent of recently hired participants in 2009 held balanced funds, compared with 60 percent of recently hired participants in 2008, 53 percent of recent hires in 2007, 33 percent of recent hires in 2002, and 29 percent of recent hires in 1998 (Figure 34). At year-end 2009, 47 percent of recently hired 401(k) participants held target-date funds, while 17 percent held non-target-date funds, and 2 percent held both target-date and non-target-date balanced funds (Figure 35). All of the increase in balanced fund use among recently hired participants between year-end 2008 and year-end 2009 resulted from increased use of target-date funds: At yearend 2008, 44 percent of recently hired 401(k) participants held target-date funds, 19 percent held non-target-date balanced funds, and 2 percent held both. Among those who held balanced funds, recently hired participants in 2009 were more likely to hold a high concentration of their accounts in balanced funds compared with past years. At year-end 2009, 61 percent of recently hired participants holding balanced funds had more than 90 percent of their account balance invested in balanced funds, compared with 56 percent in 2008, 48 percent in 2007, 43 percent in 2006, and 7 percent in 1998 (Figure 36). Concentration is highest among recently hired participants with target-date funds; at year-end 2009, 64 percent of recently hired participants holding target-date funds held more than 90 percent of their account balance in target-date funds (Figure 37). Forty-one percent of recently hired participants holding non-target-date balanced funds had more than 90 percent of their account balance invested in non-target-date balanced funds at year-end 2009. Balanced fund, target-date fund, and non-target-date balanced fund use varied somewhat by age group among recently hired participants, and recently hired participants in their 20s were more likely to be highly concentrated in such funds. For example, 43 percent of recently hired participants in their 20s held more than 90 percent of their account balances in balanced funds, compared with 34 percent of recent hires in their 40s and 31 percent of recent hires in their 60s in 2009 (Figure 38). Concentrated target-date fund use ranged from 33 percent of recent hires in their 20s holding more than 90 per-cent of their account balances in target-date funds to 25 percent of recently hired participants in their 60s with that concentration. In addition, at year-end 2009, 42 percent of the account balances of recently hired participants in their 20s was invested in balanced funds, compared with 36 percent in 2008, 28 percent in 2007, 24 percent in 2006, 19 percent in 2005, and about 7 percent among that age group in 1998 (Figure 39).53 At year-end 2009, among recently hired participants in their 20s, target-date funds accounted for 75 percent of their balanced fund assets, or ebri.org Issue Brief • November 2010 • No. 350
31
Figure 27 Asset Allocation Distribution of 401(k) Participant Account Balance to Equity Funds, by Participant Age, Tenure, or Salary Percentage of participants, 2009 Percentage of Account Balance Invested in Equity Funds Zero
1–20%
>20%–80%
>80%
All
44.8%
7.8%
31.8%
15.4%
Age Group 20s 30s 40s 50s 60s
60.0% 43.8% 39.7% 41.3% 47.8%
5.2% 6.7% 7.7% 9.5% 10.0%
22.2% 32.4% 34.9% 34.9% 29.3%
12.6% 17.0% 17.7% 14.3% 12.9%
Tenure (years) 0–2 >2–5 >5–10 >10–20 >20–30 >30
59.0% 50.1% 40.9% 34.7% 34.1% 41.3%
4.8% 5.7% 7.9% 9.8% 12.1% 12.6%
22.9% 29.2% 35.2% 37.7% 38.3% 33.1%
13.3% 15.0% 16.1% 17.7% 15.5% 13.0%
Salary $20,000–$40,000 >$40,000–$60,000 >$60,000–$80,000 >$80,000–$100,000 >$100,000
51.4% 40.1% 32.4% 26.6% 22.9%
9.2% 11.0% 11.5% 11.6% 12.4%
28.7% 35.7% 41.4% 46.3% 48.1%
10.6% 13.1% 14.7% 15.5% 16.6%
So urce: Tabulatio ns fro m EB RI/ICI P articipant-Directed Retirement P lan Data Co llectio n P ro ject. No te: Ro w percentages may no t add to 100 percent because o f ro unding. "Equity funds” include mutual funds, bank co llective trusts, life insurance separate acco unts, and any po o led investment pro duct primarily invested in sto cks. The tenure variable is generally years wo rking at current emplo yer, and thus may o verstate years o f participatio n in the 401(k) plan.
Figure g 28 Percentage of 401(k) Plan Participants Without Equity Fund Balances Who Have Equity Exposure, by Participant Age and Tenure, 2009 Percentage of Participants Without Equity Funds Non-target-date Company stock
Target-date fundsb
balanced funds
Combination of Company stock
and/or
as only
as only equity
as only
company stock and/or target-date funds,b and/or
balanced fundsa
equity investment
investment
equity investment
non-target-date balanced funds
Age Group 20s 30s 40s 50s 60s All
77.4% 75.4% 71.7% 67.9% 60.5% 70.9%
47.7% 43.4% 36.8% 30.8% 23.9% 36.9%
8.0% 5.9% 5.5% 5.1% 5.6% 6.0%
5.4% 8.9% 12.0% 14.9% 17.4% 11.6%
16.3% 17.2% 17.4% 17.0% 13.5% 16.4%
Tenure (years) 0–2 >2–5 >5–10 >10–20 >20–30 >30 All
78.0% 70.9% 71.4% 67.8% 60.9% 55.9% 70.9%
52.5% 40.2% 29.4% 22.9% 16.6% 13.6% 36.9%
7.5% 7.0% 5.3% 5.4% 5.9% 5.4% 6.0%
3.5% 4.5% 17.2% 22.0% 21.8% 23.0% 11.6%
14.6% 19.2% 19.6% 17.5% 16.6% 13.9% 16.4%
Source: Tabulations from EBRI/ICI Participant-Directed Retirement Plan Data Collection Project. a
Components may not add to the total in the first column because of rounding.
b
A target-date fund typically rebalances its portfolio to become less focused on growth and more focused on income as it approaches and passes the target date of the fund, which is usually included in the fund's name. Note: “Funds” include mutual funds, bank collective trusts, life insurance separate accounts, and any pooled investment product primarily invested in the security indicated. The tenure variable is generally years working at current employer, and thus may overstate years of participation in the 401(k) plan.
ebri.org Issue Brief • November 2010 • No. 350
32
ebri.org Issue Brief • November 2010 • No. 350
33
15.5% 14.8% 12.0% 9.6% 8.4% 6.8% 10.6%
24.2%
10.6%
24.2%
49.0% 45.5% 34.1% 26.5% 16.9% 10.4%
20.6% 15.2% 12.2% 9.9% 7.7%
50.1% 41.7% 30.4% 21.3% 14.6%
Non-Target-date Balanced Funds
11.9%
8.9% 8.4% 11.4% 11.6% 12.1% 12.5%
11.9%
5.4% 8.0% 10.2% 12.5% 14.6%
Bond Funds
10.7%
7.1% 9.2% 11.3% 11.2% 10.4% 12.3%
10.7%
5.4% 8.1% 9.5% 10.9% 13.1%
Money Funds
24.8%
11.7% 11.9% 17.1% 21.6% 29.6% 37.9%
24.8%
8.2% 11.7% 17.9% 25.8% 34.2%
Value Funds
GICsb/Stable-
12.1%
5.5% 6.6% 9.1% 12.9% 15.4% 14.5%
12.1%
7.1% 10.0% 13.3% 13.6% 10.6%
Company Stock
4.0%
1.0% 1.8% 2.9% 4.4% 5.5% 4.6%
4.0%
1.1% 2.8% 4.3% 4.4% 4.0%
Other
1.7%
1.4% 1.9% 2.2% 2.1% 1.7% 1.1%
1.7%
2.1% 2.4% 2.1% 1.6% 1.2%
Unknown
Source: Tabulations from EBRI/ICI Participant-Directed Retirement Plan Data Collection Project. a A target-date fund typically rebalances its portfolio to become less focused on growth and more focused on income as it approaches and passes the target date of the fund, which is usually included in the fund’s name. b GICs are guaranteed investment contracts. c Row percentages may not add up to 100 percent because of rounding. Percentages are dollar-weighted averages. d The analysis includes the 9.3 million participants with no equity funds at year-end 2009. Note: “Funds” include mutual funds, bank collective trusts, life insurance separate accounts, and any pooled investment product primarily invested in the security indicated. The tenure variable is generally years working at current employer, and thus may overstate years of participation in the 401(k) plan.
Tenure (years) 0–2 >2–5 >5–10 >10–20 >20–30 >30 Alld
Age Group 20s 30s 40s 50s 60s Alld
Target-Date Fundsa
Percentage of account balances, 2009
Figure 29 Average Asset Allocation for 401(k) Plan Participants Without Equity Fund Balances, by Participant Age or Tenure
100%
100% 100% 100% 100% 100% 100%
100%
100% 100% 100% 100% 100%
Totalc
31 percent of their account balances overall. The increase in asset allocation to balanced funds occurred in the targetdate fund category: Target-date fund assets accounted for 23 percent of the account balance assets of recently hired participants in their 20s at year-end 2008 (non-target-date funds were 13 percent at year-end 2008 and 10 percent at year-end 2009).54 The pattern of target-date and non-target-date fund use varied with participant age and lineup of plan investment options. Comparing recently hired participants in 2009 with their similar age groups in 1998 also illustrates that asset allocation to company stock and equity funds tended to be lower in 2009 than in 1998, while asset allocation to fixed-income securities tended to increase (Figure 39). Recently hired 401(k) participants tended to be less likely to hold company stock (Figure 40) and tended not to hold a high concentration of their account balance in company stock (Figures 41 and 42).55
Year-End 2009 Snapshot of 401(k) Plan Loan Activity Availability and Use of 401(k) Plan Loans by Plan Size Sixty-one percent of the 401(k) plans for which loan data were available in the 2009 EBRI/ICI 401(k) database offered a plan loan provision to participants (Figure 43).56 The loan feature was more commonly associated with large plans (as measured by the number of participants in the plan). Ninety-four percent of plans with more than 10,000 participants included a loan provision, compared with 35 percent of plans with 10 or fewer participants. There is modest variation in participant loan activity by plan size, ranging from 17 percent of participants with loans outstanding in 401(k) plans with 26–100 participants to 23 percent of participants in 401(k) plans with more than 5,000 participants (Figure 44). Loan ratios vary only slightly when participants are grouped based on the size of their 401(k) plans (as measured by the number of plan participants). Among participants in plans with 100 or fewer participants, the loan ratio was 18 percent of the remaining assets in 2009, while in plans with more than 10,000 participants, the loan ratio was 15 percent (Figure 45). In the 14 years that the database has been tracking loan activity among 401(k) plan participants, there has been little variation. From 1996 through 2008, on average, less than one-fifth of 401(k) participants with access to loans had a loan outstanding. At year-end 2009, the percentage of participants offered loans with loans outstanding ticked up to 21 percent. However, not all participants have access to 401(k) plan loans—factoring in all 401(k) participants with and without loan access in the database, only 19 percent had a loan outstanding at year-end 2009.57 On average, over the past 14 years, among participants with loans outstanding, about 14 percent of the remaining account balance was taken out as a loan (Figure 46). U.S. Department of Labor data indicate that loan amounts tend to be a negligible portion of plan assets and that very little of loan amounts gets converted into distributions in any given year (meaning that most loans are repaid).58
401(k) Plan Loan Activity Varies W/with Participant Age, Tenure, Account Balance, and Salary In the 2009 EBRI/ICI 401(k) database, 89 percent of participants were in plans offering loans. However, as has been the case for the 14 years that the database has tracked 401(k) plan participants, relatively few participants made use of this borrowing privilege. Nevertheless, loan activity ticked up in 2009. At year-end 2009, 21 percent of those eligible for loans had 401(k) plan loans outstanding (Figure 46). As in previous years, loan activity varies with age, tenure, account balance, and salary. Of those participants in plans offering loans, the highest percentages of participants with outstanding loan balances were among participants in their 30s, 40s, or 50s (Figure 47). In addition, participants with five or fewer years of tenure or with more than 30 years of tenure were less likely to use the loan provision than other participants. Only 16 percent of participants with account balances of less than $10,000 had loans outstanding.
Average Loan Balances Among participants with outstanding 401(k) loans at the end of 2009, the average unpaid balance was $7,346, compared with $7,191 in the year-end 2008 database (Figure 48). The median loan balance outstanding was $3,972 at year-end 2009, compared with $3,889 in the year-end 2008 database. With account balances generally higher on
ebri.org Issue Brief • November 2010 • No. 350
34
average in 2009 compared with 2008, the ratio of the loan outstanding to the remaining account balance edged down in 2009 (Figures 46 and 49). In addition, as in previous years, there is variation around this average that corresponds with age (lower the older the participant), tenure (lower the higher the tenure of the participant), account balance (lower the higher the account balance),59 and salary (lower the higher the participant’s salary). Overall, loans from 401(k) plans tended to be small, with the vast majority of 401(k) participants in all age groups having no loan at all (Figure 50).
ebri.org Issue Brief • November 2010 • No. 350
35
Figure 30 Asset Allocation to Equities Varied Widely Among Participants Asset allocation distribution of 401(k) participant account balance to equities,a by age, percentage of participants,b 2009 Percentage of Account Balance Invested in Equities Age Group
Zero
1–20%
>20–40%
>40–60%
>60–80%
>80–100%
20s
13.6%
3.3%
3.6%
6.5%
18.8%
54.2%
30s
10.8%
4.2%
5.3%
9.0%
19.8%
51.0%
40s
11.2%
5.4%
6.3%
10.4%
27.4%
39.2%
50s
13.3%
7.8%
8.6%
18.2%
26.2%
26.0%
60s
18.9%
10.4%
12.9%
20.3%
15.2%
22.3%
All
13.1%
6.0%
7.1%
12.4%
22.8%
38.6%
Source: Tabulations from EBRI/ICI Participant-Directed Retirement Plan Data Collection Project. a Equities include equity funds, company stock, and the equity portion of balanced funds. “Funds” include mutual funds, bank collective trusts, life insurance separate accounts, and any pooled investment product primarily invested in the security indicated. b Participants include the 20.7 million 401(k) plan participants in the year-end 2009 EBRI/ICI 401(k) database. Note: Row percentages may not add to 100 percent because of rounding.
Figure 31 Asset Allocation Distribution of 401(k) Participant Account Balance to Balanced Funds, by Age Percentage of 401(k) Participants,a,b 2009 Age Group
Percentage of Account Balance Invested in Balanced Funds Zero
1–10%
11–20%
21–30%
31–40%
41–50%
51–60%
61–70%
71–80%
20s
39.5%
4.4%
3.9%
3.5%
2.2%
2.2%
3.1%
1.7%
1.7%
1.6%
36.1%
30s
46.4%
6.8%
5.8%
5.1%
3.1%
2.6%
2.7%
1.7%
1.7%
1.5%
22.7%
40s
50.5%
7.6%
6.0%
5.4%
3.3%
2.7%
2.5%
1.5%
1.5%
1.3%
17.5%
50s
53.1%
7.7%
5.8%
5.4%
3.4%
2.7%
2.5%
1.5%
1.4%
1.3%
15.3%
60s
59.0%
6.8%
4.7%
4.5%
2.9%
2.5%
2.2%
1.3%
1.2%
1.1%
13.8%
All
50.0%
6.9%
5.5%
4.9%
3.1%
2.6%
2.6%
1.5%
1.5%
1.4%
20.1%
Zero
1–10%
11–20%
21–30%
31–40%
41–50%
51–60%
61–70%
71–80%
20s
56.2%
2.5%
2.1%
2.0%
1.4%
1.4%
2.2%
1.2%
1.3%
1.4%
28.5%
30s
63.3%
4.1%
3.0%
2.6%
1.7%
1.6%
1.8%
1.2%
1.3%
1.2%
18.2%
40s
68.4%
4.5%
2.9%
2.6%
1.7%
1.5%
1.5%
1.0%
1.1%
1.0%
13.8%
50s
71.2%
4.6%
2.7%
2.4%
1.6%
1.4%
1.4%
0.9%
0.9%
0.9%
11.9%
60s
75.8%
3.9%
2.1%
1.9%
1.3%
1.2%
1.1%
0.7%
0.8%
0.8%
10.5%
All
67.4%
4.1%
2.7%
2.4%
1.6%
1.5%
1.6%
1.0%
1.1%
1.0%
15.8%
Zero
1–10%
11–20%
21–30%
31–40%
41–50%
51–60%
61–70%
71–80%
20s
80.9%
3.5%
2.6%
1.9%
1.0%
0.8%
0.9%
0.5%
0.4%
0.3%
7.2%
30s
79.9%
4.8%
3.7%
2.8%
1.4%
1.0%
0.9%
0.5%
0.4%
0.3%
4.2%
40s
79.2%
5.1%
4.0%
3.3%
1.6%
1.2%
1.0%
0.5%
0.4%
0.3%
3.4%
50s
79.0%
5.1%
4.0%
3.4%
1.8%
1.3%
1.1%
0.5%
0.4%
0.3%
3.1%
60s
80.9%
4.4%
3.3%
2.9%
1.7%
1.3%
1.1%
0.5%
0.4%
0.3%
3.0%
All
79.8%
4.7%
3.6%
3.0%
1.5%
1.1%
1.0%
0.5%
0.4%
0.3%
4.0%
Percentage of Account Balance Invested in Target-date Funds c
Age Group
Age Group
81–90% 91–100%
81–90% 91–100%
Percentage of Account Balance Invested in Non-Target-date Balanced Funds 81–90% 91–100%
So urce: Tabulatio ns fro m EB RI/ICI P articipant-Directed Retirement P lan Data Co llectio n P ro ject. a
The analysis includes the 20.7 millio n 401(k) plan participants in the year-end 2009 EB RI/ICI 401(k) database. may no t add up to 100 percent because o f ro unding.
b Ro w percentages aA
target-date fund typically rebalances its po rtfo lio to beco me less fo cused o n gro wth and mo re fo cused o n inco me as it appro aches and passes the target date o f the fund, which is usually included in the fund’ s name. No te: “ Funds” include mutual funds, bank co llective trusts, life insurance separate acco unts, and any po o led investment pro duct primarily invested in the security indicated.
ebri.org Issue Brief • November 2010 • No. 350
36
ebri.org Issue Brief • November 2010 • No. 350
37
Zero 53.4% 62.9% 70.7% 75.4% 78.9% 81.4% 67.4%
Zero 83.5% 79.6% 78.6% 77.3% 77.1% 79.1% 79.8%
Tenure (years) 0–2 >2–5 >5–10 >10–20 >20–30 >30 All
Tenure (years) 0–2 >2–5 >5–10 >10–20 >20–30 >30 All
1–10% 2.7% 4.0% 5.1% 6.0% 6.5% 6.0% 4.7%
1–10% 2.6% 3.3% 4.4% 5.2% 5.5% 5.2% 4.1%
1–10% 4.0% 5.5% 7.4% 9.0% 9.8% 9.2% 6.9%
11–20% 2.1% 3.4% 4.1% 4.5% 4.5% 3.9% 3.6%
11–20% 2.3% 2.6% 2.9% 2.9% 2.8% 2.3% 2.7%
11–20% 3.7% 5.0% 6.1% 6.5% 6.5% 5.6% 5.5%
51–60% 3.3% 2.8% 2.6% 2.4% 2.1% 1.9% 2.6%
61–70% 1.7% 1.8% 1.6% 1.4% 1.2% 1.1% 1.5%
31–40% 1.5% 1.7% 1.8% 1.6% 1.4% 1.2% 1.6%
41–50% 1.6% 1.7% 1.6% 1.3% 1.1% 1.0% 1.5%
51–60% 2.5% 1.8% 1.5% 1.1% 1.0% 0.8% 1.6%
61–70% 1.2% 1.3% 1.1% 0.8% 0.6% 0.5% 1.0%
21–30% 1.6% 2.7% 3.4% 3.8% 3.6% 3.2% 3.0%
31–40% 0.8% 1.3% 1.7% 2.0% 2.1% 1.9% 1.5%
Row percentages may not add up to 100 percent because of rounding.
41–50% 0.7% 1.0% 1.2% 1.4% 1.4% 1.3% 1.1%
51–60% 0.8% 1.0% 1.1% 1.2% 1.1% 1.0% 1.0%
61–70% 0.4% 0.5% 0.5% 0.5% 0.5% 0.5% 0.5%
Percentage of Account Balance Invested in Non-Target-date Balanced Funds
21–30% 2.3% 2.5% 2.6% 2.4% 2.2% 1.8% 2.4%
71–80% 0.4% 0.5% 0.4% 0.4% 0.4% 0.4% 0.4%
71–80% 1.4% 1.4% 1.2% 0.8% 0.6% 0.5% 1.1%
71–80% 1.7% 1.9% 1.6% 1.3% 1.1% 1.0% 1.5%
81–90% 0.3% 0.4% 0.4% 0.3% 0.3% 0.3% 0.3%
81–90% 1.3% 1.4% 1.1% 0.8% 0.6% 0.5% 1.0%
81–90% 1.6% 1.7% 1.5% 1.2% 1.0% 0.9% 1.4%
91–100% 6.7% 5.6% 3.4% 2.5% 2.3% 2.3% 4.0%
91–100% 29.9% 19.4% 11.2% 7.6% 5.3% 4.7% 15.8%
91–100% 36.8% 25.5% 15.0% 10.4% 7.9% 7.1% 20.1%
A target-date fund typically rebalances its portfolio to become less focused on growth and more focused on income as it approaches and passes the target date of the fund, which is usually included
Note: “Funds” include mutual funds, bank collective trusts, life insurance separate accounts, and any pooled investment product primarily invested in the security indicated. The tenure variable is generally years working at current employer, and thus may overstate years of participation in the 401(k) plan.
in the fund’s name.
a
b
a
41–50% 2.3% 2.7% 2.8% 2.7% 2.5% 2.3% 2.6%
Percentage of Account Balance Invested in Target-date Funds c
31–40% 2.2% 2.9% 3.4% 3.5% 3.4% 3.1% 3.1%
Percentage of Account Balance Invested in Balanced Funds 21–30% 3.5% 4.7% 5.5% 5.8% 5.5% 4.7% 4.9%
Source: Tabulations from EBRI/ICI Participant-Directed Retirement Plan Data Collection Project. The analysis includes the 20.7 million 401(k) plan participants in the year-end 2009 EBRI/ICI database.
Zero 39.1% 45.4% 52.6% 55.8% 58.9% 63.2% 50.0%
Tenure (years) 0–2 >2–5 >5–10 >10–20 >20–30 >30 All
Percentage of Participants,a,b 2009
Figure 32 Asset Allocation Distribution of 401(k) Participant Account Balance to Balanced Funds, by Tenure
Age Group 20s 30s 40s 50s 60s All
Zero 60.3% 49.0% 44.9% 42.9% 46.6% 47.7%
11–20% 7.2% 9.7% 10.1% 10.1% 8.8% 9.4%
31–40% 3.5% 5.0% 5.3% 5.2% 4.4% 4.9%
41–50% 4.9% 4.5% 4.4% 4.1% 3.5% 4.3%
51–60% 2.1% 2.6% 3.0% 3.0% 2.7% 2.7%
61–70% 1.0% 1.5% 1.9% 2.0% 1.8% 1.7%
Percentage of Account Balance Invested in Company Stock 21–30% 5.3% 7.8% 8.0% 7.9% 7.0% 7.4%
b
71–80% 0.7% 1.1% 1.4% 1.5% 1.4% 1.2%
Figure 33 Asset Allocation Distribution 401(k) of Participant Account Balance to of 401(k) Company Stock in 401(k) Plans With Company Stock, by Age Percentage of 401(k) Participants,a,b 2009
1–10% 11.0% 14.3% 15.9% 17.3% 16.1% 15.2%
may no t add up to 100 percent because o f ro unding.
Figure 34 a
So urce: Tabulatio ns fro m EB RI/ICI P articipant-Directed Retirement P lan Data Co llectio n P ro ject. analysis includes the 9.5 millio n participants in plans with co mpany sto ck at year-end 2009.
a The
1998 27.0% 29.0% 30.5% 30.9% 28.4% 28.9%
1999 28.3% 31.0% 33.6% 34.9% 34.9% 31.3%
2000 27.1% 28.3% 30.8% 32.1% 33.2% 29.1%
2001 27.3% 26.5% 27.9% 29.2% 29.1% 27.4%
2002 32.7% 33.1% 33.7% 33.9% 30.2% 33.0%
2003 35.1% 36.2% 35.7% 35.5% 30.7% 35.4%
2004 38.9% 39.8% 39.8% 40.3% 36.3% 39.3%
2005 43.5% 42.8% 42.1% 43.3% 41.6% 42.8%
2006 48.5% 47.9% 46.6% 47.8% 45.5% 47.6%
2007 51.1% 54.2% 52.8% 53.4% 50.1% 52.7%
More Recently Hired 401(k) Plan Participants Tend To Hold Balanced Funds Percentage of recently hired 401(k) participants holding balanced funds, 1998–2009
b Ro w percentages
Age Group 20s 30s 40s 50s 60s All
2008 63.6% 59.6% 57.8% 58.0% 53.9% 59.9%
81–90% 0.5% 0.8% 1.0% 1.1% 1.1% 0.9%
2009 64.1% 61.2% 59.3% 58.7% 53.6% 60.9%
91–100% 3.4% 3.6% 4.2% 5.0% 6.5% 4.5%
funds” include mutual funds, bank co llective trusts, life insurance separate acco unts, and any po o led investment pro duct primarily invested in a mix o f
So urce: Tabulatio ns fro m EB RI/ICI P articipant-Directed Retirement P lan Data Co llectio n P ro ject. analysis includes participants with two o r fewer years o f tenure in the year indicated.
a The
equities and fixed-inco me securities.
b "B alanced
20s
46.6%
47.9%
48.5%
2006
50.1%
53.4%
52.8%
54.2%
51.1%
2007
59.9%
53.9%
58.0%
57.8%
59.6%
63.6%
2008
60.9%
53.6%
58.7%
59.3%
61.2%
64.1%
2009
28.3%
26.1%
28.1%
27.4%
28.5%
29.4%
2006
33.8%
32.1%
34.9%
34.2%
35.1%
31.7%
2007
43.6%
38.4%
42.2%
41.8%
43.5%
46.5%
2008
46.6%
41.0%
45.2%
45.5%
47.3%
48.5%
2009
21.9%
19.8%
21.4%
21.3%
22.5%
22.5%
2006
21.7%
20.3%
21.2%
21.4%
22.2%
21.8%
2007
18.7%
17.3%
18.1%
18.3%
18.8%
19.3%
2008
16.5%
14.2%
15.5%
16.1%
16.4%
17.7%
2009
a
Figure 35 Many Recently Hired 401(k) Plan Participants Hold Target-datea Funds Percentage of recently hired participants, 2006, 2007, 2008, and 2009
30s
47.8%
52.7%
Holding Non-Lifecycle Balanced Funds
40s
45.5%
Holding Lifecycle Funds
50s
47.6%
Holding Balanced Funds
60s
Age Group
All
ebri.org Issue Brief • November 2010 • No. 350
Source: Tabulations from EBRI/ICI Participant-Directed Retirement Plan Data Collection Project. A lifecycle fund typically rebalances to an increasingly conservative portfolio as it approaches and passes the target date of the fund, which is usually included in the fund's name. a
Note: The analysis includes the 2.8 million recently hired participants (those with two or fewer years of tenure) in 2006, the 3.8 million recently hired participants in 2007, the 4.0 million recently hired participants in 2008, and 3.1 million recently hired participantsin 2009. "Funds" include mutual funds, bank collective trusts, life insurance separate accounts, and any pooled investment product primarily invested in the security indicated.
38
Figure 36 Recently Hired 401(k) Participants Now Hold Higher Concentrations in Balanced Fundsa Percentage of recently hired participants holding balanced fund assets,a,b 1998, 2006, 2007, 2008, and 2009
Age Group 20s 30s 40s 50s 60s All
Percentage of Account Balance Invested in Balanced Funds 1998 >0–50 percent >50–90 percent >90 percent 84.9% 7.3% 7.8% 86.0% 7.6% 6.4% 84.1% 8.9% 7.0% 81.1% 10.7% 8.2% 77.0% 12.4% 10.6% 84.5% 8.2% 7.3%
Age Group 20s 30s 40s 50s 60s All
>0–50 percent 40.1% 47.7% 46.0% 43.3% 39.5% 43.9%
2006 >50–90 percent 13.7% 12.8% 13.1% 13.3% 12.6% 13.3%
>90 percent 46.2% 39.5% 40.9% 43.4% 47.9% 42.8%
Age Group 20s 30s 40s 50s 60s All
>0–50 percent 36.3% 40.9% 40.1% 38.1% 36.4% 38.8%
2007 >50–90 percent 14.7% 12.6% 12.9% 13.0% 12.8% 13.3%
>90 percent 49.0% 46.5% 47.0% 48.8% 50.8% 47.9%
Age Group 20s 30s 40s 50s 60s All
>0–50 percent 26.1% 33.5% 33.9% 32.8% 32.1% 31.0%
2008 >50–90 percent 11.8% 13.3% 13.5% 13.5% 12.8% 12.9%
>90 percent 62.2% 53.2% 52.6% 53.6% 55.1% 56.1%
Age Group 20s 30s 40s 50s 60s All
>0–50 percent 20.4% 27.8% 28.8% 28.7% 29.4% 25.9%
2009 >50–90 percent 13.3% 13.9% 13.9% 13.7% 13.3% 13.6%
>90 percent 66.3% 58.3% 57.4% 57.6% 57.3% 60.5%
Source: Tabulations from EBRI/ICI Participant-Directed Retirement Plan Data Collection Project. The analysis includes the 0.4 million recently hired participants (those with two or fewer years of tenure) holding balanced funds in 1998; the 1.4 million recently hired participants holding balanced funds in 2006; the 2.0 million recently hired participants holding balanced funds in 2007; the 2.4 million recently hired participants holding balanced funds in 2008; and the 1.9 million recently hired participants in 2009. a
b
Row percentages may not add to 100 percent because of rounding. Note: “Balanced funds” include mutual funds, bank collective trusts, life insurance separate accounts, and any pooled investment product primarily invested in a mix of equities and fixed-income securities.
ebri.org Issue Brief • November 2010 • No. 350
39
Figure 37 Many Recently Hired 401(k) Participants Hold High Concentrations in Target-date Fundsa Percentage of recently hired 401(k) participants holding the type of fund indicated, b, c 2009 Percentage of Account Balance Invested in Balanced Funds Age Group 20s 30s 40s 50s 60s All
>0–50 percent 20.4% 27.8% 28.8% 28.7% 29.4% 25.9%
>50–90 percent 13.3% 13.9% 13.9% 13.7% 13.3% 13.6%
>90 percent 66.3% 58.3% 57.4% 57.6% 57.3% 60.5%
Percentage of Account Balance Invested in Target-date Funds c Age Group 20s 30s 40s 50s 60s All
>0–50 percent 17.4% 23.9% 24.6% 24.4% 24.8% 22.1%
>50–90 percent 13.8% 14.1% 13.8% 13.5% 13.2% 13.8%
>90 percent 68.8% 62.0% 61.6% 62.1% 62.0% 64.1%
Percentage of Account Balance Invested in Non-Target-date Balanced Funds Age Group 20s 30s 40s 50s 60s All
>0–50 percent 39.4% 52.3% 52.9% 53.0% 52.7% 48.4%
>50–90 percent 10.5% 11.0% 11.5% 11.8% 11.6% 11.1%
>90 percent 50.1% 36.6% 35.6% 35.2% 35.7% 40.6%
Source: Tabulations from EBRI/ICI Participant-Directed Retirement Plan Data Collection Project. a
A target-date fund typically rebalances its portfolio to become less focused on growth and more focused on income as it approaches and passes the target date of the fund, which is usually included in the fund’s name. b The analysis includes the 1.9 million recently hired participants (those with two or fewer years of tenure) holding balanced funds in 2009, the 1.4 million recently hired participants holding target-date funds in 2009; and the 0.5 million recently hired participants holding non-target-date balanced funds in 2009. c Row percentages may not add to 100 percent because of rounding. Note: “Funds” include mutual funds, bank collective trusts, life insurance separate accounts, and any pooled investment product primarily invested in the security indicated.
ebri.org Issue Brief • November 2010 • No. 350
40
ebri.org Issue Brief • November 2010 • No. 350
41
Zero 51.5% 52.7% 54.5% 54.8% 59.0% 53.4%
Zero 82.3% 83.6% 83.9% 84.5% 85.8% 83.5%
Age Group 20s 30s 40s 50s 60s All
Age Group 20s 30s 40s 50s 60s All
1–10% 2.7% 3.0% 2.7% 2.5% 2.3% 2.7%
1–10% 2.1% 2.8% 2.8% 2.9% 2.9% 2.6%
1–10% 3.4% 4.3% 4.2% 4.2% 4.3% 4.0%
11–20% 1.8% 2.4% 2.3% 2.2% 1.9% 2.1%
11–20% 1.9% 2.6% 2.5% 2.4% 2.1% 2.3%
11–20% 3.1% 4.2% 4.0% 3.8% 3.4% 3.7%
31–40% 1.8% 2.4% 2.4% 2.5% 2.2% 2.2%
41–50% 1.9% 2.4% 2.4% 2.5% 2.3% 2.3%
61–70% 1.6% 1.8% 1.8% 1.7% 1.4% 1.7%
31–40% 1.2% 1.6% 1.6% 1.6% 1.5% 1.5%
41–50% 1.3% 1.7% 1.7% 1.7% 1.5% 1.6%
51–60% 3.0% 2.5% 2.3% 2.2% 1.9% 2.5%
61–70% 1.2% 1.3% 1.3% 1.2% 1.0% 1.2%
21–30% 1.2% 1.7% 1.9% 1.8% 1.7% 1.6%
31–40% 0.6% 0.8% 0.9% 0.9% 0.9% 0.8%
41–50% 0.6% 0.7% 0.7% 0.8% 0.8% 0.7%
51–60% 0.8% 0.7% 0.8% 0.8% 0.8% 0.8%
61–70% 0.4% 0.4% 0.4% 0.4% 0.4% 0.4%
Percentage of Account Balance Invested in Non-Target-date Balanced Funds
21–30% 1.8% 2.5% 2.5% 2.5% 2.2% 2.9%
71–80% 0.4% 0.4% 0.4% 0.3% 0.3% 0.4%
71–80% 1.3% 1.4% 1.4% 1.3% 1.2% 1.4%
71–80% 1.6% 1.8% 1.8% 1.7% 1.5% 1.7%
81–90% 0.3% 0.3% 0.3% 0.3% 0.2% 0.3%
81–90% 1.3% 1.4% 1.3% 1.3% 1.3% 1.3%
81–90% 1.5% 1.6% 1.5% 1.6% 1.5% 1.6%
91–100% 8.8% 6.0% 5.7% 5.5% 5.1% 6.7%
91–100% 33.4% 29.4% 28.0% 28.0% 25.4% 29.9%
91–100% 42.5% 35.7% 34.0% 33.8% 30.8% 36.8%
c
Row percentages may not add up to 100 percent because of rounding. A target-date fund typically rebalances its portfolio to become less focused on growth and more focused on income as it approaches and passes the target date of the fund, which is usually included in the fund’s name. Note: “Funds” include mutual funds, bank collective trusts, life insurance separate accounts, and any pooled investment product primarily invested in the security indicated.
b
a
51–60% 3.8% 3.3% 3.1% 3.0% 2.7% 3.3%
Percentage of Account Balance Invested in Target-date Fundsc
21–30% 2.8% 3.8% 4.0% 3.9% 3.5% 3.5%
Source: Tabulations from EBRI/ICI Participant-Directed Retirement Plan Data Collection Project. The analysis includes the 3.1 million recently hired participants (those with two or fewer years of tenure) in 2009.
Zero 35.9% 38.8% 40.7% 41.3% 46.4% 39.1%
Age Group 20s 30s 40s 50s 60s All
Percentage of Account Balance Invested in Balanced Funds
Percentage of Recently Hired 401(k) Participants,a,b 2009
Asset Allocation Distribution of Account Balance to Balanced Funds Among Recently Hired 401(k) Participants, by Age
Figure 38
Figure 39 Average Asset Allocation of 401(k) Accounts by Participant Age a and Investment Options Among Participants With Two or Fewer Years of Tenure Percentage of account balances,b 1998 and 2009 Balanced Funds Equity Age
Funds
Total
Target-date Non-Target-date fundsc balanced funds
Bond
Money
GICsd and Other
Company
Funds
Funds
Stable-Value Funds
Stock
Group
1998
2009
1998
2009
2009
2009
1998
2009
1998
2009
1998
2009
1998
2009
ALL 20s 30s 40s 50s 60s All
66.9% 67.8% 64.5% 60.5% 50.0% 64.8%
35.0% 41.2% 41.1% 35.8% 30.9% 38.2%
7.4% 8.0% 9.7% 11.3% 12.1% 9.1%
41.5% 33.7% 30.5% 29.2% 24.8% 31.7%
31.3% 25.0% 21.7% 19.8% 15.6% 22.6%
10.2% 8.7% 8.8% 9.4% 9.2% 9.1%
5.1% 5.1% 5.9% 6.6% 8.7% 5.7%
8.2% 9.5% 10.1% 11.9% 13.2% 10.4%
4.0% 4.1% 5.1% 5.9% 7.8% 4.9%
3.1% 3.7% 4.1% 5.0% 6.0% 4.3%
3.7% 3.2% 4.4% 6.7% 13.3% 4.6%
3.5% 4.2% 6.4% 10.4% 17.2% 7.5%
10.5% 9.4% 8.0% 6.5% 5.7% 8.6%
6.1% 4.8% 5.1% 5.1% 5.2% 5.2%
9.1% 7.9% 9.5% 11.9% 19.2% 10.1%
7.3% 9.1% 13.7% 19.1% 23.9% 14.4% 29.5% 24.6% 22.6% 19.4% 19.3% 24.1%
11.7% 11.0% 12.0% 12.4% 12.2% 11.8%
22.0% 20.6% 17.3% 14.5% 10.7% 18.6%
14.1% 11.3% 11.6% 11.8% 11.8% 11.9%
PLANS WITHOUT COMPANY STOCK, GICs,d OR OTHER STABLE-VALUE FUNDS 20s 77.8% 40.6% 7.8% 40.8% 35.3% 5.5% 7.7% 10.9% 30s 77.9% 46.4% 8.4% 32.1% 26.8% 5.3% 7.2% 12.9% 40s 74.0% 46.6% 9.9% 29.8% 23.7% 6.2% 8.3% 14.2% 50s 70.3% 41.4% 11.3% 29.9% 23.1% 6.8% 10.0% 17.6% 60s 59.4% 37.5% 11.8% 27.4% 19.4% 8.0% 13.5% 21.1% All 75.0% 43.9% 9.3% 31.5% 25.4% 6.1% 8.2% 14.8%
4.9% 4.9% 4.8% 5.6% 6.0% 6.4% 6.5% 8.3% 12.2% 10.5% 5.7% 6.7%
PLANS WITH GICsd AND/OR OTHER STABLE-VALUE FUNDS 20s 73.4% 34.2% 7.3% 46.4% 27.8% 18.6% 30s 73.5% 38.8% 8.1% 40.4% 23.5% 17.0% 40s 69.0% 38.8% 9.4% 35.9% 19.0% 16.9% 50s 63.6% 34.0% 10.2% 33.6% 15.6% 18.1% 60s 52.7% 30.8% 11.2% 29.5% 11.9% 17.6% All 69.7% 36.2% 7.9% 36.8% 19.4% 17.4%
3.9% 4.1% 5.0% 5.9% 6.8% 5.0%
8.2% 6.9% 6.8% 8.0% 9.3% 7.5%
2.9% 2.8% 3.4% 4.6% 7.2% 3.5%
1.7% 2.3% 2.7% 3.4% 5.1% 2.9%
PLANS WITH COMPANY STOCK 20s 51.8% 33.0% 6.1% 30s 56.0% 41.0% 6.6% 40s 54.4% 41.1% 8.2% 50s 53.2% 35.0% 9.8% 60s 47.2% 28.6% 11.1% All 54.2% 37.9% 7.2%
5.0% 5.3% 6.5% 6.9% 14.3% 6.3%
9.2% 11.2% 12.7% 16.8% 21.8% 13.2%
5.4% 5.2% 6.4% 8.6% 6.4% 6.1%
3.8% 4.9% 5.6% 7.2% 9.7% 5.7%
PLANS WITH COMPANY STOCK AND GICsd AND/OR OTHER STABLE-VALUE FUNDS 20s 56.2% 30.2% 8.2% 40.5% 28.4% 12.0% 2.3% 4.7% 30s 56.3% 36.5% 8.9% 33.5% 25.0% 8.5% 2.6% 6.3% 40s 53.8% 36.6% 11.0% 29.4% 21.9% 7.5% 2.8% 6.9% 50s 49.3% 31.7% 13.8% 26.4% 19.6% 6.8% 3.3% 7.5% 60s 38.0% 26.0% 14.3% 19.9% 14.8% 5.2% 2.6% 7.1% All 54.1% 33.5% 10.1% 29.8% 22.0% 7.8% 2.4% 6.6%
2.5% 3.3% 5.0% 5.3% 4.9% 2.4%
1.7% 1.6% 1.8% 2.3% 2.0% 1.9%
38.5% 28.6% 25.3% 24.8% 21.5% 27.8%
32.8% 23.0% 20.9% 20.7% 17.0% 22.9%
5.8% 5.5% 4.5% 4.0% 4.5% 4.9%
6.7% 5.9% 7.8% 11.8% 27.8% 10.1%
6.5% 8.1% 11.1% 17.7% 30.9% 13.6%
Source: Tabulations from EBRI/ICI Participant-Directed Retirement Plan Data Collection Project. The analysis is based on samples of 1.2 million participants with two or fewer years of tenure in 1998 and 3.1 million participants with two or fewer years of tenure in 2009.
a b
Minor investment options are not shown; therefore, row percentages will not add to 100 percent. Percentages are dollar-weighted averages.
a
A target-date fund typically rebalances its portfolio to become less focused on growth and more focused on income as it approaches and passes the target date of the fund, which is usually included in the fund’s name. d GICs are guaranteed investment contracts. Note: “Funds” include mutual funds, bank collective trusts, life insurance separate accounts, and any pooled investment product primarily invested in the security indicated.
ebri.org Issue Brief • November 2010 • No. 350
42
Figure 40 Recently Hired 401(k) Plan Participants Are Less Likely to Hold Company Stock Percentage of recently hired 401(k) participants offered and holding company stock, by participant age,1998–2009 Age Group
1998
1999
2000
2001
2002
2003
2004
2005
2006
2007
2008
2009
20s
60.8%
61.1%
60.5%
58.1%
53.9%
49.6%
49.8%
45.4%
40.0%
35.4%
32.9%
32.3%
30s
61.9%
62.3%
61.6%
60.0%
57.2%
53.3%
52.3%
47.6%
43.6%
40.4%
37.4%
36.2%
40s
59.8%
60.6%
59.5%
58.8%
55.9%
52.6%
52.0%
47.3%
43.6%
40.7%
37.9%
37.0%
50s
57.6%
58.8%
57.4%
57.9%
53.9%
51.2%
49.5%
45.2%
42.3%
39.6%
37.8%
37.6%
60s
54.1%
55.5%
53.6%
55.7%
51.0%
49.5%
47.8%
43.9%
40.4%
38.4%
38.7%
40.5%
All
60.5%
61.0%
60.0%
58.7%
55.3%
51.6%
51.0%
46.3%
42.0%
38.7%
36.2%
35.5%
Source: Tabulations from EBRI/ICI Participant-Directed Retirement Plan Data Collection Project. Note: The analysis includes 401(k) plan participants with two or fewer years of tenure in the year indicated and in a plan offering company stock as an investment option.
Figure 41 New 401(k) Participants Tend Not to Hold High Concentrations in Company Stock Percentage of 401(k) recently hired participants offered company stock holding the percentage of their account balance indicated in company stock, 1998–2009
25 %
23.8%
23.2%
22.7%
21.3%
Share of Participant's Account Balance Held in Company Stock
20 %
13.5
15 %
11.6
12.9
16.7%
>90% 15.9% 14.6%
12.4 8.4
7.5
6.4
>50-90%
11.2%
10%
9.3% 5.5
7.9%
8.1%
8.0%
4
4.3
3.9
3.9
3.8
4.1
2007
2008
2009
4.5 5%
8.9
10.3
11.1
10.3
8.4
8.3
8.2 5.7
4.8
0% 1998
1999
2000
2001
2002
2003
2004
2005
2006
Source: Tabulations from EBRI/ICI Participant-Directed Retirement Plan Data Collection Project. Note: The analysis includes 401(k) plan participants with two or fewer years of tenure in the year indicated and in a plan offering company stock as an investment option.
Figure 42 Asset Allocation Distribution of Recently Hired 401(k) Participant Account Balance to Company Stock in 401(k) Plans With Company Stock, by Participant Age Percentage of recently hired 401(k) participants in plans offering company stock as an investment option, a,b 2009 Age Group 20s 30s 40s 50s 60s All
Percentage of Account Balance Invested in Company Stock Zero 67.7% 63.8% 63.0% 62.4% 59.5% 64.5%
1–10% 6.2% 8.0% 8.2% 8.8% 10.3% 7.7%
11–20% 5.0% 6.5% 6.5% 6.7% 7.0% 6.0%
21–30% 4.3% 5.4% 5.6% 5.5% 5.0% 5.1%
31–40% 3.2% 3.8% 4.0% 3.9% 3.8% 3.7%
41–50% 6.1% 4.9% 4.5% 4.2% 3.8% 5.0%
51–60% 1.8% 2.0% 2.2% 2.2% 2.3% 2.0%
61–70% 0.8% 0.9% 1.0% 1.0% 1.2% 0.9%
71–80% 0.6% 0.7% 0.7% 0.7% 0.8% 0.6%
81–90% 0.4% 0.5% 0.5% 0.5% 0.9% 0.5%
91–100% 3.8% 3.6% 4.0% 4.2% 5.4% 3.9%
So urce: Tabulatio ns fro m EB RI/ICI P articipant-Directed Retirement P lan Data Co llectio n P ro ject. analysis includes the 1.3 millio n participants with two o r fewer years o f tenure in 2009 and in plans o ffering co mpany sto ck as an investment o ptio n.
a The
b Ro w percentages
may no t add up to 100 percent because o f ro unding.
ebri.org Issue Brief • November 2010 • No. 350
43
Figure 43 Percentage of 401(k) Plans Offering Loans, by Plan Size, 2009
88%
88%
94%
91%
90%
83% 80% 75% 70% 61%
59%
35%
Number of Participants in Plan Source: Tabulations from EBRI/ICI Participant-Directed Retirement Plan Data Collection Project.
Figure 44 Percentage of Eligible 401(k) Plan Participants With 401(k) Loans, by Plan Size, 2009 23%
23%
22% 21% 19% 18%
18% 17%
18%
19%
18%
17%
Number of Participants in Plan Source: Tabulations from EBRI/ICI Participant-Directed Retirement Plan Data Collection Project.
ebri.org Issue Brief • November 2010 • No. 350
44
Figure 45 Loan Balances as a Percentage of 401(k) Account Balances for Participants With 401(k) Loans, by Plan Size, 2009 18% 16%
15% 15%
1–100
101–250
251–500
501–1,000
15%
14%
1,001–2,500
15%
15%
>10,000
All Plans
14%
2,501–5,000
5,001–10,000
Number of Participants in Plan Source: Tabulations from EBRI/ICI Participant-Directed Retirement Plan Data Collection Project.
Figure 46 Few 401(k) Participants Had Outstanding 401(k) Loans; Loans Tended to Be Small, 1996–2009 Percentage of eligible 401(k) participants with outstanding 401(k) loans Loan as a percentage of the remaining 401(k) account balance
21%
18%
18%
18%
18%
18%
19%
19%
18%
18%
18%
17% 16%
16%
16%
16%
16%
15%
15% 14%
14%
14%
14% 13%
13%
13% 12%
1996
1997
1998
1999
2000
2001
2002
2003
2004
2005
2006
12%
2007
2008
2009
Source: Tabulations from the EBRI/ICI 401(k) Participant-Directed Retirement Plan Data Collection Project.
ebri.org Issue Brief • November 2010 • No. 350
45
Figure 47 Percentage of Eligible Participants With 401(k) Loans, by Participant Age, Tenure, Account Size, or Salary, Selected Years 1996
2000
2002
2005
2007
2008
2009
All
18%
18%
17%
19%
18%
18%
21%
Age Group 20s 30s 40s 50s 60s
12% 20% 22% 17% 9%
11% 19% 21% 17% 9%
10% 18% 20% 17% 9%
11% 20% 22% 19% 10%
10% 20% 22% 19% 10%
10% 20% 22% 19% 11%
13% 23% 26% 22% 12%
Tenure (years) 0–2 >2–5 >5–10 >10–20 >20–30 >30
6% 15% 24% 27% 25% 13%
5% 14% 23% 26% 26% 16%
4% 12% 21% 26% 25% 15%
5% 14% 22% 26% 24% 17%
7% 15% 23% 26% 24% 17%
6% 15% 23% 26% 25% 18%
9% 17% 25% 29% 27% 19%
Account Size <$10,000 $10,000–$20,000 >$20,000–$30,000 >$30,000–$40,000 >$40,000–$50,000 >$50,000–$60,000 >$60,000–$70,000 >$70,000–$80,000 >$80,000–$90,000 >$90,000–$100,000 >$100,000–$200,000 >$200,000
12% 26% 26% 25% 24% 24% 23% 26% 23% 22% 22% 18%
11% 23% 25% 25% 25% 24% 24% 23% 23% 22% 20% 15%
11% 22% 22% 23% 23% 22% 22% 22% 21% 21% 19% 13%
12% 26% 27% 26% 25% 24% 23% 22% 21% 20% 18% 13%
11% 25% 26% 26% 26% 25% 24% 23% 23% 22% 19% 13%
12% 26% 26% 26% 25% 24% 23% 22% 21% 20% 18% 12%
16% 28% 28% 28% 27% 25% 25% 24% 23% 23% 19% 13%
Salary Range $40,000 or less >$40,000–$60,000 >$60,000–$80,000 >$80,000–$100,000 >$100,000
18% 20% 18% 17% 14%
17% 23% 23% 21% 16%
13% 21% 20% 17% 13%
19% 26% 24% 22% 16%
20% 28% 24% 21% 14%
19% 27% 24% 20% 14%
24% 30% 26% 23% 16%
Source: Tabulations from EBRI/ICI Participant-Directed Retirement Plan Data Collection Project. Note: The tenure variable is generally years working at current employer, and thus may overstate years of participation in the 401(k) plan.
ebri.org Issue Brief • November 2010 • No. 350
46
Figure 48 401(k) Loan Balances Average and median loan balances for 401(k) participants with loans, 1998–2009 Average
Median $7,292
$6,717
$6,815
$6,856 $6,644
$6,659
$6,839
$6,946
$7,495 $7,191
$7,346
$6,821
$4,400 $3,902
1998
$3,824
1999
2000
$3,700
$3,659
2001
2002
$3,832
2003
$4,089
$3,893
$4,167 $3,889
$3,972
$3,661
2004
2005
2006
2007
2008
2009
Source: Tabulations from EBRI/ICI Participant-Directed Retirement Plan Data Collection Project. Note: Average and median 401(k) loan amounts are calculated among participants with 401(k) loans.
ebri.org Issue Brief • November 2010 • No. 350
47
Figure 49 Loan Balances as a Percentage of 401(k) Account Balances for Participants With Loans, by Participant Age, Tenure, Account Size, or Salary, Selected Years 1996
2000
2002
2005
2007
2008
2009
All
16%
14%
16%
13%
12%
16%
15%
Age Group 20s 30s 40s 50s 60s
30% 22% 16% 12% 10%
30% 20% 15% 11% 9%
28% 22% 16% 12% 10%
24% 19% 13% 10% 8%
25% 19% 13% 10% 8%
29% 25% 18% 13% 11%
26% 22% 16% 12% 10%
Tenure (years) 0–2 >2–5 >5–10 >10–20 >20–30 >30
27% 24% 23% 15% 11% 7%
24% 25% 21% 14% 10% 8%
27% 25% 23% 16% 11% 10%
23% 21% 19% 13% 9% 8%
21% 22% 18% 13% 8% 7%
25% 26% 24% 17% 12% 9%
22% 23% 20% 16% 11% 9%
Account Size <$10,000 $10,000–$20,000 >$20,000–$30,000 >$30,000–$40,000 >$40,000–$50,000 >$50,000–$60,000 >$60,000–$70,000 >$70,000–$80,000 >$80,000–$90,000 >$90,000–$100,000 >$100,000–$200,000 >$200,000
39% 32% 28% 23% 22% 19% 16% 16% 14% 13% 10% 5%
39% 32% 28% 24% 21% 19% 17% 15% 14% 13% 9% 5%
37% 31% 28% 25% 22% 20% 18% 16% 15% 13% 10% 5%
35% 29% 25% 22% 20% 18% 16% 15% 14% 13% 9% 4%
36% 30% 26% 23% 21% 19% 17% 16% 14% 13% 10% 5%
39% 33% 29% 26% 24% 21% 19% 18% 16% 15% 11% 5%
39% 31% 27% 25% 22% 21% 19% 17% 16% 15% 11% 5%
Salary Range $40,000 or less >$40,000–$60,000 >$60,000–$80,000 >$80,000–$100,000 >$100,000
17% 17% 15% 14% 14%
19% 16% 13% 12% 10%
18% 16% 14% 12% 10%
18% 16% 13% 11% 9%
17% 15% 12% 11% 9%
21% 19% 17% 14% 11%
19% 17% 14% 12% 10%
Source: Tabulations from EBRI/ICI Participant-Directed Retirement Plan Data Collection Project. Note: The tenure variable is generally years working at current employer, and thus may overstate years of participation in the 401(k) plan.
Figure 50 Loans From 401(k) Plans Tend to Be Small Percentage of eligible participants, by age, 2009 Loan as a Percentage of Remaining Account Balance Zero (No Loan) 1–10% >10%–20% >20–30% >30–80% >80%
20s 87% 2% 2% 2% 5% 1%
Age Group 60s 40s 75% 88% 7% 5% 6% 2% 4% 1% 8% 3% 1% *
All 79% 6% 4% 3% 7% 1%
So urce: Tabulatio ns fro m EB RI/ICI P articipant-Directed Retirement P lan Data Co llectio n P ro ject. * Less than 0.5 percent. No te: Co lumn percentages may no t add to 100 percent because o f ro unding.
ebri.org Issue Brief • November 2010 • No. 350
48
Appendix This year’s update of the EBRI/ICI 401(k) database reported on a consistent group of participants, or longitudinal sample. This appendix includes additional information on the 2003–2009 consistent group (Figures A1–A5, which was discussed in conjunction with the main report). For completeness, it contains all of the usual annual updates for the older 1999–2009 consistent group of participants (Figures A3 and A6–A12). In addition, changes in asset allocation for a consistent group of participants with accounts at year-end 2008 and year-end 2009 are presented in Figures A13 and A14.
Comparison of 2003–2009 Consistent Group of 401(k) Participants to EBRI/ICI 401(k) Database About 3 in 10, or 4.3 million, of the 401(k) participants with accounts at the end of 2003 in the EBRI/ICI 401(k) database had accounts at the end of each year from 2003 through 2009.60 Figures A1 and A2 compare the age and tenure distributions of the 2003–2009 consistent group with the cross-sectional database. Figure A3 highlights the distribution of account balance sizes across the database at year-end 2009, the 2003–2009 consistent group, and the 1999–2009 consistent group. Figures A4 and A5 provide information on the asset allocation of participants in the 2003– 2009 consistent group by age.
Analysis of the 1999–2009 Consistent Group Participants’ Ages, Tenures, and Account Balances in the 1999–2009 Consistent Group About 16 percent, or 1.6 million, of the 401(k) participants with accounts at the end of 1999 in the database had accounts at the end of each year from 1999 through 2009.61 These 1.6 million 401(k) participants make up a group of consistent participants (or a longitudinal sample), which removes the effect of participants and plans entering and leaving the database. Initially, this group was demographically similar to the entire EBRI/ICI 401(k) database at yearend 1999. However, by year-end 2009, these participants had grown older (Figure A6), accrued longer job tenures (Figure A7), and accumulated larger account balances compared with the cross-section of participants in the entire year-end 2009 database (Figures A3 and A8). The 1999–2009 consistent group’s account balances highlight the accumulation effect of ongoing 401(k) participation. At year-end 2009, 21 percent of the consistent group had more than $200,000 in their 401(k) accounts at their current employers, while another 20 percent had between $100,000 and $200,000 (Figure A3). In contrast, in the broader database, 7 percent of participants had accounts with more than $200,000, and less than 10 percent had accounts between $100,000 and $200,000 (Figures A3 and 10). Reflecting their higher average age and tenure, the 1999–2009 consistent group also had median and average account balances that were much higher than the median and average account balances of the broader database (Figure A8). At year-end 2009, the average 401(k) account balance of the 1999–2009 consistent group was $131,438 (Figure A8), more than double the average account balance of $58,351 among participants in the entire database (Figure 9). The median 401(k) account balance among the consistent participants was $73,175 at year-end 2009 (Figure A8), more than four times the median account balance of $17,794 among participants in the entire database (Figure 9). At year-end 2009, 401(k) account balances varied with both age and tenure among the 1999–2009 consistent group of participants, as they do in the cross-sectional database. Younger participants or those with shorter job tenure tended to have smaller account balances, while those who were older or had longer job tenure tended to have higher account balances. For example, within the 1999–2009 consistent group, participants in their 30s at year-end 2009 had an average account balance of $64,688, compared with an average of $162,522 for participants in their 60s (Figure A9).
Changes in Participants’ Account Balances in the 1999–2009 Consistent Group In any given year, the change in a participant’s account balance is the sum of three factors: new contributions by the participant or the employer or both; total investment return on account balances, which depends on the performance of financial markets and on the allocation of assets in an individual’s account; and withdrawals, borrowing, and loan repayments. The change in any individual participant’s account balance is influenced by the magnitudes of these three factors relative to the starting account balance. For example, a contribution of a given dollar amount produces a larger
ebri.org Issue Brief • November 2010 • No. 350
49
growth rate when added to a smaller account. On the other hand, investment returns of a given percentage produce larger dollar increases (or decreases) when compounded on a larger asset base. All told, from year-end 1999 through year-end 2009, the average account balance among the group of consistent participants grew 95.0 percent, rising from $67,420 at year-end 1999 to $131,438 at year-end 2009 (Figures A8 and A10). This translates into an annual average growth rate of 6.9 percent over the 10-year period. The median account balance (or midpoint, with half above and half below) among this consistent group also grew, rising 199.5 percent from $24,435 in 1999 to $73,175 in 2009 (an annual average growth rate of 11.6 percent; Figure A8). Among the 1999–2009 consistent group, there was a wide range of individual participant experience, often influenced by the relationship among the three factors mentioned above: contributions, investment returns, and withdrawal and loan activity. Participants who were younger or had fewer years of tenure experienced the largest increases in average account balance between year-end 1999 and year-end 2009. For example, the average account balance of participants in their 30s rose 460.2 percent (an 18.8 percent annual average growth rate) between the end of 1999 and the end of 2009 (Figures A9 and A10). Because younger participants’ account balances tended to be small (Figure A9), contributions produced significant account balance growth. In contrast, the average account balance of older participants or those with longer tenures showed more modest growth (Figure A10). For example, the average account balance of participants in their 60s increased 46.2 percent (a 3.9 percent annual average growth rate) between yearend 1999 and year-end 2009. Investment returns, rather than annual contributions, generally account for most of the change in accounts with larger balances. In addition, participants in their 60s tend to have a higher propensity to make withdrawals.62 These changes in participant account balances also reflect changes in asset values during the 10-year time period (Figure 8). Although asset allocation varied with age and many participants held a range of investments, the impact of stock market performance showed through in 401(k) accounts because 401(k) plan participants tended to be heavily invested in equity securities. At year-end 2009, altogether, equity securities—equity funds, the equity portion of balanced funds,63 and company stock—represented 59 percent of the 1999–2009 consistent group of 401(k) plan participants’ assets (Figure A11). The asset allocation of participants in the consistent group varied with participant age, a pattern that is also observed in the cross-sectional EBRI/ICI 401(k) database. Younger participants generally tended to favor equity funds, while older participants were more likely to invest in fixed-income securities such as bond funds, GICs and other stable value funds, or money funds. Among individual 401(k) participants in the consistent group, the allocation of account balances to equities varied widely around the average of 59 percent for the 1999–2009 consistent group as a whole. Thirty-seven percent of participants in the 1999–2009 consistent group had more than 80 percent of their accounts invested in equities, while 13 percent held no equities at all in 2009 (Figure A12). The growth pattern of the 1999–2009 consistent group’s average account balances reflects stock market performance over the 10-year time period. The three-year bear market of 2000–2002 pulled 401(k) account balances down. Diversified portfolios and ongoing contributions64 helped offset the impact of the stock market decline. The average account among the consistent group of participants fell 7.0 percent between year-end 1999 and year-end 2002 (Figure A10), while the S&P 500 total return index fell 37.6 percent and the Russell 2000 Index fell 21.0 percent (Figure 8). Between year-end 2002 and year-end 2007, the S&P 500 total return index climbed 82.9 percent and the Russell 2000 Index more than doubled. The average account balance among the 1999–2009 consistent group of participants increased 127.6 percent between year-end 2002 and year-end 2007 (Figure A10). In 2008, as the S&P 500 total return index fell 37.0 percent and the Russell 2000 Index fell 33.8 percent, the average account balance among the 1999– 2009 consistent group of participants decreased 25.3 percent. As the stock market rose in 2009, the average account balance among the 1999–2009 consistent group increased 23.3 percent. The 1999–2009 consistent group’s average balance at year-end 2009 was up 95.0 percent compared with year-end 1999; over the 10-year period, the average account balance grew at an annual average rate of 6.9 percent.
ebri.org Issue Brief • November 2010 • No. 350
50
Figure A1 Age Distribution of 2003–2009 Consistent Group Percentage of 401(k) participants by age, year-end 2003 and year-end 2009 Age Group 20s
30s
40s
50s
60s
7%
4%
9%
14%
22%
23% 25% 35%
37%
32%
29%
33% 24%
27%
27%
18% 9%
11%
Consistent Group in 2003
EBRI/ICI 401(k) Database in 2003
13%
Consistent Group in 2009
EBRI/ICI 401(k) Database in 2009
Source: Tabulations from EBRI/ICI Participant-Directed Retirement Plan Data Collection Project. Note: The EBRI/ICI 401(k) database contains 15.0 million 401(k) plan participants at year-end 2003 and 20.7 million at year-end 2009. The consistent group consists of 4.3 million 401(k) plan participants with account balances at the end of each year from 2003 through 2009.
Figure A2 Tenure Distribution of 2003–2009 Consistent Group Percentage of 401(k) participants by years of tenure, year-end 2003 and year-end 2009 Tenure of Participant (years) 0–2
>2–5
5%
6%
14%
12%
>5–10
>10–20
>20–30
>30
11%
6% 11%
20% 26%
23%
23%
23%
41%
23%
23%
22%
22%
24% 27%
10%
12%
Consistent Group in 2003
EBRI/ICI 401(k) Database in 2003
16%
Consistent Group in 2009
EBRI/ICI 401(k) Database in 2009
Source: Tabulations form EBRI/ICI Participant-Directed Retirement Plan Data Collection Project. Note: The EBRI/ICI 401(k) database contains 15.0 million 401(k) plan participants at year-end 2003 and 20.7 million at year-end 2009. The consistent group consists of 4.3 million 401(k) plan participants with account balances at the end of each year from 2003 through 2009. Components may not add to 100 percent because of rounding.
ebri.org Issue Brief • November 2010 • No. 350
51
Figure A3 Distribution of 401(k) Account Balances, by Size of Account Balance Percentage of participants with account balances in specified ranges, 2009 38.9%
EBRI/ICI 401(k) Database a 2003–2009 Consistent Group b 1999–2009 Consistent Group
20.5%
20.3% 18.6%
c
15.4%
14.7% 14.1% 13.5% 9.8% 8.2% 8.3% 7.4% 6.6%
9.5% 7.1% 6.0% 5.8%
6.0% 5.4% 4.5%
5.2% 3.5%
7.1% 4.8%
4.5%
4.3%
2.9%
3.9% 3.9% 3.5% 3.5% 3.1% 3.1% 2.4% 2.0% 1.7%
Size of Account Balance Source: Tabulations from EBRI/ICI Participant-Directed Retirement Plan Data Collection Project. a The EBRI/ICI 401(k) database at year-end 2009 represents 20.7 million 401(k) plan participants; the median account balance in the database was $17,794 at year-end 2009. b The 2003–2009 consistent group represents the 4.3 million 401(k) plan participants with account balances at the end of each year from 2003 through 2009; the median account balance among the consistent group was $59,381 at year-end 2009. c The 1999–2009 consistent group represents the 1.6 million 401(k) plan participants with account balances at the end of each year from 1999 through 2009; the median account balance among the consistent group was $73,175 at year-end 2009. Note: Components may not add to 100 percent because of rounding.
Figure A4 Average Asset Allocation of 401(k) Accounts of 2003–2009 Consistent Group, by Participant Age Percentage of account balances,a 2009 Age Group
b
Equity Target-date Non-Target-date c Funds Funds Balanced Funds
Bond Funds
d Money GICs /Stable Funds Value Funds
Company Stock
Other
Unknown
e
Total
20s
46.6%
14.0%
6.2%
10.4%
4.6%
6.9%
9.3%
1.0%
0.9%
100%
30s
54.5%
8.6%
5.3%
10.7%
3.8%
5.2%
9.6%
1.3%
1.0%
100%
40s
50.3%
7.1%
5.7%
11.4%
4.1%
7.6%
11.2%
1.7%
0.8%
100%
50s
40.1%
6.9%
6.2%
13.7%
5.0%
12.8%
12.3%
2.3%
0.7%
100%
60s All consistent group
32.3%
6.3%
6.2%
16.7%
6.2%
19.9%
9.8%
2.0%
0.6%
100%
42.3%
6.9%
5.9%
13.5%
4.9%
12.6%
11.2%
1.9%
0.8%
100%
40.6%
9.5%
7.2%
11.4%
5.3%
12.6%
9.2%
2.7%
1.6%
100%
EBRI/ICI 401(k) Databasee
Source: Tabulations from EBRI/ICI Participant-Directed Retirement Plan Data Collection Project. a Row percentages may not add to 100 percent because of rounding. Percentages are dollar-weighted averages. b Age group is based on the participant's age at year-end 2009. Asset allocation by age group among the 2003–2009 consistent group of 4.3 million 401(k) plan participants with account balances at the end of each year from 2003 through 2009. c A target-date fund typically rebalances its portfolio to become less focused on growth and more focused on income as it approaches and passes the target date of the fund, which is usually included in the fund's name. d GICs are guaranteed investment contracts. e The year-end 2009 EBRI/ICI 401(k) database represents 20.7 million 401(k) participants. Note: "Funds" include mutual funds, bank collective trusts, life insurance separate accounts, and any pooled investment product primarily invested in the security indicated.
ebri.org Issue Brief • November 2010 • No. 350
52
ebri.org Issue Brief • November 2010 • No. 350
53
12.1% 7.6%
8.4% 11.5% 18.4% 11.5% 13.1%
40s
50s
60s All consistent groupb
EBRI/ICI 401(k) Databasee 7.1%
7.8%
11.5%
8.8%
6.4%
5.3%
6.1%
>20–40 percent
12.4%
13.7%
17.2%
16.4%
11.8%
10.5%
10.6%
>40–60 percent
22.8%
21.2%
15.3%
22.6%
23.5%
20.7%
20.4%
>60–80 percent
Percentage of Account Balance Invested in Equitiesa
38.6%
38.1%
25.6%
32.0%
44.3%
50.8%
45.0%
>80 percent
Row percentages may not add to 100 percent because of rounding.
Age group is based on the participant's age at year-end 2009. e The year-end 2009 EBRI/ICI 401(k) database represents 20.7 million 401(k) participants.
d
c
Source: Tabulations ffrom EBRI/ICI Collection Project. S / C Participant-Directed Retirement Plan Data C a Equities include equity funds, company stock, and the equity portion of balanced funds. “Funds” include mutual funds, bank collective trusts, life insurance separate accounts, and any pooled investment product. primarily invested in the security indicated. b Participants include the 4.3 million 401(k) plan participants with account balances at the end of each year from 2003 through 2009. Asset allocation is as of year-end 2009.
6.0%
8.8%
5.7%
4.3%
8.2%
4.7%
1–20 percent
30s
Zero 13.1%
20s
Age Group
d
Asset allocation distribution at year-end 2009 of 401(k) participant account balance to equities,a by age; percentage of participantsb, c
Asset Allocation to Equities Varied Widely Among Participants in the 2003–2009 Consistent Group
Figure A5
Figure A6 1999–2009 Consistent Group Was Older Than All Participants in EBRI/ICI 401(k) Database at Year-End 2009 Percentage of participants, by age, year-end 1999 and year-end 2009 Age Group 20s
30s
40s
50s
60s
6%
4%
9% 17%
16% 21%
25%
41%
39%
31% 29%
32%
30%
33%
24%
9%
12%
9%
13%
Consistent Group in 1999
EBRI/ICI 401(k) Database in 1999
Consistent Group in 2009
EBRI/ICI 401(k) Database in 2009
Source: Tabulations from EBRI/ICI Participant-Directed Retirement Plan Data Collection Project. Note: The EBRI/ICI 401(k) database contains 10.3 million 401(k) plan participants at year-end 1999 and 20.7 million at year-end 2009. The consistent group consists of 1.6 million 401(k) plan participants with account balances at the end of each year from 1999 through 2009. Components may not add to 100 percent because of rounding.
Figure A7 1999–2009 Consistent Group Had Longer Tenure Than All Participants in EBRI/ICI 401(k) Database at Year-End 2009 Percentage of participants, by years of tenure, year-end 1999 and year-end 2009 Tenure of Participant (years) 0–2
5% 16%
>2–5
>5–10
>10–20
>20–30
>30
6%
6% 12%
24%
18%
11%
23% 29%
30%
23%
20% 20% 21%
53%
22%
17%
13% Consistent Group in 1999
17%
EBRI/ICI 401(k) Database in 1999
16%
Consistent Group in 2009
EBRI/ICI 401(k) Database in 2009
Source: Tabulations from EBRI/ICI Participant-Directed Retirement Plan Data Collection Project. Note: The EBRI/ICI 401(k) database contains 10.3 million 401(k) plan participants at year-end 1999 and 20.7 million at year-end 2009. The consistent group consists of 1.6 million 401(k) plan participants with account balances at the end of each year from 1999 through 2009. Components may not add to 100 percent because of rounding.
ebri.org Issue Brief • November 2010 • No. 350
54
Figure A8 401(k) Account Balancesa Among 401(k) Participants Present From Year-End 1999 Through Year-End 2009b
$142,718 $131,438 $125,093
Average $106,563
$105,823 $94,956 $81,809 $67,420
$67,282
$66,734
1999
2000
2001
$62,695
2002
2003
2004
2005
2006
2007
2008
2009
Median (Mid-point)
$80,023 $73,175
$70,276 $58,868
$58,604 $51,702 $42,925 $24,435
1999
$27,737
$30,478
$30,708
2000
2001
2002
2003
2004
2005
2006
2007
2008
2009
Source: Tabulations from EBRI/ICI Participant-Directed Retirement Plan Data Collection Project. a Account balances are participant account balances held in 401(k) plans at the participants' current employers and are net of plan loans. Retirement savings held in plans at previous employers or rolled over into IRAs are not included. b The analysis is based on a group of 1.6 million participants with account balances at the end of each year from 1999 through 2009.
ebri.org Issue Brief • November 2010 • No. 350
55
b
Age Group 30s 40s
50s
a
60s
All
b
Tenure (years) All >10–20 All >10–20 >20–30 All >10–20 >20–30 >30 All >10–20 >20–30 >30 All 1999 $11,547 $12,480 $41,975 $32,686 $68,305 $73,784 $40,480 $100,811 $92,742 $111,143 $44,268 $116,356 $159,293 $67,420
2001 $17,106 $17,793 $44,014 $36,248 $65,785 $73,058 $44,640 $95,466 $90,043 $105,986 $49,586 $111,017 $145,806 $66,734
2002 $18,177 $18,714 $41,796 $35,070 $60,471 $68,467 $43,220 $87,492 $84,717 $98,664 $48,312 $102,307 $134,548 $62,695
2003 $27,708 $28,337 $58,198 $49,956 $81,162 $90,506 $59,740 $114,502 $109,274 $123,175 $65,305 $129,615 $163,137 $81,809
2004 $35,439 $36,082 $70,253 $61,140 $95,596 $106,235 $72,598 $133,098 $125,899 $138,114 $78,708 $147,416 $177,483 $94,956
2005 $42,870 $43,477 $80,883 $71,431 $107,154 $119,489 $84,379 $148,369 $138,865 $148,873 $90,389 $160,701 $186,018 $105,823
2006 $54,331 $54,944 $98,697 $87,981 $128,495 $142,640 $102,924 $176,236 $163,297 $169,525 $107,823 $184,876 $206,956 $125,093
Figure A9 Average Account Balances Among 401(k) Participants Present a b From Year-End 1999 Through Year-End 2009, by Age and Tenure 2000 $14,280 $15,081 $43,067 $34,448 $67,302 $73,989 $42,863 $98,786 $92,303 $108,789 $47,663 $114,222 $152,169 $67,282
Source: Tabulations from the EBRI/ICI Participant-Directed Retirement Plan Data Collection Project. The analysis is based on a group of 1.6 million participants with account balances at the end of each year from 1999 through 2009. Age and tenure groups are based on participant age and tenure at year-end 2009.
a b
b
b
Tenure (years) All >10–20 All >10–20 >20–30 All >10–20 >20–30 >30 All >10–20 >20–30 >30 All
1999–2002 57.4% 50.0% -0.4% 7.3% -11.5% -7.2% 6.8% -13.2% -8.7% -11.2% 9.1% -12.1% -15.5% -7.0%
2002–2007 260.0% 253.1% 176.3% 196.2% 144.8% 140.0% 179.2% 131.6% 119.8% 88.5% 154.9% 99.2% 65.7% 127.6%
2007–2008 -28.1% -28.3% -28.3% -28.6% -28.1% -25.1% -25.4% -25.8% -23.8% -23.2% -24.4% -24.4% -22.1% -25.3%
2008–2009 37.5% 37.4% 31.3% 33.1% 28.1% 24.4% 28.8% 24.1% 20.1% 13.7% 20.0% 14.4% 10.5% 23.3%
2007–2009 -1.1% -1.5% -5.9% -4.9% -7.9% -6.8% -3.9% -7.9% -8.5% -12.6% -9.3% -13.5% -13.9% -7.9%
2007 $65,438 $66,085 $115,498 $103,876 $148,020 $164,565 $120,673 $202,645 $186,200 $186,030 $123,142 $203,783 $223,003 $142,718
1999–2009 460.2% 421.6% 159.0% 202.1% 99.7% 107.8% 186.6% 85.1% 83.7% 46.2% 152.3% 51.5% 20.6% 95.0%
Figure A10 Percent Change in Average Account Balances Among 401(k) Participants Present From Year-End 1999 Through Year-End 2009 2009,a by Age and Tenureb Age Group 30s 40s
50s
60s
Alla
Source: Tabulations from the EBRI/ICI Participant-Directed Retirement Plan Data Collection Project. The analysis is based on a group of 1.6 million participants with account balances at the end of each year from 1999 through 2009. Age and tenure groups are based on participant age and tenure at year-end 2009. a
b
2008 $47,030 $47,387 $82,813 $74,214 $106,423 $123,273 $90,063 $150,400 $141,919 $142,944 $93,082 $154,149 $173,795 $106,563
2009 $64,688 $65,099 $108,716 $98,743 $136,379 $153,344 $116,009 $186,580 $170,384 $162,522 $111,689 $176,281 $192,032 $131,438
ebri.org Issue Brief • November 2010 • No. 350 56
ebri.org Issue Brief • November 2010 • No. 350
57
5.9% 9.5%
40.9% 31.4% 41.5% 40.6%
50s
60s
All consistent group EBRI/ICI 401(k) Databasee 7.2%
6.1%
6.1%
6.4%
6.0%
5.5%
11.4%
13.9%
17.0%
14.0%
11.2%
9.5%
Funds
Bond
14.9% 12.6%
5.3%
9.2%
10.1%
8.6%
10.6%
10.9%
9.9%
Stock
Company
2.7%
2.0%
2.0%
2.3%
1.9%
1.5%
Other
1.6%
0.6%
0.4%
0.6%
0.7%
0.8%
Unknown
Total
100%
100%
100%
100%
100%
100%
The year-end 2009 EBRI/ICI 401(k) database represents 20.7 million 401(k) participants.
13.1%
EBRI/ICI 401(k) Databasee
6.0%
13.4% 8.7%
7.1%
10.9% 7.9%
>20–40 percent 4.9% 6.1% 8.5%
22.8%
14.3% 19.9%
>60–80 percent 19.3% 22.7% 21.5%
38.6%
25.1% 36.9%
>80 percent 54.0% 46.2% 32.8%
include equity funds, co mpany sto ck, and the equity po rtio n o f balanced funds. “ Funds” include mutual funds, bank co llective trusts, life insurance separate acco unts, and any po o led investment pro duct primarily invested in the security indicated. b P articipants include the 1.6 millio n 401(k) plan participants with acco unt balances at the end o f each year fro m 1999 thro ugh 2009. A sset allo catio n is as o f year-end 2009. c Ro w percentages may no t add to 100 percent because o f ro unding. d A ge gro up is based o n the participant's age at year-end 2009. e The year-end 2009 EB RI/ICI 401(k) database represents 20.70 millio n 401(k) participants.
a Equities
12.4%
15.7% 13.5%
>40–60 percent 9.9% 11.6% 15.9%
Percentage of Account Balance Invested in Equities a 1–20 percent 4.0% 5.7% 9.3%
So urce: Tabulatio ns fro m EB RI/ICI P articipant-Directed Retirement P lan Data Co llectio n P ro ject.
20.6% 13.1%
Zero 7.9% 7.8% 12.0%
60s All consistent groupb
30s 40s 50s
Age Groupd
Asset allocation distribution at year-end 2009 of 401(k) participant account balance to equities, a by age and percentage of participants b,c
Figure A12 Asset Allocation to Equities Varied Widely Among Participants in the 1999–2009 Consistent Group
Note: "Funds" include mutual funds, bank collective trusts, life insurance separate accounts, and any pooled investment product primarily invested in the security indicated.
e
d
in the fund's name. GICs are guaranteed investment contracts.
a
Age group is based on the participant's age at year-end 2009. Asset allocation by age group among the consistent group of 1.6 million 401(k) plan participants with account balances at the end of each year from 1999 through 2009. A target-date fund typically rebalances its portfolio to become less focused on growth and more focused on income as it approaches and passes the target date of the fund, which is usually included
b
22.9%
13.8%
7.6%
4.9%
Value Funds
GICsd/Stable-
4.9%
6.1%
5.0%
4.2%
3.6%
Funds
Money
Source: Tabulations from EBRI/ICI Participant-Directed Retirement Plan Data Collection Project. a Row percentages may not add to 100 percent because of rounding. Percentages are dollar-weighted averages.
5.5%
6.3%
6.0%
51.5%
40s
7.0%
Target-date Non-Target-date Fundsc Balanced Funds
57.2%
Funds
Equity
30s
Age Group
b
Percentage of account balances, 2009
a
Figure A11 Average Asset Allocation of 401(k) Accounts of 1999–2009 Consistent Group, by Participant Age
Percentage of participants a
Figure A13 Changes in Consistent Participants' Investment in Equity Funds, 2008–2009
None 38.5 1.0 2.2 0.8 0.3 0.2 0.2 8.2
1–20% 0.6 6.2 0.8 0.3 0.2 0.1 0.1 9.4
21–40% 0.3 1.5 6.3 1.0 0.2 0.1 0.1 12.3
41–60% 0.3 0.3 2.1 8.2 1.1 0.2 0.1 11.8
61–80% 0.2 0.2 0.3 2.1 7.9 0.9 0.2
7.0
81–99% 0.1 0.1 0.1 0.2 1.3 4.8 0.4
8.0
100% 0.2 0.1 0.0 0.1 0.2 0.3 7.2
100.0
Total in 2008b 40.2 9.3 11.7 12.7 11.3 6.5 8.4
Percentage of Account Balance Invested in Equity Funds Percentage in 2009 None 1–20 21–40 41–60 61–80 81–99 100 43.2
Percentage of participants a
21–40% 0.5 1.1 6.5 0.9 0.1 0.0 * 9.1
41–60% 0.2 0.2 0.5 2.3 0.5 0.0 0.1 3.8
61–80% 0.1 0.0 0.1 0.2 0.7 0.2 * 1.4
Percentage of Account Balance Invested in Bond Funds Percentage in 2009 1–20% 1.5 11.9 1.7 0.2 0.0 0.0 * 15.3
81–99% 0.1 0.0 0.0 0.0 0.1 0.6 0.1 0.8
100% 0.2 0.1 * * * 0.1 2.6 3.0
Figure A14 Changes in Consistent Participants' Investment in Bond Funds, 2008–2009
None 62.0 3.7 0.4 0.2 0.1 0.1 0.1 66.5
Total in 2008b 64.6 16.9 9.3 3.8 1.5 1.0 2.9 100.0
Total in 2009c
None 1–20 21–40 41–60 61–80 81–99 100 Total in 2009c
Percentages across the row may not add–total because of rounding. c Percentages in column may not add–total because of rounding. * Less than 0.05 percent. Sum of shaded areas: 88.5 percent of participants. Note: "Bond funds” include mutual funds, bank collective trusts, life insurance separate accounts, and any pooled investment product primarily invested in bonds.
b
Source: Tabulations from EBRI/ICI Participant-Directed Retirement Plan Data Collection Project. Sample of 16.7 million participants with account balances at year-end 2008 and year-end 2009. a
b Percentages across the row may not add to total because of rounding. c Percentages in column may not add to total because of rounding. Sum of shaded areas: 86.1 percent of participants. Note: "Equity funds” include mutual funds, bank collective trusts, life insurance separate accounts, and any pooled investment product primarily invested in stocks.
Source: Tabulations from EBRI/ICI Participant-Directed Retirement Plan Data Collection Project. Sample of 16.7 million participants with account balances at year-end 2008 and year-end 2009.
a
in 2008 in 2008
58
ebri.org Issue Brief • November 2010 • No. 350
Percentage Percentage
References Barclays Capital U.S. Aggregate Bond Index. San Francisco, CA: Barclays Global Investors. Bloomberg Data. New York, NY: Bloomberg L.P. Bogdan, Michael, John Sabelhaus, and Daniel Schrass. “Ownership of Mutual Funds, Shareholder Sentiment, and Use of the Internet, 2010.” Investment Company Institute Fundamentals 19, no. 6 (September 2010). Available at www.ici.org/pdf/fm-v19n6.pdf Brady, Peter. “Measuring Retirement Resource Adequacy.” Journal of Pension Economics and Finance. (Published online by Cambridge University Press on September 8, 2008, doi:10.1017/S1474747208003806.) Available at http://journals.cambridge.org/action/displayAbstract?aid=2197036 Brady, Peter, Sarah Holden, and Erin Short. “The U.S. Retirement Market, Second Quarter 2010.” Investment Company Institute Fundamentals 19, no. 3-Q2 (October 2010). Available at www.ici.org/pdf/fm-v19n3-q2.pdf Cerulli Associates. “Retirement Markets 2009.” Cerulli Quantitative Update. Boston, MA: Cerulli Associates Inc., 2009. Choi, James J., David Laibson, Brigitte C. Madrian, and Andrew Metrick. “Defined Contribution Pensions: Plan Rules, Participant Decisions, and the Path of Least Resistance.” NBER Working Paper, no. 8655. Cambridge, MA: National Bureau of Economic Research, December 2001. Congressional Budget Office. CBO’s Long-Term Projections for Social Security: Additional Information. Washington, DC: Congressional Budget Office, October 2010. Available at www.cbo.gov/ftpdocs/119xx/doc11943/10-22SocialSecurity_chartbook.pdf Deloitte Consulting LLP, International Foundation, and the International Society of Certified Employee Benefit Specialists. Annual 401(k) Benchmarking Survey 2009 Edition. New York, NY: Deloitte Consulting LLP, 2009. Available at www.deloitte.com/assets/DcomUnitedStates/Local%20Assets/Documents/us_consulting_401(k)AnnualBenchmarkingSurvey2009_081409.pdf Employee Benefit Research Institute. “History of 401(k) Plans: An Update.” FACTS from EBRI. Washington, DC: Employee Benefit Research Institute, February 2005. Available at www.ebri.org/pdf/publications/facts/0205fact.a.pdf Fidelity Investments. “Impact of Market Volatility on Participant Exchange Behavior.” Building Futures: Impact of Market Volatility. Boston, MA: Fidelity Investments, 2008. Available at http://dcda.fidelity.com/static/dcle/WPSFidelityPerspectives/documents/MV_partbehavior_Final_121108_5.pdf Fidelity Investments. “Participants Continue to Stay the Course Amidst Market Downturn; Improvements Seen in Worker Engagement, Account Diversification and Company Stock Usage.” News release, January 28, 2009. Available at http://content.members.fi delity.com/Inside_Fidelity/fullStory/1,,7669,00.html Gustman, Alan L., and Thomas Steinmeier. “How Changes in Social Security Affect Recent Retirement Trends.” NBER Working Paper, no. 14105. Cambridge, MA: National Bureau of Economic Research, June 2008. Hewitt Associates. How Well Are Employees Saving in 401(k) Plans: 2009 Hewitt Universe Benchmarks. Lincolnshire, IL: Hewitt Associates LLC, 2009a. . Trends and Experience in 401(k) Plans. Lincolnshire, IL: Hewitt Associates LLC, 2009. Available at www.retirementmadesimpler.org/Library/Hewitt_Research_Trends_in_401k_Highlights.pdf . How Well Are Employees Saving and Investing in 401(k) Plans: 2010 Hewitt Universe Benchmarks. Lincolnshire, IL: Hewitt Associates LLC, 2010. Holden, Sarah. Defined Contribution Plan Participants’ Activities: First Half 2010. Washington, DC: Investment Company Institute, 2010. Available at www.ici.org/pdf/ppr_10_rec_survey-q2.pdf
ebri.org Issue Brief • November 2010 • No. 350
59
Holden, Sarah, Peter Brady, and Michael Hadley. “401(k) Plans: A 25-Year Retrospective.” Investment Company Institute Perspective 12, no. 2 (November 2006). Available at www.ici.org/pdf/per12-02.pdf Holden, Sarah, John Sabelhaus, and Brian Reid. Enduring Confidence in the 401(k) System: Investor Attitudes and Actions. Washington, DC: Investment Company Institute (January 2010). Available at www.ici.org/pdf/ppr_10_ret_saving.pdf Holden, Sarah, and Jack VanDerhei. “401(k) Plan Asset Allocation, Account Balances, and Loan Activity in 1999.” Investment Company Institute Perspective 7, no. 1 (January 2001a), and EBRI Issue Brief, no. 230 (February 2001a). Available at www.ici.org/pdf/per07-01.pdf and www.ebri.org/pdf/briefspdf/0201ib.pdf . “The Impact of Employer-Selected Investment Options on 401(k) Plan Participants’ Asset Allocations: Preliminary Findings.” Working paper prepared for the Center for Pension and Retirement Research (CPRR) Current Pension Policy Issues Conference, at Miami University, Oxford, OH, June 8–9, 2001b. . “Contribution Behavior of 401(k) Plan Participants.” Investment Company Institute Perspective 7, no. 4, and EBRI Issue Brief, no. 238 (October 2001c). Available at www.ici.org/pdf/per07-04.pdf and
www.ebri.org/pdf/briefspdf/1001ib.pdf
. “Can 401(k) Accumulations Generate Significant Income for Future Retirees?” Investment Company Institute Perspective 8, no. 3, and EBRI Issue Brief, no. 251 (November 2002). Available at www.ici.org/pdf/per08-03.pdf
and www.ebri.org/pdf/briefspdf/1102ib.pdf
. “401(k) Plan Asset Allocation, Account Balances, and Loan Activity in 2002.” Investment Company Institute Perspective 9, no. 5, and EBRI Issue Brief, no. 261 (September 2003). Available at www.ici.org/pdf/per09-05.pdf
and www.ebri.org/pdf/briefspdf/0903ib.pdf
. “401(k) Plan Asset Allocation, Account Balances, and Loan Activity in 2003.” Investment Company Institute Perspective 10, no. 2, and EBRI Issue Brief, no. 272 (August 2004a). Available at www.ici.org/pdf/per10-02.pdf
and www.ebri.org/pdf/briefspdf/0804ib1.pdf
. “Appendix: Additional Figures for the EBRI/ICI Participant-Directed Retirement Plan Data Collection Project for Year-End 2003.” Investment Company Institute Perspective 10, no. 2A (August 2004b). Available at www.ici.org/pdf/per10-02_appendix.pdf . “Contribution Behavior of 401(k) Plan Participants During Bull and Bear Markets.” National Tax Association Proceedings, Ninety-Sixth Annual Conference on Taxation, November 13–15, 2003, Chicago, IL: 44–53. Washington, DC: National Tax Association, 2004c.
. “The Influence of Automatic Enrollment, Catch-Up, and IRA Contributions on 401(k) Accumulations at Retirement.” Investment Company Institute Perspective 11, no. 2, and EBRI Issue Brief, no. 283 (July 2005). Available at www.ici.org/pdf/per11-02.pdf and www.ebri.org/pdf/briefspdf/ebri_ib_07-20054.pdf Holden, Sarah, Jack VanDerhei, and Luis Alonso. “401(k) Plan Asset Allocation, Account Balances, and Loan Activity in 2008.” Investment Company Institute Perspective 15, no. 2, and EBRI Issue Brief, no. 3354 (October 2009). Available at www.ici.org/pdf/per15-02.pdf and www.ebri.org/pdf/briefspdf/EBRI_IB_10-2009_No335_K-Update.pdf Holden, Sarah, Jack VanDerhei, Luis Alonso and Craig Copeland. “401(k) Plan Asset Allocation, Account Balances, and Loan Activity in 2007.” Investment Company Institute Perspective 14, no. 3, and EBRI Issue Brief, no. 324 (December 2008). Available at www.ici.org/pdf/per14-03.pdf and www.ebri.org/pdf/briefspdf/EBRI_IB_12a2008.pdf Holden, Sarah, Jack VanDerhei, and Carol Quick. “401(k) Plan Asset Allocation, Account Balances, and Loan Activity in 1998.” Investment Company Institute Perspective 9, no. 5 (January2000), and EBRI Issue Brief, no. 218 (February 2000). Available at www.ici.org/pdf/per06-01.pdf and www.ebri.org/pdf/briefspdf/0200ib.pdf Investment Company Institute. Quarterly Supplementary Data. Washington, DC: Investment Company Institute. . “Americans Committed to Saving for Retirement: ICI Year-End Data.” News Release (April 26, 2010). Available at www.ici.org/pressroom/news/10_news_trow_am_saves
ebri.org Issue Brief • November 2010 • No. 350
60
Morningstar. Ibbotson SBBI 2009 Classic Yearbook: Market Results for Stocks, Bonds, Bills, and Inflation 1926–2008. Chicago, IL: Morningstar Inc., 2009. Poterba, James, Steven F. Venti, and David A. Wise. “Rise of 401(k) Plans, Lifetime Earnings, and Wealth at Retirement.” NBER Working Paper, no. 13091. Cambridge, MA: National Bureau of Economic Research, May 2007. Profit Sharing/401k Council of America. 53rd Annual Survey of Profit Sharing and 401(k) Plans Reflecting 2009 Plan Experience. Chicago, IL: Profit Sharing/401k Council of America, 2010. Russell 2000 Index. Tacoma, WA: Frank Russell Company. S&P 500. New York, NY: Standard & Poor’s. U.S. Department of Labor, Bureau of Labor Statistics. National Compensation Survey: Employee Benefits in Private Industry in the United States, March 2007. Washington, DC: U.S. Department of Labor, Bureau of Labor Statistics, 2007. Available at www.bls.gov/ncs/ebs/sp/ebsm0006.pdf . “Employee Benefits in the United States, March 2008.” News release, August 7, 2008a. Available at www.bls.gov/news.release/archives/ebs2_08072008.pdf . National Compensation Survey: Employee Benefits in Private Industry in the United States, March 2008. Washington, DC: U.S. Department of Labor, Bureau of Labor Statistics, 2008b. Available at www.bls.gov/ncs/ebs/benefits/2008/ownership/private/table02a.pdf . National Compensation Survey: Employee Benefits in Private Industry in the United States, March 2009. Washington, DC: U.S. Department of Labor, Bureau of Labor Statistics, 2009. Available at www.bls.gov/ncs/ebs/benefits/2009/ownership/private/table02a.pdf . “Employee Benefits in the United States, March 2010.” News release, July 27, 2010a. Available at www.bls.gov/news.release/pdf/ebs2.pdf . National Compensation Survey: Employee Benefits in Private Industry in the United States, March 2010. Washington, DC: U.S. Department of Labor, Bureau of Labor Statistics, 2010b. Available at www.bls.gov/ncs/ebs/benefits/2010/ownership/private/table02a.pdf . “The Employment Situation, October 2010” (2010c). Economic News Release, November 5, 2010c. Washington, DC: U.S. Department of Labor, Bureau of Labor Statistics. Available at www.bls.gov/news.release/empsit.t17.htm U.S. Government Accountability Office. “401(k) Pension Plans: Loan Provisions Enhance Participation but May Affect Income Security for Some.” Letter Report, GAO-HEHS-98-5. Washington, DC: U.S. Government Accountability Office, October 1997. Available at www.gao.gov/archive/1998/he98005.pdf U.S. Internal Revenue Service. “Notice of Proposed Rule Making, Certain Cash or Deferred Arrangements Under Employee Plans.” Federal Register 46, no. 217, November 10, 1981: 55544–55549. U.S. Joint Committee on Taxation. Technical Explanation of H.R. 4, the “Pension Protection Act of 2006” as Passed by the House on July 28, 2006, and as Considered by the Senate on August 3, 2006. JCX-38-06 (August 3). Washington, DC: U.S. Joint Committee on Taxation, 2006. Available at www.jct.gov/x-38-06.pdf VanDerhei, Jack L. Company Stock in 401(k) Plans: Results of a Survey of ISCEBS Members. Washington, DC: Employee Benefit Research Institute, 2002. Available at www.ebri.org/pdf/iscebs.pdf VanDerhei, Jack, and Craig Copeland. “The Impact of PPA on Retirement Savings for 401(k) Participants.” EBRI Issue Brief, no. 318 (Employee Benefit Research Institute, June 2008). Available at www.ebri.org/pdf/briefspdf/ebri_ib_06-20087.pdf
ebri.org Issue Brief • November 2010 • No. 350
61
VanDerhei, Jack. “The Impact of Automatic Enrollment in 401(k) Plans on Future Retirement Accumulations: A Simulation Study Based on Plan Design Modifications of Large Plan Sponsors.” EBRI Issue Brief, no. 341 (Employee Benefit Research Institute, April 2010). Available at www.ebri.org/pdf/briefspdf/EBRI_IB_04-2010_No341_AutoEnrll.pdf VanDerhei, Jack, and Lori Lucas. “The Impact of Auto-enrollment and Automatic Contribution Escalation on Retirement Income Adequacy.” EBRI Issue Brief, no. 349 (Employee Benefit Research Institute, November 2010). Available
at www.ebri.org/pdf/briefspdf/EBRI_IB_011-2010_No349_EBRI_DCIIA.pdf Utkus, Stephen P., and Jean A. Young. Resilience in volatile markets: 401(k) participant behavior September 2007– December 2009. Valley Forge, PA: The Vanguard Group, Vanguard Center for Retirement Research, March 2010. Available at https://institutional.vanguard.com/iam/pdf/CRRRES.pdf The Vanguard Group. How America Saves 2009: A Report on Vanguard 2008 Defined Contribution Plan Data. Valley Forge, PA: The Vanguard Group, Vanguard Center for Retirement Research, 2009. Available at https://institutional.vanguard.com/iam/pdf/HAS09.pdf . How America Saves 2010: A Report on Vanguard 2009 Defined Contribution Plan Data. Valley Forge, PA: The Vanguard Group, Vanguard Center for Retirement Research, 2009. Available at https://institutional.vanguard.com/iam/pdf/HAS.pdf?cbdForceDomain=true
Endnotes 1
For data on 401(k) plan assets, participants, and plans through 2007, see U.S. Department of Labor, Employee Benefits Security Administration, 2010b. For total retirement assets, including those in 401(k) plans, through the second quarter of 2010, see Brady, Holden, and Short, 2010. For a discussion of trends between defined benefit (DB) and defined contribution (DC) plans, see Poterba, Venti, and Wise, 2007 and Holden, Brady, and Hadley, 2006. 2
Prior to 2005, the U.S. Department of Labor Private Pension Plan Bulletin updates reported a count of active 401(k) plan participants that had been adjusted from the number of active participants that was actually reported in the Form 5500 filings to exclude: (1) individuals eligible to participate in a 401(k) plan who had not elected to have their employers make contributions; and (2) nonvested former employees who had not (at the time the Form 5500s were submitted) incurred the break in service period established by their plan (see U.S. Department of Labor, Employee Benefits Security Administration, 2008a and 2008b for further detail). This change in methodology results in a dramatic increase in the number of individuals reported as active participants in 401(k) plans; in 2004, the number of active participants increased to 53.1 million (new method) from 44.4 million (old method; see U.S. Department of Labor, Employee Benefits Security Administration, 2008b and 2010b). As the Department of Labor notes: “In a purely economic sense and for research purposes, individuals in these groups should not be included in the count of active participants.” However, the form schedule needed to make the adjustment is no longer required. Using National Compensation Survey data and historical relationships and trends evident in the Form 5500 data, ICI estimates the number of active 401(k) participants to be 49.0 million in 2009 and the number of 401(k) plans to be 497,000. The estimate of the number of active 401(k) plan participants is based on a combination of data from U.S. Department of Labor, Bureau of Labor Statistics, 2007, 2008a, 2008b, 2009, 2010a, 2010b, and 2010c; and U.S. Department of Labor, Employee Benefits Security Administration, 2008a, 2008b, 2010a, and 2010b. 3
See Brady, Holden, and Short, 2010.
4
The Employee Benefit Research Institute (EBRI) is a nonprofit, nonpartisan, public policy research organization that does not lobby or take positions on legislative proposals.
5
The Investment Company Institute (ICI) is the national association of U.S. investment companies, including mutual funds, closed-end funds, exchange-traded funds (ETFs), and unit investment trusts (UITs). ICI seeks to encourage adherence to high ethical standards, promote public understanding, and otherwise advance the interests of funds, their shareholders, directors, and advisers. Members of ICI manage total assets of $12.05 trillion and serve more than 90 million shareholders (see Bogdan, Sabelhaus, and Schrass, 2010). ebri.org Issue Brief • November 2010 • No. 350
62
6
This update extends previous findings from the project for 1996 through 2008. For year-end 2008 results, see Holden, VanDerhei, and Alonso, 2009. Results for earlier years are available in earlier issues of Investment Company Institute Perspective (www.ici.org/perspective/index.html) and EBRI Issue Brief (www.ebri.org/ publications/ib). 7
The EBRI/ICI 401(k) database environment is certified to be fully compliant with the ISO-27002 Information Security Audit standard. Moreover, EBRI has obtained a legal opinion that the methodology used meets the privacy standards of the GrammLeach-Bliley Act. At no time has any nonpublic personal information that is personally identifiable, such as Social Security Number, been transferred to or shared with EBRI. 8
Account balances are net of unpaid loan balances. Thus, unpaid loan balances are not included in any of the eight asset categories described.
9
The cross-sectional analysis for this publication found that consolidating the multiple accounts to the single individual owning them resulted in an overall increase of 7.0 percent in the average 401(k) account balance. This statistic should be interpreted with caution, as it may not represent the total 401(k) assets owned by the individual. The impact of account consolidation varied with the participant’s age and tenure with the current employer. The largest increases in average account balance occurred among older participants with fewer years of tenure. For example, among participants in their 60s with two or fewer years of tenure, the average account balance increased 26 percent with the consolidation of their multiple accounts. Among participants in their 50s or 60s with more than 30 years of tenure, the average account balance increased 4 percent with the consolidation of their multiple accounts. Future joint research with this new feature will explore the longitudinal aspects of this consolidation in more detail. 10
This system of classification does not consider the number of distinct investment options presented to a given participant, but rather the types of options presented. Preliminary research analyzing 1.4 million participants drawn from the 2000 EBRI/ICI 401(k) database suggests that the sheer number of investment options presented does not influence participants. On average, participants have 10.4 distinct options but, on average, choose only 2.5 (Holden and VanDerhei, 2001b). In addition, the preliminary analysis found that 401(k) participants are not naïve—that is, when given “n” options, they do not divide their assets among all “n.” Indeed, less than 1 percent of participants followed a “1/n” asset allocation strategy. Profit Sharing/401k Council of America 2010 indicates that in 2009, the average number of investment fund options available for participant contributions was 18 among the 931 plans surveyed; Hewitt Associates, 2009, indicates an average number of investment options of 20 in 2009. Deloitte Consulting LLP, International Foundation of Employee Benefit Plans, and the International Society of Certified Employee Benefit Specialists, 2009, report that the average number of funds offered by the 606 401(k) plan sponsors in their survey was 20 in 2008.
11
The asset allocation path that the target-date fund follows to shift its focus from growth to income over time is typically referred to as the “glide path.” Since discussions of asset allocation usually focus on the percentage of the portfolio invested in equities, the glide path generally reflects the declining percentage of equities in the portfolio as it approaches and passes the target date, which is usually indicated in the fund’s name. The target date generally is the date at which the typical investor for whom that fund is designed would reach retirement age and stop making new investments in the fund. 12
Lifestyle funds maintain a predetermined risk level and generally use words such as “conservative,” “moderate,” or “aggressive” in their name to indicate the fund’s risk level. Lifestyle funds generally are included in the non-target-date balanced fund category. 13
GICs are insurance company products that guarantee a specific rate of return on the invested capital over the life of the contract. 14
Other stable value funds include synthetic GICs, which consist of a portfolio of fixed-income securities “wrapped” with a guarantee (typically by an insurance company or a bank) to provide benefit payments according to the plan at book value.
15
Some recordkeepers supplying data were unable to provide complete asset allocation detail on certain pooled asset classes for one or more of their clients. The final EBRI/ICI 401(k) database includes only plans for which at least 90 percent of all plan assets could be identified.
16
For 401(k) asset figures, see Brady, Holden, and Short, 2010.
ebri.org Issue Brief • November 2010 • No. 350
63
17
Estimates of the number of 401(k) plans and active participants are based on a combination of data from U.S. Department of Labor, Bureau of Labor Statistics, and U.S. Department of Labor, Employee Benefits Security Administration reports. See discussion in endnote 2.
18
Automatic enrollment tends to reduce the average tenure of participants in the 401(k) plan. Profit Sharing/401k Council of America, 2010, reported a leveling out in the incidence of automatic enrollment in 2009, following several years of a rising trend. Of more than 900 plans surveyed 38.4 percent had automatic enrollment in 2009, compared with 39.6 percent of plans in 2008, 35.6 percent of plans in 2007, about 17 percent of plans in 2005, and 10.5 percent of plans in 2004. Eighty-four percent of plans with automatic enrollment in 2009 applied automatic enrollment only to new hires, while 16 percent applied automatic enrollment to all nonparticipants.
19
Because of these changes in the cross-sections, comparing average account balances across different year-end crosssectional snapshots can lead to false conclusions. For example, newly formed plans would tend to pull down the average account balance, but would tell us nothing about consistently participating workers. Similarly, the aggregate average account balance would tend to be pulled down if a large number of participants retire and roll over their account balances.
20
About half of traditional IRA assets resulted from rollovers from employer-sponsored retirement plans. See Brady, Holden, and Short, 2010.
21
Account balances are net of unpaid loan balances.
22
See Figures A6 and A7 in the appendix, which compare the age and tenure composition of the 1999–2009 group to the year-end cross-sectional EBRI/ICI 401(k) database.
23
The value of this percentage is lower than it would have been if it were merely reflecting employee turnover and retirement. The EBRI/ICI 401(k) database has added data providers since 2003, and, by definition, participants in these plans would not be included in the consistent group. Moreover, any time a 401(k) plan sponsor changed service providers, all participants in the plan would be excluded from the consistent group. For the year-end 2003 EBRI/ICI 401(k) database update, see Holden and VanDerhei, 2004a and 2004b.
24
See Figures A1 and A2 in the appendix for the age and tenure distribution of the 2003–2009 consistent group of participants compared with the age and tenure distribution of the year-end 2003 and year-end 2009 EBRI/ICI 401(k) database. 25
See Figures A4 and A5 in the appendix for asset allocation information for the 2003–2008 consistent group of participants.
26
The distribution of account balances across the 2003–2009 consistent group also highlights their higher accumulations. At year-end 2009, 15.4 percent of the consistent group had more than $200,000 in their 401(k) accounts at their current employers, while another 18.6 percent had between $100,000 and $200,000 (see Figure A3 in the Appendix). In contrast, in the broader EBRI/ICI 401(k) database, 7.1 percent of participants had accounts with more than $200,000, and 9.5 percent had accounts between $100,000 and $200,000 (see Figures 10 and A3). 27
For statistics indicating the higher propensity of withdrawals among participants in their60s, see Holden and VanDerhei, 2002. 28
At year-end 2009, 62 percent of balanced mutual fund assets were invested in equities (see Investment Company Institute, Quarterly Supplementary Data).
29
See Figure A4 in the Appendix for the average dollar-weighted asset allocation of the 2003–2009 consistent group of participants by age. In addition, as observed in the cross-sectional EBRI/ICI 401(k) database, among individual 401(k) participants in the 2003–2009 consistent group, the allocation of account balances to equities varied widely around the average of 61 percent for the consistent group as a whole. Thirty-eight percent of participants in the consistent group had more than 80 percent of their accounts invested in equities, while almost 12 percent held no equities at all in 2009 (see Figure A5). 30
See total returns for the large company stock index reported in Morningstar, 2010.
ebri.org Issue Brief • November 2010 • No. 350
64
31
Analysis of contribution activity of 401(k) plan participants in 2009 in the EBRI/ICI401(k) database has not been conducted. However, results from an ICI survey of DC plan recordkeepers found that only 3.4 percent of participants stopped contributing to their accounts in 2009 (see Holden, 2010). In addition, analysis of contribution activity during the bear market of 2000– 2002 using the cross-sectional EBRI/ICI 401(k) database, found that overall 401(k) participants’ contribution rates were little changed in 2000, 2001, and 2002 when compared to 1999 (see Holden and VanDerhei, 2004c). Whether measured in dollar amounts or percentage of salary contributed, on average, 401(k) participants’ contribution behavior does not appear to have been materially affected by the bear market in equities from 2000 through 2002. 32
At year-end 2009, 2.0 percent of the participants in the database were missing a birth date entry, were younger than 20, or older than 69. They were not included in this analysis.
33
At year-end 2009, 6.8 percent of the participants in the database were missing a date of hire entry and were not included in this analysis.
34
The positive correlation between tenure and account balance is expected because long-term employees have had more time to accumulate an account balance. However, a rollover from a previous employer’s plan could interfere with this positive correlation because a rollover could give a short-tenured employee a high account balance. There is some discernible evidence of rollover assets among the participants with account balances greater than $100,000, as 1 percent of them had two or fewer years of tenure, and 4 percent of them had between two and five years of tenure (see Figure 12). 35
Because 401(k) plans were introduced about 29 years ago, older and longer-tenured employees would not have participated in 401(k) plans for their entire careers. The Revenue Act of 1978 contained a provision that became Internal Revenue Code Sec. 401(k). The law went into effect on January 1, 1980, but it was not until November 1981 that proposed regulations were issued (see Holden, Brady, and Hadley, 2006; Employee Benefit Research Institute, 2005; and U.S. Internal Revenue Service, 1981).
36
There are two possible explanations for the low account balances among this group: (1) their employer’s 401(k) plan has only recently been established (82 percent of all 401(k)-type plans in existence in 2007 were established after 1989 [tabulations of U.S. Department of Labor Form 5500 data for 2007]), or (2) the employee only recently joined the plan (whether on his or her own or through automatic enrollment). In either event, job tenure would not accurately reflect actual 401(k) plan participation.
37
It is possible that these older, longer-tenured workers accumulated DC plan assets (e.g., possibly in a profit-sharing plan) prior to the introduction of 401(k) plan features. However, such DC plan arrangements generally did not permit employee contributions and often were designed to be supplemental to other employer plans. These participants’ account balances that pre-date the 401(k) plan are not included in this analysis, which focuses on 401(k) balance amounts.
38
Social Security replaces a much higher fraction of pre-retirement earnings for lower-income workers. For example, the firstyear replacement rate (scheduled Social Security benefits as a percentage of average career earnings) for retired workers in the 1940–1949 birth cohort (individuals ages 60 to 69 in 2009) decreased as income increased. The median replacement rate for the lowest household lifetime earnings quintile was 71 percent; for the middle quintile, the median Social Security replacement rate was 43 percent; and for the highest quintile it was 31 percent. See Congressional Budget Office, 2010.
39
The ratio of 401(k) account balance (at the current employer) to salary alone is not an indicator of preparedness for retirement. A complete analysis of preparedness for retirement would require estimating projected balances at retirement by also considering retirement income from Social Security, defined benefit plans, IRAs, and other DC plans, possibly from previous employment. For references to such research, see Holden and VanDerhei, 2005. For an analysis of the possible impact of automatic increases in participants’ contribution rates in automatic enrollment plans, see VanDerhei, 2010 and VanDerhei and Lucas, 2010. For a discussion of the variety of factors (e.g., taxes, savings, mortgages, children) that impact replacement rates, see Brady, 2008. For an analysis of the impact of changes in Social Security between 1992 and 2004 on retirement patterns, see Gustman and Steinmeier, 2008.
40
The tendency of the account balance-to-salary ratio to peak at higher salary levels and then fall off likely reflects the influence of two competing forces. First, empirical research suggests that higher earners tend to contribute higher percentages of salary; therefore, one would expect the ratio of account balance to salary to rise with salary. However, tax
ebri.org Issue Brief • November 2010 • No. 350
65
code contribution limits and nondiscrimination rules, which aim to ensure that employees of all income ranges attain the benefits of the 401(k) plan, constrain these high-income individuals’ ability to save in the plan. See Holden and VanDerhei, 2001c for a complete discussion of EBRI/ICI findings and others’ research on the relationship between contribution rates and salary. For an analysis of 401(k) participants’ contribution activity during the bear market of 2000 to 2002, see Holden and VanDerhei, 2004c. For summary statistics on contribution activity in 2009, see The Vanguard Group, 2010 and Hewitt Associates, 2010. 41
At year-end 2009, 62 percent of balanced mutual fund assets were invested in equities (see Investment Company Institute,
Quarterly Supplementary Data). 42
Other research suggests that most 401(k) participants do not make active changes to their asset allocations during any given year. For example, an ICI survey of recordkeepers covering nearly 24 million DC plan participant accounts found that 11.8 percent of DC plan participants changed the asset allocation of their account balances in 2009 and 10.5 percent changed the asset allocation of their contributions during 2009 (see Holden, 2010). Covering a year earlier, the ICI survey of recordkeepers covering more than 22 million DC plan participant accounts found that 14.4 percent of DC plan participants changed the asset allocation of their account balances in 2008 and 12.4 percent changed the asset allocation of their contributions during 2008 (see Holden, 2010). Utkus and Young, 2010, reported that 13 percent of DC plan participants traded in their retirement accounts in 2009, analyzing the plans administered by Vanguard. Analyzing a year earlier, The Vanguard Group 2009 reported that “despite the substantial market volatility of 2008, only 16 [percent] of participants made one or more portfolio trades or exchanges during the year.” Hewitt Associates, 2010, found that 16.2 percent of participants traded in their accounts in 2009, and 19.7 percent changed the asset allocation of their contributions. Hewitt Associates, 2009a, reported that 19.6 percent of participants made asset transfers in their account balances during 2008, which was “up only marginally” from 2007 (although, they tended to move larger portions of their account balances). Fidelity Investments, 2008, reported that overall only 6.6 percent of participants in their recordkeeping system made exchanges during September, October, and November 2008, a time of stock market volatility. Furthermore, Choi et al., 2001, found that 401(k) participants rarely made changes after the initial point of enrollment. (For household survey results from late 2009 reflecting households’ sentiment toward and confidence in 401(k) plans, see Holden, Sabelhaus, and Reid, 2010.) 43
Holden, VanDerhei, and Alonso 2009 presents a similar analysis of changes in asset allocation among a consistent group of participants with account balances at the end of 2007 and 2008 in the 2008 EBRI/ICI 401(k) database. Holden and VanDerhei, 2003 presents a similar analysis of changes in asset allocation among a consistent group of participants with account balances at the end of each year from 1999 through 2002 in the EBRI/ICI 401(k) database. Holden, VanDerhei, and Quick, 2000, includes an analysis of changes in equity fund asset allocations among participants with account balances at the end of each year from 1996 to 1998 in the EBRI/ ICI 401(k) database. 44
See Figure A13 in the Appendix for a detailed presentation of the changing percentages of account balance invested in equity funds among the 16.7 million 401(k) participants with account balances in the EBRI/ICI 401(k) database at year-end 2008 and year-end 2009. 45
See Figure A13 in the Appendix for a detailed presentation of the changing percentages of account balance invested in equity funds among the 16.7 million 401(k) participants with account balances in the EBRI/ICI 401(k) database at year-end 2008 and year-end 2009. 46
See Figure A14 in the Appendix for a detailed presentation of the changing percentages of account balance invested in bond funds among the 16.7 million 401(k) participants with account balances in the EBRI/ICI 401(k) database at year-end 2008 and year-end 2009. 47
Participants in their 20s hold approximately 2 percent of the total assets in the 2009 EBRI/ICI 401(k) database; participants in their 30s hold about 12 percent; participants in their 40s hold 29 percent; participants in their 50s hold 41 percent; and participants in their 60s hold the remaining 17 percent of the total assets.
48
See endnote 11 for additional detail on target-date funds.
49
For year-end 2008 data, see Holden, VanDerhei, and Alonso, 2009.
50
For year-end 2007 data, see Holden, VanDerhei, et al., 2008.
ebri.org Issue Brief • November 2010 • No. 350
66
51
Target-date funds have been increasingly used as the default investment in automatic enrollment plans and in plans’ investment lineups (see Profit Sharing/401k Council of America, 2010). At year-end 2009, 66 percent of target-date mutual fund assets were held in DC plans (see Brady, Holden, and Short, 2010).
52
For year-end 2008 data, see Holden, VanDerhei, and Alonso, 2009.
53
See Holden, VanDerhei, et al., 2008, and Holden, VanDerhei, and Alonso, 2009, for data on earlier years.
54
For year-end 2008 data, see Holden, VanDerhei, and Alonso, 2009.
55
In the database, there has been a downward trend in 401(k) plan participants’ holdings of and concentration in company stock. In the wake of the collapse of Enron in 2001, participants’ awareness of the need to diversify may have increased and some plan sponsors changed plan design (see VanDerhei, 2002). In addition, some of this movement may be the result of regulations put in place by the Pension Protection Act of 2006 (PPA), which resulted in regulations that limit the length of time participants could be required to hold company stock contributed to their accounts by their employer; specified rules regarding the notification of blackout periods; and required quarterly statements that must include notice highlighting the importance of diversification (see U.S. Joint Committee on Taxation, 2006).
56
Plan-specific information on loan provisions is available for the majority of the plans in the sample (including virtually all of the small plans). Some plans without this information are classified as having a loan provision if any participant in the plan has an outstanding loan balance. This may understate the number of plans offering loans (or participants eligible for loans) because some plans may have offered, but no participant had taken out, a plan loan. It is likely that this omission is small, as U.S. Government Accountability Office, 1997 found that more than 95 percent of 401(k) plans that offer loans had at least one plan participant with an outstanding loan. 57
The percentage of 401(k) participants with 401(k) loans outstanding across all participants both with and without 401(k) plan loan access was similar in earlier years. For example, in 2007, 16 percent, and in 2006, 15 percent. 58
In plan-year 2007 (latest data available), only 1.6 percent of the $3.0 trillion in 401(k) plan assets were participant loans. In addition, only $604 million flowed out of 401(k) plans as the result of converting a loan into a withdrawal/distribution (“deemed distribution of participant loans”). See U.S. Department of Labor, Employee Benefits Security Administration, 2010a.
59
This pattern is driven in part by restrictions placed on loan amounts.
60
The value of this percentage is lower than it would have been if it were merely reflecting employee turnover and retirement. The EBRI/ICI 401(k) database has added data providers since 2003, and by definition participants in these plans would not be included in the consistent group. Moreover, any time a 401(k) plan sponsor changed service providers, all participants in the plan would be excluded from the consistent group. For the year-end 2003 EBRI/ICI 401(k) database update, see Holden and VanDerhei, 2004a and 2004b.
61
The value of this percentage is lower than it would have been if it were merely reflecting employee turnover and retirement. The EBRI/ICI 401(k) database has added data providers since 1999, and by definition participants in these plans would not be included in the consistent group. Moreover, any time a 401(k) plan sponsor changed service providers, all participants in the plan would be excluded from the consistent group. For the year-end 1999 EBRI/ICI 401(k) database update, see Holden and VanDerhei, 2001a.
62
For statistics indicating the higher propensity of withdrawals among participants in their 60s, see Holden and VanDerhei, 2002. 63
At year-end 2009,62 percent of balanced mutual fund assets were invested in equities (see Investment Company Institute,
Quarterly Supplementary Data). 64
For an analysis of contribution activity during the bear market of 2000–2002 using the cross-sectional EBRI/ICI 401(k) database, see Holden and VanDerhei, 2004c. The analysis found that overall 401(k) participants’ contribution rates were little changed in 2000, 2001, and 2002 when compared with 1999. Whether measured in dollar amounts or percentage of salary contributed, on average, 401(k) participants’ contribution behavior does not appear to have been materially affected by the bear market in equities from 2000 through 2002.
ebri.org Issue Brief • November 2010 • No. 350
67
EBRI Employee Benefit Research Institute Issue Brief (ISSN 0887137X) is published monthly by the Employee Benefit Research Institute, 1100 13th St. NW, Suite 878, Washington, DC, 20005-4051, at $300 per year or is included as part of a membership subscription. Periodicals postage rate paid in Washington, DC, and additional mailing offices. POSTMASTER: Send address changes to: EBRI Issue Brief, 1100 13th St. NW, Suite 878, Washington, DC, 20005-4051. Copyright 2010 by Employee Benefit Research Institute. All rights reserved. No. 350
Who we are
What we do
Our publications
Orders/ Subscriptions
The Employee Benefit Research Institute (EBRI) was founded in 1978. Its mission is to contribute to, to encourage, and to enhance the development of sound employee benefit programs and sound public policy through objective research and education. EBRI is the only private, nonprofit, nonpartisan, Washington, DC-based organization committed exclusively to public policy research and education on economic security and employee benefit issues. EBRI’s membership includes a cross-section of pension funds; businesses; trade associations; labor unions; health care providers and insurers; government organizations; and service firms. EBRI’s work advances knowledge and understanding of employee benefits and their importance to the nation’s economy among policymakers, the news media, and the public. It does this by conducting and publishing policy research, analysis, and special reports on employee benefits issues; holding educational briefings for EBRI members, congressional and federal agency staff, and the news media; and sponsoring public opinion surveys on employee benefit issues. EBRI’s Education and Research Fund (EBRI-ERF) performs the charitable, educational, and scientific functions of the Institute. EBRI-ERF is a tax-exempt organization supported by contributions and grants. EBRI Issue Briefs are periodicals providing expert evaluations of employee benefit issues and trends, as well as critical analyses of employee benefit policies and proposals. EBRI Notes is a monthly periodical providing current information on a variety of employee benefit topics. EBRI’s Pension Investment Report provides detailed financial information on the universe of defined benefit, defined contribution, and 401(k) plans. EBRI Fundamentals of Employee Benefit Programs offers a straightforward, basic explanation of employee benefit programs in the private and public sectors. The EBRI Databook on Employee Benefits is a statistical reference work on employee benefit programs and work force-related issues. www.ebri.org Contact EBRI Publications, (202) 659-0670; fax publication orders to (202) 775-6312. Subscriptions to EBRI Issue Briefs are included as part of EBRI membership, or as part of a $199 annual subscription to EBRI Notes and EBRI Issue Briefs. Individual copies are available with prepayment for $25 each (for printed copies). Change of Address: EBRI, 1100 13th St. NW, Suite 878, Washington, DC, 20005-4051, (202) 659-0670; fax number, (202) 775-6312; Membership Information: Inquiries regarding EBRI e-mail:
[email protected] membership and/or contributions to EBRI-ERF should be directed to EBRI President/ASEC Chairman Dallas Salisbury at the above address, (202) 659-0670; e-mail:
[email protected]
Editorial Board: Dallas L. Salisbury, publisher; Stephen Blakely, editor. Any views expressed in this publication and those of the authors should not be ascribed to the officers, trustees, members, or other sponsors of the Employee Benefit Research Institute, the EBRI Education and Research Fund, or their staffs. Nothing herein is to be construed as an attempt to aid or hinder the adoption of any pending legislation, regulation, or interpretative rule, or as legal, accounting, actuarial, or other such professional advice. EBRI Issue Brief is registered in the U.S. Patent and Trademark Office. ISSN: 0887137X/90 0887137X/90 $ .50+.50
© 2010, Employee Benefit Research InstituteEducation and Research Fund. All rights reserved.