61
Sciencia Acta Xaveriana An International Science Journal ISSN. 0976-1152
Volume 3 No. 1 pp. 61-66 Apr 2012
Synthesis and Characterization studies of CdO nano rods by wet chemical method R. Suhin Vimal Raj1, S. Anbarasu1, K. Kaviyarasu1, T. Kishore Kumar2 & Prem Anand Devarajan1* 1
Centre for Nanoscience and Nanotechnology, Department of Physics, St. Xavier’s College (Autonomous), Palayamkottai - 627002, Tamilnadu, India.
2
Department of Physics, Presidency College, Chennai – 600 005, Tamilnadu, India.
* Corresponding author:
[email protected] Abstract : A very simple strategy known as wet chemical method for preparing inorganic CdO nano rods under ambient aqueous condition is presented. The CdO nano particles were harvested by adding a highly concentrated solution of one reactant to a solution of another reactant without adding any capping or surfactant agent. The as obtained nano rods were characterized using X-Ray Powdered Diffraction (XRPD), Fourier Transform Infra- Red (FTIR) and UVVis-NIR analyses. The results are presented in detail. Key words : wet chemical method, CdO, nano rod, XRPD, FTIR, UV-vis-NIR
1. Introduction Over the past decade one dimensional (1D) nanostructures such as nanowires, nano rods, nano belts and nanotubes have been concentrated in research and material manufacturing because of their unique physico-chemical properties, which are different from those zero
Synthesis and Characterization studies of CdO nano rods by wet chemical method
62
dimensional particles and potential applications as building blocks for nano device construction [1-2]. Till date several methods have been employed to build 1D nano structures, such as template – directed synthesis, vapour liquid solid (VLS) growth, solvo thermal synthesis, and organization of nano particles, reverse micelle technique etc., [3-13]. Hence for synthesizing inorganic nano particles precursors and capping agents have an immediate effect for the reaction process so as to attain nano products. Therefore wet chemical method is a simple and an ideal method to prepare nano particles. CdO is a well known semi conductor for its wide band gap of 2.3 eV and a very exciton binding energy at room temperature. As a consequence, it possesses unique optical and electronic properties which stimulate wide research interest in potential applications. Recently various inorganic nano particles have been designed and reported by many of the authors [14-17]. Motivated by the findings, we herein report the growth and characterization of CdO nano particles. The as obtained products were characterized by XRPD, FTIR, and UV- Vis-NIR analyses.
2. Materials and methods All chemicals used in this work are of analytical grade reagents from E- merck. They were used as received without further purification.
2.1. Synthesis of CdO nano particles Under constant stirring of NaOH solution (1M) at room temperature, Cadmium nitrate solution (0.5M) was added drop wise for 20 minutes. Stirring was continued for 2 hours till a white precipitate was deposited at the bottom of the flask. The reaction process is as follows : Cd(NO3)2 . 6H2 O + 2NaOH Cd(OH)2 + 2NaNO3 + 6H2O Cd(OH)2 + 2H2O Cd2+ + 2OH- + 2H2O Cd(OH)42- + 2H+ Cd(OH)42- CdO + H2O +2OH-
The as obtained precipitate was then filtered and washed 2-3 times with the distilled water. Then the powdered sample was dried at 700 in a muffle furnace and was used for further characterizations.
R. Suhin Vimal Raj, S. Anbarasu, K. Kaviyarasu, T. Kishore Kumar & Prem Anand Devarajan
63
2.2. Characterization The X- Ray diffraction data were collected on a PAN analytical diffractometer using CuK radiation over an angular range of 200 < 2 < 600. UV- Visible absorption data of the sample was carried out using Elmer lambda - 35 spectrometer in the wavelength range 190 - 1100 nm to study the optical absorption. Further, the functional groups in the molecule were identified using Brukker IFS 66V spectrometer in the frequency range 400 - 4000 cm-1 using KBr pellet technique.
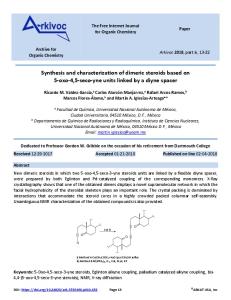
2.2.1. X- ray Powder diffraction (XRPD) analysis A typical XRPD pattern of the as prepared CdO nano rods is shown in Fig.1. From the spectrum it is clear that all the diffraction peaks are intense and very sharp. Furthermore no impurities were detected in the XRPD spectrogram. The particle size was determined from the width of XRPD peaks using Debye – Scherrer formula [18]. /
0
). From this it may be attributed that CdO might have a strong bonding between Cd and O atoms. 1000
Intensity
800
600
400
200
0
10
15
20
25
30
35
40
45
50
55
60
65
70
75
2 (degree)
Fig.1. XRPD spectrum of CdO nanorods
Synthesis and Characterization studies of CdO nano rods by wet chemical method
64
2.2.2. FTIR analysis (FTIR) The Fourier Transform Infra-Red (FTIR) spectrum of the as obtained CdO nano rods is shown in Fig. 2. The FTIR spectrum of the CdO nano rods was recorded in the frequency region at a resolution of 4 cm-1 and with a scanning speed of 2 mm/s which was used in KBr phase. The recorded FTIR spectra were compared with standard spectra of functional groups. The FTIR peaks at 464 cm-1 and 841 cm-1 is the characteristics vibration of Cd-O.
100
% Transmittance
80
60
40
20
0
4000
3500
3000
2500
2000
1500
1000
500
-1
wavenumber (cm )
Fig.2. FTIR spectrum of CdO nanorods
2.2.3. UV- vis –NIR analysis UV visible spectroscopy was carried out to study further the optical property of the nano rods. The room temperature UV- absorption spectra of CdO nano rods is shown in Fig.3. The spectrum shows a prominent exciton band at 228 nm corresponding to the CdO nano structures. This absorption in the visible range of wavelength implies that there may exist more defect energy levels in the as obtained CdO nano rods due to specific experimental synthesis condition.
R. Suhin Vimal Raj, S. Anbarasu, K. Kaviyarasu, T. Kishore Kumar & Prem Anand Devarajan
65
2.5
% Absorbtion
2.0
1.5
1.0
0.5
0.0
200 220 240 260 280 300 320 340 360 380 400 420 440 460
wavelength (nm)
Fig.3. UV-vis-NIR spectrum of CdO nanorods
3. Conclusion We have tried to demonstrate a simple method for synthesising CdO nano rods by wet chemical method successfully. The particle size of the CdO nano rods were estimated using XRPD analysis. The various functional groups in the molecule were identified using FTIR spectral analysis. The quantum size confinement effect was elucidated by UV –vis- NIR spectral analysis.
Acknowledgement One of the authors (RSVR) would like to thank professor I. Sebasdiyar for his constant support, help and encouragement.
References [1] S. Iijima, Nature, 354(1991)56 [2] Y. Xia, P.Yang, B. Son, Y. Wu B. Mayers, B. Gates, Y. Yin, F. Kim and H.Yan, Adv. Mater.,15(2003) 353 [3] H. Ogihara, S. Takenaka, I. Yamanaka, E. Tanabe A. Ganseki and K. Otsoka, Chem. Mater., 18 (2006) 996
66
Synthesis and Characterization studies of CdO nano rods by wet chemical method
[4]
Q. Wang, G. Wang, X. Han X. Wang, J. Phy. Chem. B, 109 (2005) 2332
[5]
Y. Hueng, S. Yue, Z. Wang Q. Wang, C. Shi, Z. Xu, X. Bai, C. Tang, C. Gu, J. Phy. Chem. B, 110 (2006) 796
[6]
G. Slen, Y. Bando, C. Tang, D. Golberg, J. Phy. Chem. B, 110 (2006)7199
[7]
B. Wen C. Liu, Y. Liu, Chem. Lett., 34 (2005) 396
[8]
Z. Liu, Y. Yang, J. Liang, Z. Hu, S. Li, S. Peng, Qian, J. Phy. Chem. B, 107 (2003) 12658
[9]
X. Wang, Y. Li, J. Ar. Chem. Soc., 124(2004) 2880
[10] Z. Tang, N. A. Koto and Giersig, Science 297 (2002) 237 [11] J. Polleuse, N. Pinna, M. Antonietti and M. Niedor berger , Adv. Mater 16 (2004) 436 [12] N.Pinna, U.Wild J.Urban R.Schlogel Adv. Mater 15 (2003) 329 [13] N. Pinna, M. Willinger, K. Weiss, J. Urban and R. Schlogl. Nano Lett., 3 (2003) 1131 [14] L. Vagssieres, Adv. Mater., 15(2003) 464 [15] I. Kim, Mater Lett. 43 (2000) 221 – 224 [16] W. Che, Q. Xu, Y. S. Hu, J. Mater, Chem., 12(2002) 1926 [17] C. A. Barbaza, J. M. Albeguer, F. W. S. Eaeteno, U. N. Friere and J. A. P. Dacosta, Chem. Phy. Lett., 480 (2009) 273 [18] Sharma T. P, Patidar D, Sexene N. S & Sharma, Indian J. Pure and Applied Phy., 44 (2006) 125


![Design, synthesis and characterization of [1,3,4]thiadiazolo- and [1,2,4 ...](https://p.pdfkul.com/img/300x300/design-synthesis-and-characterization-of-134thiadi_59e066871723dd9253a4e1f8.jpg)