16 March 1999
Volume 130
Number 6
Annals of Internal Medicine A More Accurate Method To Estimate Glomerular Filtration Rate from Serum Creatinine: A New Prediction Equation Andrew S. Levey, MD; Juan P. Bosch, MD; Julia Breyer Lewis, MD; Tom Greene, PhD; Nancy Rogers, MS; and David Roth, MD, for the Modification of Diet in Renal Disease Study Group*
Background: Serum creatinine concentration is widely used as an index of renal function, but this concentration is affected by factors other than glomerular filtration rate (GFR). Objective: To develop an equation to predict GFR from serum creatinine concentration and other factors. Design: Cross-sectional study of GFR, creatinine clearance, serum creatinine concentration, and demographic and clinical characteristics in patients with chronic renal disease. Patients: 1628 patients enrolled in the baseline period of the Modification of Diet in Renal Disease (MDRD) Study, of whom 1070 were randomly selected as the training sample; the remaining 558 patients constituted the validation sample. Methods: The prediction equation was developed by stepwise regression applied to the training sample. The equation was then tested and compared with other prediction equations in the validation sample. Results: To simplify prediction of GFR, the equation included only demographic and serum variables. Independent factors associated with a lower GFR included a higher serum creatinine concentration, older age, female sex, nonblack ethnicity, higher serum urea nitrogen levels, and lower serum albumin levels (P , 0.001 for all factors). The multiple regression model explained 90.3% of the variance in the logarithm of GFR in the validation sample. Measured creatinine clearance overestimated GFR by 19%, and creatinine clearance predicted by the Cockcroft–Gault formula overestimated GFR by 16%. After adjustment for this overestimation, the percentage of variance of the logarithm of GFR predicted by measured creatinine clearance or the Cockcroft–Gault formula was 86.6% and 84.2%, respectively. Conclusion: The equation developed from the MDRD Study provided a more accurate estimate of GFR in our study group than measured creatinine clearance or other commonly used equations. This paper is also available at http://www.acponline.org. Ann Intern Med. 1999;130:461-470. * For members of the Modification of Diet in Renal Disease Study Group, see N Engl J Med. 1994;330:877-84.
T
he glomerular filtration rate (GFR) is traditionally considered the best overall index of renal function in health and disease (1). Because GFR is difficult to measure in clinical practice, most clinicians estimate the GFR from the serum creatinine concentration. However, the accuracy of this estimate is limited because the serum creatinine concentration is affected by factors other than creatinine filtration (2, 3). To circumvent these limitations, several formulas have been developed to estimate creatinine clearance from serum creatinine concentration, age, sex, and body size (4–12). Despite more recent studies that have related serum creatinine concentration to GFR (13–24), no formula is more widely used to predict creatinine clearance than that proposed by Cockcroft and Gault (4). This formula is used to detect the onset of renal insufficiency, to adjust the dose of drugs excreted by the kidney, and to evaluate the effectiveness of therapy for progressive renal disease. More recently, it has been used to document eligibility for reimbursement from the Medicare End Stage Renal Disease Program (25) and for accrual of points for patients on the waiting list for cadaveric renal transplantation (26). Major clinical decisions in general medicine, geriatrics, and oncology (as well as nephrology) are made by using the Cockcroft–Gault formula and other formulas to predict the level of renal function. Therefore, these formulas must predict GFR as accurately as possible. The Modification of Diet in Renal Disease (MDRD) Study, a multicenter, controlled trial, evaluated the effect of dietary protein restriction and strict blood pressure control on the progression of renal disease (27–30). During the baseline period, GFR, serum creatinine, and several variables that affect the relation between them were measured in patients with chronic renal disease. The purpose of our study was to develop an equation from MDRD Study data that could improve the prediction of GFR from serum creatinine concentration.
© 1999 American College of Physicians–American Society of Internal Medicine
461
Methods Baseline Cohort and Measurement Methods in the Modification of Diet in Renal Disease Study
The overall study design and methods of recruitment for the MDRD Study have been described elsewhere (31, 32). A total of 1785 patients entered the baseline period. Of these patients, 1628 (91%) also underwent measurement of GFR and the other variables described below; these patients constitute the study group for these analyses. Glomerular filtration rate was measured as the renal clearance of 125I-iothalamate (33, 34). Creatinine clearance was computed from creatinine excretion in a 24-hour urine collection and a single measurement of serum creatinine. Serum and urine creatinine were measured by using a kinetic alkaline picrate assay with a normal range in serum of 62 to 124 mmol/L (0.7 to 1.4 mg/dL) (35). Glomerular filtration rate and creatinine clearance were expressed per 1.73 m2 of body surface area by multiplying measured values by 1.73/body surface area (36). The serum and urine specimens were also used for other measurements, including serum albumin (bromcresol green method [35]), serum urea nitrogen (urease method [35]), and urine urea nitrogen (urease method [35]). Protein intake (g/d) was estimated as 6.25 [UUN (g/d) 1 0.031 (g/kg per day) SBW (kg)], where UUN is urine urea nitrogen, SBW is standard body weight, and 0.031 g/kg per day is a constant reflecting the rate of excretion of nitrogen in compounds other than urine urea (37, 38). The diagnosis of diabetes and the cause of renal disease were assigned on the basis of chart review at the clinical center (39). Statistical Analysis
Descriptive Statistics The relation of renal function measurements to other baseline characteristics was assessed by using contingency tables, t-tests, analysis of variance, and linear regression, as appropriate. Nonparametric tests (Wilcoxon rank-sum tests and Kruskal–Wallis tests) gave consistent results. A P value less than 0.01 was considered statistically significant. Multivariable Analysis of Glomerular Filtration Rate We used stepwise multiple regression to determine a set of variables that jointly predicted GFR. The stepwise regression models were developed by using a training sample consisting of a random sample of 1070 of the 1628 patients. We found that the variability of the difference between the observed and predicted GFR values was greater for higher GFR values. This increase was eliminated by performing multiple regressions on log-transformed data. 462
16 March 1999
•
Annals of Internal Medicine
•
To facilitate clinical interpretation, the results were re-expressed in terms of the original units. Consequently, the prediction equation is a multiplicative model; regression coefficients refer to the change in geometric mean GFR associated with unit changes in the independent variable. Predicted GFR is expressed in mL/min per 1.73 m2. The following variables were considered for possible inclusion in the regression model: weight, height, sex, ethnicity, age, diagnosis of diabetes, serum creatinine concentration, serum urea nitrogen level, serum albumin level, serum phosphorus level, serum calcium level, mean arterial pressure, urine creatinine level, urine urea nitrogen level, urine protein level, and urine phosphorus level. The cause of renal disease was not included because in clinical practice, the cause may be unknown or clinicians may not use the same classification method as the investigators in the MDRD Study. A P value less than 0.001 was used as the criterion for entry of a variable into the model. Because of the difficulty in collecting complete 24-hour urine samples in clinical practice, an additional stepwise regression was performed to develop a prediction model that did not include urine biochemistry variables. Finally, because of the interest in developing a prediction equation to assess eligibility for Medicare reimbursement and listing for cadaveric renal transplantation, we repeated the analysis restricting the population to the subgroup of patients with higher serum creatinine concentrations (.221 mmol/L [2.5 mg/dL]; n 5 509 in the training sample). Methods for Comparing Equations To Predict Glomerular Filtration Rate We first developed coefficients for each prediction equation (including the selection of the predictor variables for the stepwise regressions) using the data from the training sample to predict log GFR. Each prediction equation also included a multiplicative constant to account for any consistent bias in the application of that equation in the MDRD Study Group. This was particularly important for equations that are intended to estimate creatinine clearance, which is known to be higher than GFR. The regression coefficients determined in the training sample were then applied to obtain predicted GFRs in a separate validation sample consisting of the remaining 558 patients (172 patients with serum creatinine concentration . 221 mmol/L [2.5 mg/ dL]). These predicted GFR values were compared with the actual GFRs in the validation sample to evaluate the performance of each prediction equation. In this way, separate data sets were used to construct the equations and assess their accuracy after removal of systematic bias. For each equation, we computed overall R2 (percentage of variability in
Volume 130
•
Number 6
Table 1.
Association of Renal Function with Demographic and Clinical Characteristics, Protein Intake, and Blood Pressure in the Modification of Diet in Renal Disease Study Baseline Cohort*
Characteristic
Glomerular Filtration Rate
Creatinine Clearance
Serum Creatinine Concentration
mL z s22 z m22 (mL/min per 1.73 m2) Overall (n 5 1628) Sex Male (n 5 983) Female (n 5 645) Ethnicity Black (n 5 197) White (n 5 1304) Age #55 y (n 5 947) .55 y (n 5 681) Diabetes status Diabetic (n 5 99) Nondiabetic (n 5 1529) Cause of renal disease Polycystic kidney disease (n 5 364) Glomerular (n 5 525) Tubulointerstitial (n 5 121) Other or unknown (n 5 618) Protein intake‡ ,0.85 g/kg per day (n 5 480) 0.85–1.05 g/kg per day (n 5 585) .1.05 g/kg per day (n 5 562) Mean arterial pressure§ ,98 mm Hg (n 5 758) 98 –107 mm Hg (n 5 466) .107 mm Hg (n 5 404)
mmol/L (mg/dL)
0.38 6 0.20 (39.8 6 21.2)
0.47 6 0.24 (48.6 6 24.5)
203 6 106 (2.3 6 1.2)
0.39 6 0.2 (40.2 6 20.4) 0.38 6 0.21 (39.1 6 22.3)
0.48 6 0.24 (49.6 6 24.8) 0.45 6 0.23 (47.0 6 23.9)
212 6 106 (2.4 6 1.2)† 177 6 97 (2.0 6 1.1)
0.42 6 0.21 (43.6 6 21.4)† 0.38 6 0.2 (39.2 6 20.8)
0.48 6 0.25 (49.8 6 25.4) 0.47 6 0.23 (48.3 6 23.8)
212 6 115 (2.4 6 1.3) 195 6 97 (2.2 6 1.1)
0.4 6 0.22 (41.5 6 22.7)† 0.36 6 0.18 (37.4 6 18.7)
0.49 6 0.25 (50.4 6 26.1)† 0.44 6 0.21 (46.0 6 21.8)
203 6 106 (2.3 6 1.2) 194 6 97 (2.2 6 1.1)
0.38 6 0.22 (39.3 6 23.1) 0.38 6 0.2 (39.8 6 21.1)
0.46 6 0.25 (47.6 6 25.5) 0.47 6 0.24 (48.7 6 24.4)
186 6 88 (2.1 6 1.0) 203 6 106 (2.3 6 1.2)
0.38 6 0.22 (39.9 6 22.5) 0.37 6 0.2 (38.6 6 21.2) 0.36 6 0.19 (37.5 6 19.2) 0.4 6 0.2 (41.1 6 20.7)
0.46 6 0.24 (47.3 6 24.6) 0.47 6 0.25 (48.9 6 25.4) 0.44 6 0.23 (45.8 6 24.2) 0.48 6 0.23 (49.6 6 23.6)
203 6 115 (2.3 6 1.3) 203 6 106 (2.3 6 1.2) 186 6 80 (2.1 6 0.9) 194 6 97 (2.2 6 1.1)
0.32 6 0.2 (32.9 6 19.6) 0.37 6 0.18 (38.6 6 19.1) 0.45 6 0.22 (46.8 6 22.3)
0.35 6 0.19 (36.6 6 19.8) 0.45 6 0.2 (47.0 6 21.2) 0.58 6 0.25 (60.5 6 25.8)
230 6 124 (2.6 6 1.4) 203 6 106 (2.3 6 1.2) 168 6 80 (1.9 6 0.9)
0.4 6 0.22 (41.0 6 22.4) 0.38 6 0.19 (39.3 6 19.9) 0.37 6 0.19 (38.0 6 20.1)
0.48 6 0.24 (49.7 6 25.1) 0.47 6 0.24 (49.2 6 25.3) 0.44 6 0.21 (45.8 6 22.1)
194 6 97 (2.2 6 1.1) 203 6 106 (2.3 6 1.2) 212 6 106 (2.4 6 1.2)
* Data are given as the mean 6 SD and are moderately positively skewed so that mean is slightly higher than the median in each subgroup. † Subgroup means differ from each other (P # 0.01). ‡ Protein intake was significantly correlated with glomerular filtration rate, creatinine clearance, and serum creatinine concentration (P , 0.01). § Mean arterial pressure was significantly correlated with serum creatinine concentration (P , 0.01).
log GFR explained by the regression model) and the 50th, 75th, and 90th percentiles of the distribution of the percentage absolute difference between measured and predicted GFRs in the validation sample. The 50th percentiles indicate the typical size of the errors in prediction of GFR, and the 75th and 90th percentiles assess the sizes of the larger errors that occurred for each model.
disease were glomerular disease (32%), polycystic kidney disease (22%), tubulointerstitial disease (7%), and other or unknown renal diseases (40%). Mean protein intake was 0.99 6 0.24 g/kg of body weight per day and mean arterial pressure was 99.4 6 12.2 mm Hg. Mean weight was 79.6 6 16.8 kg, body surface area was 1.91 6 0.23 m2, serum urea nitrogen concentration was 11.4 6 5.7 mmol/L [32 6 16 mg/dL], and serum albumin concentration was 40.0 6 4.0 g/L [4.0 6 0.4 g/dL], respectively.
Development of Final Prediction Equations To improve the accuracy of the final MDRD Study prediction equations, the regression coefficients derived from the training sample were updated on the basis of data from all 1628 patients. As a result, the standard errors of the regression coefficients in the final MDRD Study prediction equations are slightly smaller than those derived from the training sample; thus, the accuracy of the final prediction equations may be slightly better (by about 0.1% to 0.2%) than their accuracy as assessed in the validation sample.
Glomerular Filtration Rate, Creatinine Clearance, and Serum Creatinine Concentration
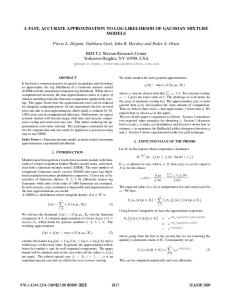
Renal function measurements for the study group and for various subgroups are shown in Table 1. Mean GFR for the population was 0.38 mL z s22 z m22 (39.8 mL/min per 1.73 m2), with lower values in patients with lower protein intake, white patients compared with black patients, and older patients ($55 years) compared with younger patients (P , 0.01). The mean value of creatinine clearance was 0.81 mL z s22 z m22 (48.6 mL/min per 1.73 m2) and was lower in older patients and patients with lower protein intake (P # 0.01). The mean serum creatinine concentration was 203 mmol/L (2.3 mg/dL) and was higher in men, patients with lower protein intake, and patients with higher mean arterial pressure (P # 0.01). Figure 1 shows the well-known reciprocal relation of serum creatinine concentra-
Results Demographic and Clinical Characteristics
The mean age (6 SD) of the cohort was 50.6 6 12.7 years. Sixty percent of patients were male, 88% were white, and 6% were diabetic. Causes of renal 16 March 1999
•
Annals of Internal Medicine
•
Volume 130
•
Number 6
463
tion, whereas urea clearance is usually lower than GFR because of tubular reabsorption. The mean of creatinine and urea clearances provides a more accurate estimate of GFR. The relations of GFR to the reciprocal of serum creatinine (Pcr) 3 100 (100/Pcr) and creatinine clearance predicted by the Cockcroft– Gault equation are also shown in Figure 2. As did measured creatinine clearance, the Cockcroft–Gault equation yielded values that were higher than the actual values for GFR. Prediction of Glomerular Filtration Rate from Multiple Regression Models Derived from the Modification of Diet in Renal Disease Study
Figure 1. Relation of serum creatinine concentration to measured glomerular filtration rate (GFR). Each point represents the baseline measurement for one patient during the MDRD Study. Glomerular filtration rate was measured as the renal clearance of 125I-iothalamate. Serum creatinine concentration (Pcr) was measured by using a kinetic alkaline picrate assay. Values are shown separately for men (n 5 915) and women (n 5 586) by ethnicity (white persons [dashed lines and dots] and black persons [solid lines and circles]). Regression lines were computed from the relation 1/Pcr compared with GFR. Black men (n 5 113) have higher serum creatinine values than white men (n 5 802) (P , 0.001); black women (n 5 84) have higher serum creatinine values than white women (n 5 502) (P , 0.001). To convert mL/min per 1.73 m2 to mL z s22 z m22, multiply by 0.00963. To convert mg/dL to mmol/L, multiply by 88.4.
tion to GFR for subgroups based on sex and ethnicity. At any given GFR, the serum creatinine concentration is significantly higher in men than in women and in black persons than in white persons (P , 0.001). Relation among Clearance Measurements and Prediction of Glomerular Filtration Rate from Transformations of Serum Creatinine Concentration
The relations of GFR to creatinine and urea clearances are shown in Figure 2. Creatinine clearance usually exceeds GFR because of tubular secre464
16 March 1999
•
Annals of Internal Medicine
•
We developed equations to predict log GFR using stepwise regression applied to a randomly selected training sample of 1070 patients. We then validated the equations in the remaining 558 patients. Only variables with a P value less than 0.001 were included in the final models. In this section, we describe the final models on the basis of data from all 1628 patients. Table 2 shows the variables in the final models. The prediction equations (equations 6 and 7) are shown in Table 3. As expected, predicted GFR does not systematically deviate from measured GFR (Figure 3), although a few values for measured GFR are below predicted values when GFR is normal or high. As in the Cockcroft–Gault equation, the reciprocal of serum creatinine concentration is included in both models. The reciprocal of serum urea nitrogen concentration was also an independent predictor of GFR; this probably reflects the relation between GFR and urea clearance. Both urea and creatinine undergo glomerular filtration but are handled differently by the renal tubules; thus, it is not surprising that the serum levels of urea nitrogen and creatinine, although both are related to the level of GFR, would vary independently. Older age and female sex were independent predictors of lower GFR, presumably reflecting the well-known relations of age and sex to muscle mass (40). Lower muscle mass, as observed in older persons and in women, causes lower urine creatinine excretion and, therefore, lower serum creatinine concentration at any GFR. Body size is also associated with urine creatinine excretion. However, because equations from the MDRD Study predict GFR adjusted for body surface area, neither height nor weight was an independent predictor of adjusted GFR. Black ethnicity was an independent predictor of higher GFR. Previous studies have shown that on average, black persons have greater muscle mass than white persons (41– 43). In other analyses, we found that black ethnicity was an independent predictor of higher urine creatinine excretion (data not shown).
Volume 130
•
Number 6
Figure 2. Relation of measured creatinine and urea clearances and transformations of serum creatinine concentration (Pcr) to measured glomerular filtration rate (GFR). Each point represents the baseline measurement during the Modification of Diet in Renal Disease Study (n 5 1628). Correlations are shown for GFR, measured as the renal clearance of 125I-iothalamate. Solid lines are lines of identity. A. Creatinine clearance. B. Urea clearance. C. The mean of creatinine and urea clearances. D. Reciprocal of serum creatinine, 3100. E. Creatinine clearance estimated by the Cockcroft–Gault formula: Ccr 5 [(140 2 age) 3 weight]/(Pcr 3 72) for men or Ccr 5 [(140 2 age) 2 weight]/(Pcr 3 85) for women, where Ccr is creatinine clearance and is given in mL/min, Pcr is serum creatinine concentration and is given in mg/dL, age is given in years, and weight is given in kg. Estimated creatinine clearance was then adjusted for body surface area and expressed per 1.73 m2. To convert mL/min to mL/s, multiply by 0.01667; to convert mL/min per 1.73 m2 to mL z s22 z m22, multiply by 0.00963; to convert mg/dL to mmol/L, multiply by 88.4.
16 March 1999
•
Annals of Internal Medicine
•
Volume 130
•
Number 6
465
Table 2.
Multiple Regression Models To Predict Glomerular Filtration Rate (mL/min per 1.73 m2) from Serum Creatinine Concentration*
Variable
Change in GFR per 10% Change in Variable (95% CI) Model Based on Demographic, Serum, and Urine Variables (Equation 6)
Multiplication Factor for GFR (95% CI)
Model Based on Demographic and Serum Variables Only (Equation 7)
Model Based on Demographic, Serum, and Urine Variables (Equation 6)
Model Based on Demographic and Serum Variables Only (Equation 7)
27.8 (28.2 to 27.5) 21.6 (21.9 to 21.3) 22.7 (23.1 to 22.4) 2.4 (2.1 to 2.7) –
29.1 (29.4 to 28.8) 21.7 (22.0 to 21.4) 21.6 (21.9 to 21.3) – 3.1 (2.1 to 4.0)
– – – – –
– – – – –
– –
– –
0.82 (0.80 to 0.84) 1.18 (1.15 to 1.21)
0.76 (0.75 to 0.78) 1.18 (1.15 to 1.21)
% Continuous Serum creatinine concentration Age Serum urea nitrogen concentration Urine urea nitrogen concentration Serum albumin concentration Dichotomous Sex (female) Ethnicity (black)
* GFR 5 glomerular filtration rate; P , 0.001 for all variables.
In equation 6 (the model including urine biochemistry variables), lower urine urea nitrogen excretion was also an independent predictor of lower GFR, which could reflect the association of lower protein intake with lower GFR. In the randomized cohort of the MDRD Study, we previously showed that lower protein intake causes a reduction in GFR (44, 45). Alternatively, the relation between GFR and urine urea nitrogen that we saw in the baseline cohort may reflect a spontaneous reduction in protein intake that occurs as renal function declines in chronic renal disease. In equation 7 (the model excluding urine biochemistry values), serum albumin concentration seems to substitute for urine urea nitrogen concentration with little loss of accuracy; this may also reflect protein intake. A diagnosis of diabetes was not an independent predictor of GFR. Some authors have suggested that the relation between serum creatinine concenTable 3.
Comparison of Equations To Predict Glomerular Filtration Rate (mL/min per 1.73 m2) from Serum Creatinine Concentration*
Equation 1: Serum creatinine GFR 5 0.69 3 [100/Pcr] Equation 2: Cockcroft–Gault formula GFR 5 0.84 3 [Cockcroft–Gault formula] Equation 3: Creatinine clearance GFR 5 0.81 3 [Ccr] Equation 4: Average of creatinine and urea clearance GFR 5 1.11 3 [(Ccr 1 Curea)/2] Equation 5: Creatinine clearance, urea clearance, and demographic variables GFR 5 1.04 3 [Ccr]10.751 3 [Curea]10.226 3 [1.109 if patient is black] Equation 6: Demographic, serum, and urine variables GFR 5 198 3 [Pcr]20.858 3 [Age]20.167 3 [0.822 if patient is female] 3 [1.178 if patient is black] 3 [SUN]20.293 3 [UUN]10.249 Equation 7: Demographic and serum variables only GFR 5 170 3 [Pcr]20.999 3 [Age]20.176 3 [0.762 if patient is female] 3 [1.180 if patient is black] 3 [SUN]20.170 3 [Alb]10.318 * Cockcroft–Gault formula and creatinine clearance are adjusted for body surface area. Age, sex, and weight each had a P value . 0.75; none of them entered equation 5. Alb 5 serum albumin concentration (g/dL); Ccr 5 creatinine clearance (mL/min per 1.73 m2); Curea 5 urea clearance (mL/min per 1.73 m2); Pcr 5 serum creatinine concentration (mg/dL); SUN 5 serum urea nitrogen concentration (mg/dL); UUN 5 urine urea nitrogen concentration (g/d).
466
16 March 1999
•
Annals of Internal Medicine
•
tration and GFR differs between diabetic and nondiabetic patients. In other analyses (data not shown), a term for diabetes forced into the multivariable model (equation 7) was nonsignificant (P 5 0.19). For both multiple regression models, serum creatinine concentration was the most important predictor variable. Variability in serum creatinine concentration accounted for 80.4% of the variability in GFR (R2, data not shown). Table 2 shows the expected changes in mean GFR for 10% changes in continuous variables (serum creatinine level, age, serum urea nitrogen level, urine urea nitrogen level, and serum albumin level). For example, a 10% increase in serum creatinine was associated with a 7.8% and 9.1% decrease in mean GFR, respectively, in both multiple regression models (equations 6 and 7), assuming no change in the remaining variables. Table 2 lists multiplication factors for dichotomous variables (sex and ethnicity). For example, in both models, black ethnicity was associated with a multiplication factor of 1.18, indicating that the expected mean GFR is 18% higher for black persons than for white persons when the same values are assumed for the other predictor variables. Comparison of Prediction Equations
We compared the seven equations (Table 3) for their performance in predicting log GFR in the validation sample (Figure 4). The maximal R2 value (91.2%) was associated with the multiple regression model that included urine biochemistry variables (equation 6). The multiple regression model derived from only demographic and serum biochemistry values (equation 7) was only slightly less precise (R2 5 90.3%). The differences in R2 among the equations may seem small, but the accuracy of equations 6 and 7 compared with equation 1 reflects
Volume 130
•
Number 6
a reduction in unexplained variance (1 2 R2) by more than half (from 19.6% to a range of 8.8% to 9.7%). The improvement in performance can also be shown by comparing the percentage absolute differences between the predicted and measured GFR values for each equation (Figure 4). A lower percentage absolute difference indicates a more narrow distribution of predicted GFR values, which reflects a more accurate estimate of measured GFR. The multiple regression models (equations 6 and 7) were the most accurate, especially for the 75th and 90th percentiles of the percentage absolute differences. Of note, equation 7, which does not require urine collection, provided a more precise estimate of GFR than the measured creatinine clearance (equation 3) or the equations based on measured creatinine and urea clearances (equations 5 and 6). Each of the alternative prediction equations in Table 3 included a multiplication factor derived from the training sample to correct for bias before comparisons with the MDRD Study prediction equations. For example, creatinine clearance predicted by the Cockcroft–Gault equation overestimated measured GFR by 16%. In clinical practice, such bias adjustments are not usually made. Thus, in clinical settings, the difference in performance among the equations from the MDRD Study and the alternative methods can be expected to be greater than that suggested by Figure 4. Without adjustments for bias, the median absolute errors (and the median percentage absolute errors) for the Cockcroft–Gault equation and equation 7 (from the MDRD Study) were 6.8 mL/min per 1.73 m2 (19.8%) and 3.8 mL/min per 1.73 m2 (11.5%), respectively. The 75th percentile of the percentage absolute errors was 12.2 mL/min per 1.73 m2 (33.5%) for the Cockcroft–Gault equation and 6.9 mL/min per 1.73 m2 (19.8%) for equation 7. The 90th percentile of the percentage absolute errors was 19.1 mL/min per 1.73 m2 (47.5%) for the Cockcroft– Gault equation and 12.9 mL/min per 1.73 m2 (28.4%) for equation 7.
Figure 3. Relation of predicted glomerular filtration rate (GFR) to measured GFR. Each point represents the baseline measurement during the Modification of Diet in Renal Disease (MDRD) Study (n 5 1628). Top. Glomerular filtration rate predicted by using MDRD Study equation 6. Bottom. Glomerular filtration rate predicted by using MDRD Study equation 7. Solid lines are lines of identity. To convert mL/min per 1.73 m2 to mL z s22 z m22, multiply by 0.00963.
serum creatinine ($177 mmol/L [2.0 mg/dL]) who underwent repeated measurement of GFR by renal clearance of 99mTc-diethylenetriamine pentaacetic acid. The absolute differences between predicted and measured GFR were consistently higher for the Walser equations than for the MDRD Study equations (14.2% to 16.7% for the median percentage absolute error, 25.7% to 25.9% for the 75th percentile of the absolute error, and 35.5% to 41.3% for the 90th percentile of the absolute error).
Comparison of Prediction Equations in Patients with Higher Serum Creatinine Concentrations
In the subgroup of patients with serum creatinine concentrations greater than 221 mmol/L (2.5 mg/ dL), the median percentage absolute differences in the validation sample between measured GFR and GFR predicted from equations 6 and 7 were similar to results obtained with data from the full study group (Figure 4). Values for R2 were not computed for the subgroup because of the smaller range of GFR. We also compared the MDRD Study prediction equations to the three prediction equations reported by Walser and coworkers (22), which were derived from patients with higher concentrations of 16 March 1999
Discussion The systematic evaluation of many patients with chronic renal disease during the baseline period of the MDRD Study allowed us to evaluate the relation of serum creatinine concentration to GFR. Using this large database and multiple regression analy•
Annals of Internal Medicine
•
Volume 130
•
Number 6
467
Figure 4. Comparison of equations to predict glomerular filtration rate (GFR). The values of R2 indicate the percentage of variance of log GFR accounted for in the validation sample (n 5 558) by equations derived from the training sample (n 5 1070). The values of 1 2 R2 indicate the percentage of variance in log GFR that is unexplained by each equation. Ccr 5 creatinine clearance; Curea 5 urea clearance; Pcr 5 serum creatinine concentration.
ses, we developed equations for predicting GFR from the serum creatinine concentration and compared them with other equations. The equations based on measured or estimated creatinine clearance systematically overestimated GFR. Even after adjustment to correct for these systematic errors, variability in predicted GFR compared with measured GFR was lowest in the regression equations developed from the MDRD Study database (R2 5 91.2% for equations 6 and 90.3% for equation 7) (Table 3). Furthermore, accuracy was maintained even when the validation sample was restricted to patients with higher concentrations of serum creatinine ($221 mmol/L [2.5 mg/dL]). Therefore, the MDRD Study prediction equations seem to be more accurate (they demonstrate less bias and greater precision) in predicting GFR than measured creatinine clearance or other commonly used equations. Factors associated with creatinine excretion, such as age, sex, and ethnicity, are included in the equations from the MDRD Study and contribute to their accuracy. However, equations 6 and 7 do not include urine creatinine excretion and both equations provide a more accurate estimate of GFR than does measured creatinine clearance. Eliminating 24-hour urine collections for the clinical estimation of renal function (equation 7) would simplify the procedures used in most general medicine, geriatric, oncology, and nephrology practices. Inaccurate estimation of the level of renal function can lead to failure to identify the onset of renal insufficiency and end-stage renal disease and to errors in the prescribed dosage of drugs for patients with chronic renal disease. Table 4 gives examples 468
16 March 1999
•
Annals of Internal Medicine
•
of creatinine clearance predicted from the Cockcroft–Gault equation and GFR predicted from the MDRD Study equation (equation 7) for hypothetical patients with varying serum creatinine concentrations and other characteristics. These examples demonstrate the wide range of values of renal function predicted in patients with the same value for serum creatinine (124 or 354 mmol/L [1.4 or 4.0 mg/dL]). Most important, these examples show that the predicted level of renal function is lower, especially in older persons and in women, than might have been anticipated from inspection of the serum creatinine alone, as is usually done in clinical practice. Patients with a serum creatinine concentration of 124 mmol/L (1.4 mg/dL), a value within the normal range in many clinical laboratories, would have renal insufficiency, as defined by serum creatinine concentration, creatinine clearance, or GFR less than two standard deviations below the normal range. Patients with a serum creatinine concentration of 354 mmol/L (4.0 mg/dL) would be approaching end-stage renal disease, as defined by a GFR less than 0.0963 mL z s22 z m22 (10 mL/min per 1.73 m2). These examples emphasize the importance of routinely using an equation to estimate the level of renal function. The MDRD Study prediction equation (equation 7), which could be easily implemented in clinical practice, has several advantages over other equations. Equation 7 predicts GFR rather than creatinine clearance; uses a validated method for measuring GFR (renal clearance of 125I-iothalamate) (33, 34); uses the method for measuring serum creatinine (the kinetic alkaline picrate reaction) that has been most widely accepted in U.S. clinical laboratories (46); has been validated in a cohort of patients (the validation sample) that differed from the cohort used to derive it (the training sample); predicts GFR over a wide range of values and can therefore be used for various purposes (including adjusting the doses of medications excreted by glomerular filtration, identifying renal insufficiency, assessing the progression of renal disease, and detecting the onset of end-stage renal disease); seems to be more accurate than the other equations tested; does not require collection of a timed urine sample or measurement of height and weight; includes a term for ethnicity (which is important because chronic renal disease is more prevalent among black persons); and does not require knowledge of the cause of renal disease. In addition, the required demographic data are readily available, and the measurements of urea nitrogen and albumin can be obtained from the same serum sample used for measurement of creatinine. The predicted GFR could be computed and reported by the clinical laboratory that receives the blood sample and patient demographic data.
Volume 130
•
Number 6
However, there are disadvantages to using the MDRD Study prediction equation. First, the validation sample was drawn from the same population as the training sample. Thus, the performance of the MDRD Study equation in populations with different distributions of patient characteristics may not be the same as the performance seen in the MDRD Study validation sample. However, the MDRD Study prediction equation performed consistently well in each of the patient subgroups indicated in Table 1 (data not shown), suggesting that it may perform relatively well in populations with different proportions of patients in these particular subgroups. Second, the prediction equation has not been tested in all subgroups. For example, persons without renal disease, persons with type 1 diabetes, and persons with type 2 diabetes who receive insulin, children (persons , 18 years of age), elderly persons (persons . 70 years of age), pregnant women, patients with serious comorbid conditions, and renal transplant recipients were not eligible for entry into the MDRD Study during the baseline period. In addition, the prediction equation has been tested in relatively few black persons (n 5 197; 12%) and persons with type 2 diabetes who are not receiving insulin (n 5 99 [6%]). It has not been tested in patients with extreme values for serum albumin concentration. Reduction in serum albumin concentration may be caused by factors other than reduction in dietary protein intake, such as major surgery, liver disease, systemic inflammatory disease, malignant conditions, or severe cases of the nephrotic syndrome. However, to our knowledge, no other prediction equation has been tested in such a large number of patients with diverse characteristics and diverse causes of chronic renal disease. Studies in different populations would help establish further usefulness of the MDRD Study prediction equation. Third, determination of the correct drug dosage may require computation of GFR that is not adjusted for body surface area (mL/min). Unadjusted GFR can be computed by multiplying the value of predicted GFR by the term body surface area/1.73 m2 without loss of accuracy. Fourth, as with all prediction equations based on serum creatinine concentration, the MDRD Study prediction equation is inaccurate for patients not in a steady state of creatinine balance (such as patients with acute renal failure). The equation is also inaccurate for patients in whom drugs or medical conditions interfere with creatinine secretion (for example, cimetidine or trimethoprim therapy) or creatinine assay (for example, diabetic ketoacidosis or administration of certain cephalosporins). In these circumstances, accurate assessment of GFR requires clearance measurements. In principle, the MDRD Study prediction equation could also be used to assess the level of renal 16 March 1999
Table 4.
Pcr mg/dL 1.4 1.4 1.4 1.4 1.4 1.4 1.4 1.4 4.0 4.0 4.0 4.0 4.0 4.0 4.0 4.0
Examples of Estimating Renal Function from Serum Creatinine by Using the Cockcroft–Gault Equation and Modification of Diet in Renal Disease Study Prediction Equation*
Age
Sex
Ethnicity
y 45 45 45 45 70 70 70 70 45 45 45 45 70 70 70 70
Male Male Female Female Male Male Female Female Male Male Female Female Male Male Female Female
White Black White Black White Black White Black White Black White Black White Black White Black
Predicted Ccr†
Predicted GFR‡
mL/min
mL/min per 1.73 m2
71 71 52 52 52 52 38 38 25 25 18 18 18 18 13 13
58 68 44 52 54 63 41 48 17 20 13 15 15 18 12 14
* Ccr 5 creatinine clearance; GFR 5 glomerular filtration rate; Pcr 5 serum creatinine concentration. † Determined by using the Cockcroft–Gault formula, assuming body weight of 75 kg in men and 65 kg in women. Predicted Ccr is multiplied by 0.85 in women. The normal mean value for Ccr is 140 and 125 mL/min per 1.73 m2 in young men and young women, respectively. The normal standard deviation is approximately 20 mL/min per 1.73 m2. To convert mL/min to mL/s, multiply by 0.01667. ‡ Determined by using Modification of Diet in Renal Disease Study equation 7, assuming 1) serum urea nitrogen concentration of 20 mg/dL and serum albumin concentration of 4.0 mg/dL when serum creatinine concentration is 1.4 mg/dL and 2) serum urea concentration of 50 mg/dL and serum albumin concentration of 3.5 mg/dL when serum creatinine concentration is 4.0 mg/dL. The normal mean value for GFR (insulin clearance) is 130 and 120 mL/min per 1.73 m2 in young men and young women, respectively. The normal standard deviation is approximately 20 mL/min per 1.73 m2. To convert mL/min per 1.73 m2 to mL z s22 z m22, multiply by 0.00963.
function in clinical research studies. In particular, we and others (44) have shown that the serum creatinine concentration can be misleading when used to judge the efficacy of therapies designed to slow the progression of chronic renal disease, especially dietary protein restriction. Whether assessment of changes in predicted GFR would be more useful than measurements of changes in serum creatinine concentration has not been evaluated. In summary, we have developed a new equation (Table 3, equation 7) to predict GFR that uses serum creatinine concentration, demographic characteristics (age, sex, and ethnicity), and other serum measurements (urea nitrogen and albumin concentrations) and is more accurate than other widely used prediction equations. The process of computing and reporting GFR that is predicted from serum creatinine concentrations could be implemented in clinical laboratories by routinely requesting patient demographic data and by measuring serum urea nitrogen and serum albumin levels in addition to serum creatinine levels. We recommend routinely using the MDRD Study prediction equation to predict GFR from serum creatinine concentration. Note Added in Proof: Since submission of the manuscript, additional studies have been performed that •
Annals of Internal Medicine
•
Volume 130
•
Number 6
469
validate the MDRD Study prediction equation in other groups of patients with chronic renal disease, including MDRD Study randomly assigned patients at the onset of end-stage renal disease (47), black persons with hypertensive renal disease (48), and renal transplant recipients (with a high proportion of diabetic patients) (49). The equation has not been validated in persons without renal disease. Presented in part at the Seventh International Congress on Nutrition and Metabolism in Renal Disease, Stockholm, Sweden, 29 May–1 June 1994, and the 30th Annual Meeting of the American Society of Nephrology, San Antonio, Texas, 2– 6 November 1997. Grant Support: By the National Institute of Diabetes and Digestive and Kidney Diseases and the Health Care Financing Administration. Requests for Reprints: Andrew S. Levey, MD, New England Medical Center, 750 Washington Street, Box 391, Boston, MA 02111. Current Author Addresses: Dr. Levey: New England Medical Center, 750 Washington Street, Box 391, Boston, MA 02111; e-mail,
[email protected]. Dr. Bosch: George Washington University, 901 23rd Street SW, Washington, DC 20037. Dr. Lewis and Ms. Rogers: Vanderbilt University Medical Center, 1211 22nd Avenue S, Nashville, TN 37232. Dr. Greene: Cleveland Clinic Foundation, 9500 Euclid Avenue, Cleveland, OH 44195. Dr. Roth: University of Miami Medical Center, 1475 NW 12th Avenue, Miami, FL 33136.
References
16 March 1999
•
Annals of Internal Medicine
21.
22.
23.
24.
25. 26. 27.
28.
29.
30.
31.
32.
33.
1. Smith HW. Diseases of the kidney and urinary tract. In: The Kidney: Structure and Function in Health and Disease. New York: Oxford Univ Pr; 1951:836-87. 2. Levey AS. Measurement of renal function in chronic renal disease. Kidney Int. 1990;38:167-84. 3. Perrone RD, Madias NE, Levey AS. Serum creatinine as an index of renal function: new insights into old concepts. Clinical Chem. 1992;38:1933-53. 4. Cockcroft DW, Gault MH. Prediction of creatinine clearance from serum creatinine. Nephron. 1976;16:31-41. 5. Parker RA, Bennett WM, Porter GA. Clinical estimation of creatinine clearance without urine collection. Dialysis and Transplantation. 1980;9:251-2. 6. Sawyer WT, Canaday BR, Poe TE, Webb CE, Gal P, Joyner PU, et al. Variables affecting creatinine clearance prediction. Am J Hosp Pharm. 1983; 40:2175-80. 7. Bjornsson TD, Cocchetto DM, McGowan FX, Verghese CP, Sedor F. Nomogram for estimating creatinine clearance. Clin Pharmacokinet. 1983;8:365-9. 8. Taylor GO, Bamgboye EA, Oyediran AB, Longe O. Serum creatinine and prediction formulae for creatinine clearance. Afr J Med Med Sci. 1982;11:175-81. 9. Gates GF. Creatinine clearance estimation from serum creatinine values: an analysis of three mathematical models of glomerular function. Am J Kidney Dis. 1985;5:199-205. 10. Jelliffe RW. Creatinine clearance: bedside estimate [Letter]. Ann Intern Med. 1973;79:604-5. 11. Hallynck T, Soep HH, Thomis J, Boelaert J, Daneels R, Fillastre JP, et al. Prediction of creatinine clearance from serum creatinine concentration based on lean body mass. Clin Pharm Ther. 1981;30:414-21. 12. Kampmann J, Siersbaek-Nielsen K, Kristensen M, Hansen JM. Rapid evaluation of creatinine clearance. Acta Med Scand. 1974;196:517-20. 13. Bro¨chner-Mortensen J, Ro¨dbro P. Selection of routine method for determination of glomerular filtration rate in adult patients. Scand J Clin Lab Invest. 1976;36:35-43. 14. Tessitore N, Lo Schiavo C, Corgnati A, Previato G, Valvo E, Lupo A, et al. 125I-iothalamate and creatinine clearances in patients with chronic renal diseases. Nephron. 1979;24:41-5. 15. Bauer JH, Brooks CS, Burch RN. Renal function studies in man with advanced renal insufficiency. Am J Kidney Dis. 1982;2:30-5. 16. Van Lente F, Suit P. Assessment of renal function by serum creatinine and creatinine clearance: glomerular filtration rate estimated by four procedures. Clin Chem. 1989;35:2326-30. 17. Trollfors B, Alestig K, Jagenburg R. Prediction of glomerular filtration rate from serum creatinine, age, sex and body weight. Acta Med Scand. 1987; 221:495-8. 18. Groth S, Aasted M, Vestergaard B. Screening of kidney function by plasma creatinine and single-sample 51Cr-EDTA clearance determination—a comparison. Scand J Clin Lab Invest. 1989;49:707-10. 19. Lemann J, Bidani AK, Bain RP, Lewis EJ, Ronde RD. Use of the serum
470
20.
•
34.
35. 36. 37. 38. 39.
40.
41.
42. 43. 44.
45.
46. 47.
48.
49.
Volume 130
creatinine to estimate glomerular filtration rate in health and early diabetic nephropathy. Collaborative Study Group of Angiotensin Converting Enzyme Inhibition in Diabetic Nephropathy. Am J Kidney Dis. 1990;16:236-43. DeSanto NG, Coppola S, Anastasio P, Coscarella G, Capasso G, Bellini L, et al. Predicted creatinine clearance to assess glomerular filtration rate in chronic renal disease in humans. Am J Nephrol. 1991;11:181-5. Sampson MJ, Drury PL. Accurate estimation of glomerular filtration rate in diabetic nephropathy from age, body weight, and serum creatinine. Diabetes Care. 1992;15:609-12. Walser M, Drew HH, Guldan JL. Prediction of glomerular filtration rate from serum creatinine concentration in advanced chronic renal failure. Kidney Int. 1993;44:1145-8. Cochran M, St John A. A comparison between estimates of GFR using [99mTc]DTPA clearance and the approximation of Cockroft and Gault. Aust N Z J Med. 1993;23:494-7. Pollock C, Gyory AZ, Hawkins T, Ross M, Ibels L. Comparison of simultaneous renal clearances of true endogenous creatinine and subcutaneously administered iothalamate in man. Am J Nephrol. 1995;15:277-82. U.S. Department of Health and Human Services. HCFA-2728-U4 (4-95). Form Approved: OMB No. 0938-0046, Health Care Financing Administration. American Society of Transplant Physicians. Scientific Symposium on Listing Criteria: Kidney. Bethesda, MD; 30 January 1997. Klahr S, Levey AS, Beck GJ, Caggiula AW, Hunsicker L, Kusek JW, Striker G. The effects of dietary protein restriction and blood-pressure control on the progression of renal disease. Modification of Diet in Renal Disease Study Group. N Engl J Med. 1994;330:877-84. Peterson JC, Adler S, Burkhart JM, Greene T, Hebert LA, King AJ, et al. Blood pressure control, proteinuria, and the progression of renal disease. The Modification of Diet in Renal Disease Study. Ann Intern Med. 1995;123:754-62. Levey AS, Adler S, Caggiula AW, England BK, Greene T, Hunsicker LG, et al. Effects of dietary protein restriction on the progression of advanced renal disease in the Modification of Diet in Renal Disease Study. Am J Kidney Dis. 1996;27:652-63. Effects of dietary protein restriction on the progression of moderate renal disease in the Modification of Diet in Renal Disease Study. J Am Soc Nephrol. 1996;7:2616-25. Beck GJ, Berg RL, Coggins CH, Gassman JJ, Hunsicker LG, Williams GW. Design and statistical issues of the Modification of Diet in Renal Disease Trial. The Modification of Diet in Renal Disease Study Group. Control Clin Trials. 1991;12:566-86. Kusek JW, Coyne T, de Velasco A, Drabik MJ, Finlay RA, Gassman JJ, et al. Recruitment experience in the full-scale phase of the Modification of Diet in Renal Disease Study. Control Clin Trials. 1993;14:538-57. Perrone R, Steinman TI, Beck GJ, Skibinski CI, Royal H, Lawlor M, et al. Utility of radioisotopic filtration markers in chronic renal insufficiency: simultaneous comparison of 125I-iothalamate,169Yb-DTPA, 99mTc-DTPA, and inulin. The Modification of Diet in Renal Disease Study Group. Am J Kidney Dis. 1990;16:224-35. Levey AS, Greene T, Schluchter MD, Cleary PA, Teschan PE, Lorenz RA, et al. Glomerular filtration rate measurements in clinical trials. Modification of Diet in Renal Disease Study Group and the Diabetes Control and Complications Trial Research Group. J Am Soc Nephrol. 1993;4:1159-71. Astra-8 Operations Manual. Fullerton, CA: Beckman. DuBois D, DuBois EF. A formula to estimate the approximate surface area if height and weight be known. Arch Intern Med. 1916;17:863-71. Frisancho AR. Anthropometric Standards for the Assessment of Growth and Nutritional Status. Ann Arbor, MI: Univ of Michigan Pr; 1990. Maroni BJ, Steinman TI, Mitch WE. A method for estimating nitrogen intake of patients with chronic renal failure. Kidney Int. 1985;27:58-65. Buckalew VM Jr, Berg RL, Wang SR, Porush JG, Rauch S, Schulman G. Prevalence of hypertension in 1,795 subjects with chronic renal disease: the modification of diet in renal disease study baseline cohort. Modification of Diet in Renal Disease Study Group. Am J Kidney Dis. 1996;28:811-21. Heymsfield SB, Arteaga C, McManus C, Smith J, Moffitt S. Measurement of muscle mass in humans: validity of the 24-hour urinary creatinine method. Am J Clin Nutr. 1983;37:478-94. Cohn SH, Abesemis C, Zanzi I, Aloia JF, Yasumura S, Ellis KJ. Body elemental composition: comparison between black and white adults. Am J Physiol. 1977;232:E419-22. Harsha DW, Frerichs RR, Berenson GS. Densitometry and anthropometry of black and white children. Hum Biol. 1978;50:261-80. Worrall JG, Phongsathorn V, Hooper RJ. Racial variation in serum creatine kinase unrelated to lean body mass. Br J Rheumatol. 1990;29:371-3. Effects of diet and antihypertensive therapy on creatinine clearance and serum creatinine concentration in the Modification of Diet in Renal Disease Study. J Am Soc Nephrol. 1996;7:556-65. Short-term effects of protein intake, blood pressure, and antihypertensive therapy on glomerular filtration rate in the Modification of Diet in Renal Disease Study. J Am Soc Nephrol. 1996;7:2097-109. Hartmann AE. Accuracy of creatinine results reported by participants in the CAP Chemistry Survey Program. Arch Pathol Lab Med. 1985;109:1068-71. Levey AS, Greene P, Burkart J. Comprehensive assessment of the level of renal function at the initiation of dialysis in the MDRD study [Abstract]. MDRD Study Group. J Am Soc Nephrol. 1998;9:153A. Breyer-Lewis J, Agodoa L, Cheek D, Greene P, Middleton J, O’Connor D, et al. Estimation of GFR from serum creatinine in the African-American Study of Kidney Disease [Abstract]. AASK Study Group. J Am Soc Nephrol. 1998;9:153A. Bedros FV, Kasiske BL. Estimating glomerular filtration rate from serum creatinine in renal transplant recipients [Abstract]. J Am Soc Nephrol. 1998;9:666A. •
Number 6