A Persistent Oxygen Anomaly Reveals the Fate of Spilled Methane in the Deep Gulf of Mexico John D. Kessler, et al. Science 331, 312 (2011); DOI: 10.1126/science.1199697
This copy is for your personal, non-commercial use only.
If you wish to distribute this article to others, you can order high-quality copies for your colleagues, clients, or customers by clicking here.
The following resources related to this article are available online at www.sciencemag.org (this infomation is current as of January 25, 2011 ): Updated information and services, including high-resolution figures, can be found in the online version of this article at: http://www.sciencemag.org/content/331/6015/312.full.html Supporting Online Material can be found at: http://www.sciencemag.org/content/suppl/2011/01/03/science.1199697.DC1.html This article cites 19 articles, 5 of which can be accessed free: http://www.sciencemag.org/content/331/6015/312.full.html#ref-list-1 This article appears in the following subject collections: Geochemistry, Geophysics http://www.sciencemag.org/cgi/collection/geochem_phys Microbiology http://www.sciencemag.org/cgi/collection/microbio Oceanography http://www.sciencemag.org/cgi/collection/oceans
Science (print ISSN 0036-8075; online ISSN 1095-9203) is published weekly, except the last week in December, by the American Association for the Advancement of Science, 1200 New York Avenue NW, Washington, DC 20005. Copyright 2011 by the American Association for the Advancement of Science; all rights reserved. The title Science is a registered trademark of AAAS.
Downloaded from www.sciencemag.org on January 25, 2011
Permission to republish or repurpose articles or portions of articles can be obtained by following the guidelines here.
liquid outer core being subadiabatic and probably stably stratified. Such stable stratification is a natural consequence of the adiabat of iron alloys probably being steeper than their liquidus at lunar core conditions (21) and is consistent with the present absence of a lunar dynamo. An attenuating, probably partial melt-bearing layer at the base of the mantle provides a constraint on the thermal regime and hence on core chemistry. Characteristic estimates of the anhydrous solidi of possible lunar mantle materials at lowermost mantle pressures typically lie above ~1650 K (22–24). Therefore, the solidi temperatures imply that the sulfur content within the lunar outer core is ~6 weight % or less (Fig. 4). If significant water is present at depth in the deep Moon, then solidus temperatures would be lowered in the partially molten zone, and somewhat higher sulfur contents would be permitted. The depletion in lighter alloying components relative to Earth’s core is consistent with depletion of the lunar interior in volatile elements relative to Earth. Such depletion is a natural consequence of the lunar formation process, through high-temperature devolatilization during the Moon-forming impact: In effect, the present lunar core is probably composed of thermally processed material from the core of the impactor (25).
References and Notes 1. M. A. Wieczorek et al., Rev. Mineral. Geochem. 60, 221 (2006). 2. A. S. Konopliv, A. B. Binder, L. L. Hood, W. L. Kucinskas, J. G. Williams, Science 281, 1476 (1998). 3. J. G. Williams, D. H. Boggs, C. F. Yoder, J. T. Ratcliff, J. O. Dickey, J. Geophys. Res. 106, 933 (2001). 4. L. L. Hood, D. L. Mitchell, R. P. Lin, M. H. Acuna, A. B. Binder, Geophys. Res. Lett. 26, 2327 (1999). 5. P. Lognonné, C. Johnson, Treatise Geophys. 10, 69 (2007). 6. Y. Nakamura, J. Geophys. Res. 88, 677 (1983). 7. P. Lognonné, J. Gagnepain-Beyneix, H. Chenet, Earth Planet. Sci. Lett. 211, 27 (2003). 8. J. Gagnepain-Beyneix, P. Lognonné, H. Chenet, D. Lombardi, T. Spohn, Phys. Earth Planet. Inter. 159, 140 (2006). 9. A. Khan, J. A. D. Connolly, J. Maclennan, K. Mosegaard, Geophys. J. Int. 168, 243 (2007). 10. Y. Nakamura, J. Geophys. Res. 110, E01001 (2005). 11. S. Rost, C. Thomas, Rev. Geophys. 40, 1008 (2002). 12. Methods are available as supporting material on Science Online. 13. Y. Nakamura, Proc. Lunar Planet. Sci. Conf. 9th 3, 3589 (1978). 14. R. C. Bulow, C. L. Johnson, P. M. Shearer, J. Geophys. Res. 110, E10003 (2005). 15. Q. Williams, E. J. Garnero, Science 273, 1528 (1996). 16. C. Sanloup et al., Geophys. Res. Lett. 27, 811 (2000). 17. Y. Nakamura et al., Geophys. Res. Lett. 1, 137 (1974). 18. J. G. Williams, D. H. Boggs, J. T. Ratcliff, paper presented at the 41st Lunar and Planetary Science Conference, The Woodlands, TX, 1 to 5 March 2010. Sponsored by the Lunar and Planetary Institute.
A Persistent Oxygen Anomaly Reveals the Fate of Spilled Methane in the Deep Gulf of Mexico John D. Kessler,1* David L. Valentine,2* Molly C. Redmond,2 Mengran Du,1 Eric W. Chan,1 Stephanie D. Mendes,2 Erik W. Quiroz,3 Christie J. Villanueva,2 Stephani S. Shusta,2 Lindsay M. Werra,2 Shari A. Yvon-Lewis,1 Thomas C. Weber4 Methane was the most abundant hydrocarbon released during the 2010 Deepwater Horizon oil spill in the Gulf of Mexico. Beyond relevancy to this anthropogenic event, this methane release simulates a rapid and relatively short-term natural release from hydrates into deep water. Based on methane and oxygen distributions measured at 207 stations throughout the affected region, we find that within ~120 days from the onset of release ~3.0 × 10¹⁰ to 3.9 × 10¹⁰ moles of oxygen were respired, primarily by methanotrophs, and left behind a residual microbial community containing methanotrophic bacteria. We suggest that a vigorous deepwater bacterial bloom respired nearly all the released methane within this time, and that by analogy, large-scale releases of methane from hydrate in the deep ocean are likely to be met by a similarly rapid methanotrophic response. he immense accumulation of methane (CH4) in the marine sub-seafloor is among the largest global carbon reservoirs (1) and has been implicated as a factor in past oceanic and climate change. Oceanic CH4 released naturally through hydrocarbon seeps, hydrothermal vents, or decomposing clathrate hydrates or anthropogenically through oil and gas exploration has the potential to influence climate, being a moderate absorber of infrared radiation (2), and ocean chemistry when it is oxidized either aerobically or anaerobically (3–6). Oceanic CH4 has
T
312
been implicated in ancient climate change [e.g., (7)]; however, little is known about potential future impacts (8). Importantly, for oceanic CH4 to directly impact climate, CH4 must enter the atmosphere without first being consumed by microbes in the ocean. On 20 April 2010, a violent and tragic CH4 discharge severed the Deepwater Horizon rig from its well. Two days later, the burning rig sank, and oil and gas began spewing into the deep Gulf of Mexico at depths of ~1.5 km until 15 July, when the well was effectively sealed. Estimates
21 JANUARY 2011
VOL 331
SCIENCE
19. S. Goossens, K. Matsumoto, Geophys. Res. Lett. 35, L02204 (2008). 20. A. S. Konopliv, S. W. Asmar, E. Carranza, W. L. Sjogren, D. N. Yuan, Icarus 150, 1 (2001). 21. Q. Williams, Earth Planet. Sci. Lett. 284, 564 (2009). 22. D. H. Green, N. G. Ware, A. J. Hibberson, W. O. Major, Earth Planet. Sci. Lett. 13, 85 (1971). 23. B. A. Wyatt, Contrib. Mineral. Petrol. 61, 1 (1977). 24. J. Longhi, Geochim. Cosmochim. Acta 70, 5919 (2006). 25. R. M. Canup, Icarus 168, 433 (2004). 26. P. S. Balog, R. A. Secco, D. C. Rubie, D. J. Frost, J. Geophys. Res. 108, 2124 (2003). 27. K. Righter, M. J. Drake, Icarus 124, 513 (1996). 28. R. Brett, P. M. Bell, Earth Planet. Sci. Lett. 6, 479 (1969). 29. B. Chen, J. Li, S. A. Hauck II, Geophys. Res. Lett. 35, L07201 (2008). 30. R. Dasgupta, A. Buono, G. Whelan, D. Walker, Geochim. Cosmochim. Acta 73, 6678 (2009). 31. This work was funded by NASA Planetary Geology and Geophysics grant NNH09AK41I to R.C.W. The authors thank four reviewers, and Y. Nakamura for helpful comments and discussions.
Supporting Online Material www.sciencemag.org/cgi/content/full/science.1199375/DC1 SOM Text Figs. S1 to S7 Tables S1 and S2 References 21 October 2010; accepted 16 December 2010 Published online 6 January 2011; 10.1126/science.1199375
of the oil emitted during the 83 days of this disaster range from 4.1 × 10⁶ to 4.4 × 10⁶ T 20% (uncertainty) barrels (9, 10). The corresponding emission of methane (CH4) could be as great as 1.25 × 10¹⁰ moles (11) or as low as 9.14 × 10⁹ moles (Table 1) (12, 13), depending on uncertainties in the gas-to-oil ratio and net oil emission. This localized CH4 emission is of similar magnitude to the natural release rate of CH4 to the entire Black Sea (14) and provided a unique opportunity to investigate the fate of CH4 released into the deep ocean and to understand the response of cold-adapted methanotrophic bacteria. The sea-air CH4 flux measured during active flow (survey area about 25 km in diameter centered on the wellhead) indicated that, even at elevated wind speeds, less than 6.8 × 10⁵ moles (i.e., <0.01%) of the emitted CH4 escaped to the atmosphere (15). The depth distributions of CH4 in the vicinity of the wellhead measured during conditions of active flow displayed high CH4 concentrations between 800- to 1200-m depth (11, 16). This spatially consistent CH4 distribution suggests that CH4 remained dissolved and suspended in the deep waters between 800- to 1 Department of Oceanography, Texas A&M University, College Station, TX 77843–3146, USA. 2Department of Earth Science and Marine Science Institute, University of California, Santa Barbara, CA 93106, USA. 3Geochemical and Environmental Research Group, Texas A&M University, College Station, TX 77843, USA. 4Center for Coastal and Ocean Mapping, University of New Hampshire, Durham, NH 03824, USA.
*To whom correspondence should be addressed. E-mail:
[email protected] (J.D.K.);
[email protected] (D.L.V.)
www.sciencemag.org
Downloaded from www.sciencemag.org on January 25, 2011
REPORTS
REPORTS previous experiments are consistent with intrusions at these depths for the scales of the Deepwater Horizon event (17). Hydrocarbon gases dissolved in the water column adjacent to the wellhead during active flow were present at relative proportions of 87.5%, 8.1%, and 4.4%, for CH4, ethane (C2H6), and propane (C3H8), re-
Table 1. Hydrocarbon emission estimates and oxygen removal potentials (13). Only oil in the deepwater intrusion layers is included. Hydrocarbon
CH4 C2H6 C3H8 Oil as (-CH2-)
Quantity emitted (moles) 0.91 1.25 0.85 1.16 4.60 6.28 0.93 1.00
× × × × × × × ×
1010 – 1010 109 – 109 108 – 108 1010 – 1010
Stoichiometric ratio O2:hydrocarbon 2:1 3.5:1 5:1 1.5:1 Total
O2-removing potential (moles)
Dissolved O2 removed (moles)
1010 – 1010 109 – 109 109 – 109 1010 – 1010 1010 – 1010
3.00 × 10¹⁰ – 3.90 × 10¹⁰
1.83 2.50 2.96 4.05 2.30 3.14 1.40 1.50 3.76 4.72
× × × × × × × × × ×
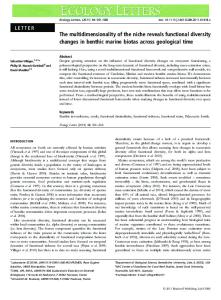
Fig. 1. (A) Sampling stations overlaid on a Google Earth image highlighting the area of the intrusion. Blue plus, red diamond, and white triangle symbols indicate sampling stations for the 18 August–2 September, 7–17 September, and 22 September–4 October 2010 expeditions, respectively. The yellow and green boundaries indicate the extent of the contouring bounds as determined from the extent of DO and fluorescence anomalies and bathymetric restrictions. (B) Contour plot within the yellow boundary of the vertically www.sciencemag.org
SCIENCE
spectively, and the variations in their proportions and isotopic compositions suggested rapid respiration of C2H6 and C3H8 but not CH4 (11). To track the fate of CH4, we conducted three expeditions to the oil spill site aboard the National Oceanic and Atmospheric Administration (NOAA) ship Pisces after flow had ceased: 18 August to 2 September, 7 to 17 September, and 22 September to 4 October 2010. During these expeditions, we tracked submerged hydrocarbon intrusions southwestward from the wellhead for 500 km by using their concurrent fluorescence and oxygen anomalies (Fig. 1). We also quantified depth distributions of dissolved CH4 and oxygen (DO) at 207 unique stations (110 for CH4 and 202 for DO) by using shipboard chemical techniques and further analyzed CH4 oxidation rates and the microbial community structure at seven representative locations (13). On the basis of elevated CH4 concentrations and pseudo-first-order CH4 oxidation rate constants of 0.001 day−1 (range from 0 to 0.013 day−1, n = 22 minus 1 outlier) measured around the wellhead in June (11), as well as the generally low oxidation rates for CH4 in deep waters along
Downloaded from www.sciencemag.org on January 25, 2011
1200-m depth as lateral intrusions from the main vertical release from the wellhead (11, 16). These subsurface intrusion layers form as a result of trapping by density stratification of seawater entrained into the jet of oil and gas initially released from the wellhead as described previously (17); the empirical relationships derived from these
integrated DO anomaly at each station using data from the 18 August–2 September 2010 expedition. Units are moles DO m−2. (C) Profiles of DO [SBE43, Sea-Bird Electronics Incorporated (Bellevue, WA); red line calibrated with Winkler titrations] and fluorescence [UV AquaTracka (emission = 360 nm), Cheslea Technologies Group (West Molesey, UK); black line] at station PC198 (26.7098°N, 90.6286°W). The green circles represent Winkler titration samples. CTD indicates conductivity, temperature, and depth. VOL 331
21 JANUARY 2011
313
REPORTS
314
phic bacteria. Of these locations, four displayed DO and fluorescence anomalies at depth, whereas three did not. Despite the lack of CH4, methylotrophic bacteria were detected at each site, with
relative abundances ranging between 5 and 36% of sequences (Fig. 2 and fig. S5). The microbial community in September 2010 differed significantly from the community identified around the
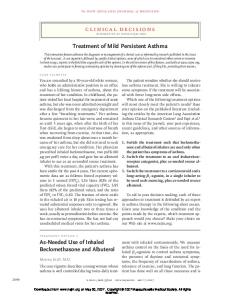
Fig. 2. Results from DNA surveys for bacterial 16S rRNA genes representing changes in community structure associated with oxidation of CH4 in samples collected from 7 to 17 September 2010. Stations are shown from left to right in order of decreasing reductions in DO. Stations 192, 222, 230, and 211 had DO and fluorescence anomalies (integrated oxygen reductions of 1.1, 0.7, 0.5, and 0.1 mol m–2, respectively), whereas stations 191, 242, and 203 did not (integrated oxygen reductions < 0.00001 mol m–2). Methylotrophs (Methylococcaceae, Methylophaga, and Methylophilaceae) are indicated by shading. The Other category includes groups observed at <5% in all samples, predominately Acidobacteria, Actinobacteria, and Verrucomibrobia. n = 56 to 79 per station for a total of 492 samples.
Fig. 3. Model results from a one-dimensional time-dependent model of (●) average DO anomaly from CH4 respiration (mM reduction in the intrusion layer), (□) average CH4 concentration (mM), and (×) firstorder CH4 oxidation rate constants (days−1) in the intrusion layers. Labels A to D on the figure represent measured values. A, average CH4 concentration = 25 mM (range from 0.57 to 183 mM; n = 73), 11 to 20 June (11); B, average CH4 concentration = 1.4 T 2.0 nM (n = 671), average CH4 oxidation rate constant = 0.0015 days−1 (range from 0.0005 to 0.0038 day−1, n = 10), 7 to 17 September; C, average CH4 oxidation rate constant = 0.001 day−1 (range from 0 to 0.0127 day−1, n = 22 minus one outlier), 11 to 20 June (11). DM, maximum dissolved O2 anomaly = 36.7 mM; DA, average dissolved O2 anomaly = 5.6 T 5.8 mM (n = 202); 18 August to 4 October 2010.
21 JANUARY 2011
VOL 331
SCIENCE
www.sciencemag.org
Downloaded from www.sciencemag.org on January 25, 2011
the continental margins (6), we expected CH4 intrusions from the Deepwater Horizon to persist for years. However, our broad August to October surveys identified no instances of elevated CH4 (Fig. 1). In fact, CH4 concentration measurements conducted during all three expeditions yielded an average CH4 concentration of 1.4 T 2.0 nM (maximum = 20.4 nM; n = 671), with the maximum concentration measured (20.4 nM) not exceeding ambient levels for the Gulf of Mexico (18). It is unlikely that CH4 intrusions were simply missed during the survey, because concurrent fluorescence and DO anomalies were identified at most stations in the deep waters (Fig. 1C), indicative of both the presence of residual oil hydrocarbons and hydrocarbon respiration. On the basis of these results, we hypothesized that methanotrophic bacteria consumed all CH4 from the Deepwater Horizon event by the 18 August– 2 September survey. As a first test of our hypothesis, we integrated the DO anomaly for our study area (Fig. 1) and compared it to the potential oxygen demand exerted by the respiration of hydrocarbons released from the wellhead (Table 1). To calculate the oxygen anomaly for the entire intrusion, we vertically integrated oxygen deficits between 700- and 1300-m water depth for each station and contoured these integrated DO anomalies over the spatial extent of the intrusion (13). Bounds for the contouring on the northern and eastern edges were chosen based on bathymetric restrictions. On the southern and western edges, bounds were defined to encompass the DO and fluorescence anomalies measured with an average buffer of 50 km to incorporate any anomalies that may have been missed during sampling (Fig. 1A). The southern and western edges of the contour area were subsequently extended outward by 50 km to test the sensitivity of the calculation to changes in intrusion area (Fig. 1A). Five different contouring methods were used to constrain the sensitivity of the total DO removal estimates to the applied algorithm (table S1) (13). The data collected during the first expedition (128 stations) were contoured separately from the second expedition (56 stations) to assess temporal variability; because the data collected during the third expedition (18 stations) did not adequately define the intrusion layer, an additional set of contour results were determined from a combined data set from expeditions 2 and 3. The integrated DO anomaly determined for the first expedition ranged from 3.00 × 10¹⁰ to 3.90 × 10¹⁰ moles of O2 removed, compared with 1.72 × 10¹⁰ to 3.24 × 10¹⁰ moles of O2 removed for the second and third expeditions. Mass balance dictates that respiration of CH4 contributed substantially to the anomaly, and its magnitude is consistent with complete consumption of CH4 and natural gas, along with partial respiration of oil (Table 1 and table S1). As a second test of our hypothesis, we cloned and sequenced 492 bacterial 16S ribosomal RNA (rRNA) genes from seven locations sampled during September 2010, searching for methylotro-
REPORTS concentration, and CH4 oxidation rate data from the three expeditions as well as previous data collected in June (11) to interpolate the time course changes. The model predicts average DO anomalies in the intrusion layer of 38 mM by midSeptember, which is greater than the average measured values of 5.6 T 5.8 mM (n = 202) but in line with the largest DO anomalies (36.7 mM) measured in the 18 August–2 September expedition. The model clearly overestimates the average DO anomaly especially because it only considers CH4 oxidation when calculating the DO loss, ignoring the influence of C2H6, C3H8, and oil respiration. Because the total quantity of oxygen removed from the intrusion waters can only be explained by the complete oxidation of CH4, C2H6, and C3H8 as well as the partial oxidation of oil, establishing a near-complete mass balance (Table 1), the most logical explanation for the discrepancy between the modeled and measured average DO anomaly in September is that the model underestimates mixing. The model further predicts CH4 oxidation rate constants increasing at the end of June and peaking at 0.2 day−1 at the end of July, followed by a return to the average measured values of 0.0015 day−1 (range from 0.0006 to 0.0038 day−1, n = 10) by mid-September (13) (Fig. 3). By using the rate constants as a proxy for population size, we estimate a net doubling time of ~3.5 days for the methanotrophic bacteria assuming exponential growth at the peak rate constant of 0.2 day−1. This is likely an upper limit because predatory effects are not considered. The specific CH4 oxidation rates needed to explain complete consumption of intruded CH4 are higher than for other deep pelagic environments (6, 21) and indicate that there is no apparent limitation to the methanotrophic response to a CH4 intrusion of this magnitude. The oxidative lifetime of the deep CH4 intrusion from Deepwater Horizon is about 120 days, with no measurable CH4 loss to the atmosphere. The delay in methanotrophy compared with respiration of C2H6 and C3H8 (11) may be attributed to the difference in initial cellular abundance and growth rates of the responsible bacteria. However, methanotrophy proceeded more rapidly than dilution once the population became established and seemingly included exponential growth, limited ultimately by substrate availability. Previous arguments have been forwarded for the massive release of CH4 from the marine subseafloor in the geologic past [e.g., (22, 23)]. An open issue is the fate of released CH4 and whether it enters the atmosphere, is oxidized in the ocean, or some combination of both processes (24, 25). Our work suggests by analogy that large-scale CH4 release to the deep ocean from gas hydrates or other natural sources may foster a rapid methanotrophic response leading to complete oxidation of CH4 to CO2 within a matter of months. Thus, aerobic methanotrophic bacterial communities may act as a dynamic biofilter that responds rapidly to large-scale CH4 inputs into the deep ocean.
www.sciencemag.org
SCIENCE
VOL 331
References and Notes 1. W. S. Reeburgh, in Treatise on Geochemistry, H. D. Holland, K. K. Turekian, Eds. (Elsevier-Pergamon, Oxford, 2003), vol. 4, pp. 65–89. 2. L. S. Rothman et al., J. Quant. Spectrosc. Radiat. Transf. 96, 139 (2005). 3. B. B. Ward, K. A. Kilpatrick, P. C. Novelli, M. I. Scranton, Nature 327, 226 (1987). 4. M. J. Alperin, W. S. Reeburgh, M. J. Whiticar, Global Biogeochem. Cycles 2, 279 (1988). 5. W. S. Reeburgh et al., Deep-Sea Res. 38, S1189 (1991). 6. D. L. Valentine, D. C. Blanton, W. S. Reeburgh, M. Kastner, Geochim. Cosmochim. Acta 65, 2633 (2001). 7. G. R. Dickens, in Natural Gas Hydrates: Occurrence, Distribution, and Detection, C. K. Paull, W. P. Dillon, Eds. (American Geophysical Union, Washington, DC, 2001), pp. 19–38. 8. A. G. Judd, M. Hovland, L. I. Dimitrov, S. G. Gil, V. Jukes, Geofluids 2, 109 (2002). 9. T. J. Crone, M. Tolstoy, Science 330, 634 (2010); 10.1126/science.1195840. 10. U.S. Geological Survey, “Deepwater Horizon MC252 Gulf incident oil budget: Government estimates - through August 01 (day 104)” (2010); available at www.noaanews.noaa.gov/ stories2010/PDFs/DeepwaterHorizonOilBudget20100801.pdf. 11. D. L. Valentine et al., Science 330, 208 (2010); 10.1126/science.1196830. 12. U.S. Department of Energy, Deepwater Horizon Response, www.energy.gov/open/oilspilldata.htm. 13. Materials and methods are available on Science Online. 14. J. D. Kessler et al., Earth Planet. Sci. Lett. 243, 366 (2006). 15. S. A. Yvon-Lewis, L. Hu, J. D. Kessler, Geophys. Res. Lett. (2011). 16. R. Camilli et al., Science 330, 201 (2010); 10.1126/science.1195223. 17. S. A. Socolofsky, E. E. Adams, J. Hydraul. Eng. 131, 273 (2005). 18. J. M. Brooks, thesis, Texas A&M University, College Station, TX (1975). 19. T. C. Hazen et al., Science 330, 204 (2010); 10.1126/science.1195979. 20. P. L. Tavormina, W. Ussler 3rd, V. J. Orphan, Appl. Environ. Microbiol. 74, 3985 (2008). 21. M. A. de Angelis, M. D. Lilley, E. J. Olson, J. A. Baross, Deep Sea Res. Part I Oceanogr. Res. Pap. 40, 1169 (1993). 22. G. R. Dickens, J. R. Oneil, D. K. Rea, R. M. Owen, Paleoceanography 10, 965 (1995). 23. M. E. Katz, D. K. Pak, G. R. Dickens, K. G. Miller, Science 286, 1531 (1999). 24. D. F. McGinnis, J. Greinert, Y. Artemov, S. E. Beaubien, A. Wuest, J. Geophys. Res. 111, C09007 (2006). 25. G. Rehder, I. Leifer, P. G. Brewer, G. Friederich, E. T. Peltzer, Mar. Chem. 114, 19 (2009). 26. J.D.K. and D.L.V. contributed equally to this work. This research was supported by the NSF through grants OCE 1042650 and OCE 0849246 to J.D.K. and OCE 1042097 and OCE 0961725 to D.L.V. and by the U.S. Department of Energy (DE-NT0005667) to D.L.V. The August, September, and October expeditions were funded by NOAA through a contract with Consolidated Safety Services, Incorporated. We thank the officers and crew of the NOAA ship Pisces, as well as S. Joye, M. Heintz, C. Farwell, F. Kinnaman, K. Mouyard, T. Bryant, B. Pierce, A. Lee, R. Hansman, S. Socolofsky, L. Hu, F. Garcia Tigreros, T. Bianchi, X. Li, S. DiMarco, S. Bagby, G. Paradis, and the staff at Picarro Incorporated and Los Gatos Research Incorporated for valuable technical assistance and discussions. Sequences are available on GenBank, accession numbers HQ738556 to HQ733567, HQ433363 to HQ433432, and HQ652514 to HQ652537.
Downloaded from www.sciencemag.org on January 25, 2011
wellhead in June, when no methylotrophs were detected and members of the Oceanospirillales, Cycloclasticus, and Colwellia accounted for up to 100% of sequences (11, 19). These groups are presumably involved in hydrocarbon oxidation but have not been linked to methane oxidation. In September 2010, Cycloclasticus accounted for only 0 to 6% of sequences from each site, Colwellia for 0 to 5%, and the previously identified Oceanospirillales were not detected at all, although other members of this order accounted for 3 to 11% of sequences. This dramatic change in community composition is particularly striking considering that in September 2010 both methane concentrations (1.4 T 2.0 nM; maximum = 20.4 nM; n = 671) and methane oxidation rates (average = 0.0015 day−1; range from 0.0006 to 0.0038 day−1; n = 10) were very low, suggesting that methanotrophs were no longer active and that we only observed the remnants of that population. Because of the lack of information on microbial communities present in the deepwater column of the Gulf of Mexico before the Deepwater Horizon spill, it is difficult to determine the background abundance of methylotrophs. However, even in areas of active methane seepage such as the Eel River and Santa Monica Basins, methylotrophs are present at such low relative abundances as to be virtually undetectable in 16S rRNA clone libraries (20). We were also able to sequence the particulate methane monooxygenase gene ( pmoA) in select samples; these sequences were closely related to pmoA sequences from marine hydrocarbon seep environments (fig. S6). The unusually high relative abundances of methylotrophs observed in September, despite the fact that methylotrophs had likely decreased from their peak levels, strongly supports our hypothesis that microbial methane oxidation was responsible for the disappearance of methane. Taken together, the tracking of a hydrocarbon intrusion layer throughout the northern Gulf of Mexico, the paucity of CH4 in the affected waters a month or more after the hydrocarbon emissions had ceased, the magnitude of the DO anomaly relative to emitted hydrocarbons (Table 1), and the prevalence of a methylotrophic microbial community (Fig. 2) suggest that CH4 emitted from the Deepwater Horizon event was quantitatively consumed by August 2010. Given the slow rates of methanotrophy observed near the wellhead in June 2010 (11), we suggest that a bloom of methanotrophic bacteria occurred in these waters sometime between the end of June and the beginning of August 2010 and that it likely occurred after affected waters had flowed away from the wellhead. This assertion is supported by previous observations that rates of methanotrophy increased as C2H6 was depleted in the hydrocarbon intrusions (11). In order to better define the time-series change in CH4 oxidation rates as well as CH4 and DO loss, we created a one-dimensional timedependent mixing, transport, and reaction model. The model fitted the measured CH4 and DO
Supporting Online Material www.sciencemag.org/cgi/content/full/science.1199697/DC1 Materials and Methods Figs. S1 to S6 Table S1 References 28 October 2010; accepted 20 December 2010 Published online 6 January 2011; 10.1126/science.1199697
21 JANUARY 2011
315