August 2012 • No.
374
“After” Math: The Impact and Influence of Incentives on Benefit Policy By Nevin Adams, J.D., Employee Benefit Research Institute A T
A
G L A N C E
Whichever political party prevails in November 2012, it is likely that the next Congress will, of necessity, address issues of the federal deficit, entitlements, and tax policy—specifically, proposals to modify or reduce existing tax preferences for health and retirement benefits. In that context, EBRI’s 70th policy forum focused on the "’After’ Math: The Impact and Influence of Incentives on Benefit Policy.” The May 2012 symposium brought together a range of national experts who explored various implications of changes to benefits tax policy. Among the key points made at the policy forum: As important as retirement and health benefits are to Americans’ short- and long-term economic security, the sheer size of their tax preferences makes them vulnerable in the battles over deficit reduction and tax reform. Private-sector health benefits alone rank as the largest single “tax expenditure” in the federal budget. Retirement benefits are a tax deferral rather than an exclusion from income—meaning the federal government will eventually recoup the forgone revenue. This distinguishes retirement plan deferrals from other tax exclusions. Because the tax expenditure on 401(k)-type plans is a deferral, rather than an exclusion, reducing the tax expenditure in the current period also reduces the positive stream of revenue in the future. The biggest difference between tax-expenditure estimates and revenue estimates for scoring tax reform is that the latter incorporates taxpayer behavior; tax expenditure estimates do not. Ten percent or fewer of those ages 55–60 are making withdrawals from their IRA, compared with 80 percent of those 71 and older. On a historical basis, depending on the period measured, pre-retiree balances in defined contribution retirement plans double about every eight to nine years. Employer match levels seemed to have a bigger impact on older workers, but automatic enrollment seems much more significant in terms of getting younger employees to participate in retirement plans. Common challenges for underfunded retirement systems worldwide include the need to increase the state pension age and/or “normal” retirement age for full benefits; to promote higher labor-force participation at older ages; to encourage or require higher levels of private saving; to increase retirement coverage of employees and/or the self-employed; and to reduce savings “leakage” prior to retirement.
A monthly research report from the EBRI Education and Research Fund © 2012 Employee Benefit Research Institute
Nevin Adams is director of Education and External Relations at the Employee Benefit Research Institute (EBRI), and co-director of its Center for Research on Retirement Income (CRI). This Issue Brief was written with assistance from the Institute’s research and editorial staffs. Any views expressed in this report are those of the author and should not be ascribed to the officers, trustees, or other sponsors of EBRI, the Employee Benefit Research Institute–Education and Research Fund (EBRI-ERF), or their staffs. Neither EBRI nor EBRI-ERF lobbies or takes positions on specific policy proposals. EBRI invites comment on this research.
Copyright Information: This report is copyrighted by the EBRI. It may be used without permission but citation of the source is required.
Recommended Citation: Nevin Adams, “’After’ Math: The Impact and Influence of Incentives on Benefit Policy,” EBRI Issue Brief, no. 374 (August 2012). Report availability: This report is available on the Internet at www.ebri.org Individual presentations made at the policy forum are available on EBRI’s website at http://bit.ly/EBRIpolicyforum0512
Table of Contents Introduction .......................................................................................................................................................... 3 The Potential Impact of Changes to Current Tax Incentives for Employee Benefits ..................................................... 4 Pros and Cons ................................................................................................................................................... 5 The True Cost of Tax Deferrals ............................................................................................................................... 6 What Happens to Wages? .................................................................................................................................. 7 What Is a Tax Expenditure? ................................................................................................................................ 8 How Changes in Assumptions, Policies Matter ...................................................................................................... 9 Changes in Behaviors ....................................................................................................................................... 10 The Paradoxes of Retirement Policy .................................................................................................................. 12 Exploring IRA Withdrawal Trends ...................................................................................................................... 12 2010 vs. 2008 Comparisons .............................................................................................................................. 13 Age Differences ............................................................................................................................................... 14 What Are 401(k) Plans Delivering? ........................................................................................................................ 14 Improving Outcomes........................................................................................................................................ 15 International Comparisons—Are There Lessons to Be Learned in Pension Plan Design? ............................................. 17 Comparison “Shopping” .................................................................................................................................... 18 Integrating Retirement Income Optimization ...................................................................................................... 20 Protecting Income ........................................................................................................................................... 20 “Starting” Points .............................................................................................................................................. 20 Endnotes ............................................................................................................................................................ 22
Figures Figure 1, Sources of Estimated Total U.S. Retirement Plan Assets, 20103 .................................................................. 3 Figure 2, Top Three Income Tax Expenditures ......................................................................................................... 4 Figure 3, DC Offer and Participation Rates Increase With Earnings ............................................................................ 7 Figure 4, Upside-Down Incentives? ....................................................................................................................... 11 Figure 5, Distribution of Withdrawal Amounts From Traditional IRAs Owned by Those 55 or Older, by Age, 2010 ....... 13 Figure 6, Who Has What in Their Personal Retirement Accounts? ............................................................................ 14 Figure 7, Among Plan Participants, Deferral Rates Were the Prime Variable in Lifetime Income Success ..................... 16 Figure 8, Levers for Improving Participant Outcome ............................................................................................... 16 Figure 9, The 2011 Results, Melbourne Mercer Global Pension Index ....................................................................... 19
ebri.org Issue Brief • August 2012 • No. 374
2
“After” Math: The Impact and Influence of Incentives on Benefit Policy By Nevin Adams, J.D., Employee Benefit Research Institute
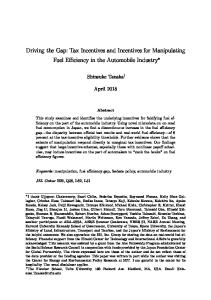
Introduction With Congress actively looking for ways to reduce government spending and budget deficits, the federal tax incentives that encourage employers to offer health and retirement benefits to their workers—and those workers to take advantage of those programs—are being seen as a major target. The reach and impact of these benefits is immense. Employment-based health benefits are the most common form of health insurance in the United States, covering almost 59 percent of all nonelderly Americans in 2010 and about 69 percent of working adults.1 Assets in employment-based defined benefit (pension) and defined contribution (401(k)-type) plans account for more than a third of all retirement assets held in the United States, and a significant percentage of assets held today in individual retirement accounts (IRAs) originated as a rollover account from an employer-sponsored program (see Figure 1).2 Workers routinely rank their employment-based health coverage as the most important benefit they receive, followed by a retirement plan.3
Figure 1 Sources of Estimated Total U.S. Retirement Plan Assets, 2010 (Total $17.8 trillion) Federal Government 8.0%
Private Defined Benefit (Pensions) 12.7%
State & Local Government 17.0%
Private Defined Contribution (including 401ks) 21.6%
Private Insured 14.1%
As important as these benefits are to Americans’ short- and long-term economic security, the sheer size of the tax preferences under federal law also makes them vulnerable to the battles over deficit reduction and federal tax reform. The current White House budget listing of “tax expenditures”—the amount of tax breaks given by law to various programs (see Figure 2)— shows that the exclusion for medical insurance and medical care is the single-largest of all tax preferences, amounting to more than $184.5 billion in FY 2012. Tax preferences for 401(k)s rank third ($67.6 billion in FY 2012).4
As policy makers debate ways to deal with the nation’s debt and fiscal situation, they are, Source: Board of Governors of the Federal Reserve System, "Flow of Funds Accounts of the unsurprisingly, turning to where the money is. Untied States: Flows and Outstandings Fourth Quarter 2011." Regardless of which political party prevails this fall, a major overhaul of the federal tax code is expected, and that is likely to include a vigorous scrutiny of all programs receiving federal tax preferences. Existing tax incentives for employment-based benefits are considered to be high on the list for cuts or even elimination, as called for in some proposals already on the table.5 IRA 26.5%
Dallas Salisbury, EBRI president and CEO, noted that Congress has shown “a long tradition of volatility” in what it considers appropriate levels of tax incentives to encourage private-sector benefits. For instance, the original annual defined benefit (pension) contribution limit of $75,000 per person, enacted by Congress in 1975, is currently $200,000; but if adjusted for inflation, it would be $319,785. By comparison, he noted that the elective deferral limit for defined contribution (401(k)-type) plans was originally $7,000, but today is $17,000; on the other hand, if adjusted for inflation, it would be $14,135.
ebri.org Issue Brief • August 2012 • No. 374
Salisbury
3
He also noted that there has been policy volatility in tax treatment of retirement incentives for highly compensated workers and other benefit issues, and that current budgetary pressures to reduce federal spending and the deficit ensure that further federal policy changes and unpredictability lie ahead. “Public policy, relative to where it was in 1975, 1985, even 1995, has consistently constrained the incentives in the tax code for the provision of either defined benefit or defined contribution retirement programs—but especially for DB pension plans,” Salisbury said. “When you look at some of the recent proposals for reform, retirement tax incentives are an area of total and complete volatility, and neither employers nor workers can have any certainty of what lies ahead.” To examine the implications for private-sector health and retirement benefits, as well the costs and consequences and what the numbers are, EBRI held a day-long policy forum in Washington, DC. Titled “’After’ Math: The Impact and Influence of Incentives on Benefit Policy,” this was EBRI’s 70th biannual forum on benefits issues. It drew about 100 experts, benefits professionals, and policy makers to provide their perspectives and predictions. This Issue Brief summarizes the materials presented at the policy forum. Speaker presentations, a webcast recording of the event, and other information are online at EBRI’s website at http://bit.ly/EBRIpolicyforum0512
The Potential Impact of Changes to Current Tax Incentives for Employee Benefits Amidst Beltway talk of re-examining tax preferences for employee benefits, Paul Fronstin, head of EBRI’s Health Research and Education Program, noted there have been numerous previous attempts to do so, including a 2005 presidential advisory panel that suggested limiting the tax exclusion for health insurance to $5,000 for individuals and $11,500 for families. Just this year, the Republican Study Committee suggested that government payments to the Federal Employees Health Plan be reduced to a fixeddollar amount per worker, and the c Heritage Foundation recently proposed replacing the current tax treatment with a uniform, nonrefundable tax credit that individuals could use either to get coverage through the work place or directly from an insurer. Perhaps the most discussed among these proposals is the so-called “Simpson-Bowles” Fronstin proposal, more formally known as the National Commission on Fiscal Responsibility and Reform, which would first freeze, and then gradually eliminate the existing tax exclusion for employment-based health benefits by 2038. Fronstin noted that “one of the reasons, perhaps the primary reason” for targeting this tax preferences is because “health benefits are by far the number-one tax expenditure in the federal budget,” amounting to $184 billion in 2012, compared with the $99 billion attributed to the home mortgage interest deduction and the $68 billion associated with the tax preference for 401(k) plans (see Fig. 2). Fronstin explained that an argument against the current tax preferences for employment-based health coverage is that workers seem to prefer health coverage that has low cost sharing because health ebri.org Issue Brief • August 2012 • No. 374
4
premiums are excluded from taxable income but out-of-pocket expenses generally aren’t (except for flexible spending accounts and health savings accounts, which are still used by relatively few people). “The argument is that this leads to overuse of healthcare services, which drives up premiums and makes insurance unaffordable, especially among the low income,” he said. On the other hand, he noted that the theory of taxing (or limiting the tax exclusion) of health benefits is that it will lead to less comprehensive benefits, higher cost-sharing, and, ultimately, lower use. However, that last point is debatable, he added, because the 20 percent of the population that is seriously ill tends to represent 80 percent of healthcare costs, which makes it seem unlikely they would voluntarily reduce their use of care. Fronstin noted that, at least in theory, employers should be indifferent to the choice between providing workers with cash wages or health benefits since both are tax deductible as business expenses—although because employers do not pay FICA taxes (Social Security and Medicare) on the health benefits they provide as they would on cash wages, there might be some slight preference. Under the Patient Protection and Affordable Care Act (PPACA), a new excise tax on high-cost (the so-called “Cadillac”) health plans takes effect in 2018—and he noted that change in tax treatment might influence employer preferences. Fronstin noted that workers’ contributions to salary reduction arrangements—specifically 401(k)s—generally reduce their taxable income, as do contributions to flexible spending accounts, while with health savings accounts (HSAs), interest, earnings, and distributions for qualified medical expenses are all tax free. “It’s the only triple-tax-free account out there, which makes it attractive from a tax planning perspective,” he explained. However, PPACA reduced the limit on amounts that workers can put in flex accounts, and the existing 401(k) contribution limits have been identified as a target for reduction in federal debt debates. Other individual accounts— such as IRAs and HSAs—also could have their current tax advantages reduced as part of congressional deficit-control actions.
Pros and Cons Following Fronstin’s presentation, Joe Antos, Wilson Taylor Scholar in Healthcare and Retirement Policy at the American Enterprise Institute, and Gretchen Young, senior vice president for the ERISA Industry Committee (ERIC), offered a point-counterpoint argument for and against the existing tax exclusion for health benefits. Antos criticized the current employment-based tax exclusion as “misleading, inequitable, and inefficient”—misleading because people don’t understand how they’re paid (the employer Antos (left) and Young (right) “contribution” is actually another form of earnings, he explained); inequitable because middle-income and higher-paid workers are more likely to be offered the benefit than lower-income workers; and inefficient because, among other things, only large employers tend to offer a choice of health plans. “The agents in the system—your doctor, your employer, your insurance plan—they're not communicating with each other. And as a result, you—the person who ultimately cares about this—do not benefit from the potential agency relationships that ought to exist, but effectively do not. That's a real problem,” Antos said. Antos also noted that costs are driven up in many urban markets where major health providers (usually hospitals or hospital systems) have the upper hand in bargaining, and that the existing health insurance system is able to simply pass along costs to employers and consumers.
ebri.org Issue Brief • August 2012 • No. 374
5
Antos expressed support for the principal of health exchanges as organized insurance markets, even though he quickly added that he “completely disagrees” with the highly regulatory way they are being implemented under PPACA. He also expressed skepticism that the federal tax exclusion for health benefits would be significantly reformed simply because the political forces in favor of the status quo may be too strong to overcome. Young of ERIC reviewed the reasons why employers voluntarily provide health benefits to their workers: to recruit and retain skilled employees, and to keep them healthy and productive. By maintaining the tax exclusion for health benefits, employers are able to manage and structure their benefit plans in the way that best fits their corporate and employee needs, she said. She also listed the various benefits of the employment-based benefits system: Larger employers have the advantage of a larger and more attractive risk pool that allows them to both negotiate lower premiums and drive innovation in the healthcare market, such as wellness, prevention, and anti-smoking programs. They also serve an important role negotiating in the health insurance market and acting as intermediaries and advocates for their employees with health insurance companies, she said. Young rebutted what she said are the two main arguments for ending the employment-based tax exclusion for health benefits: lowering the cost of health care (which she said would not work) and raising revenue for the government. She also said the issue of inequity in health coverage—while a legitimate issue—would not be solved by dismantling the employment-based health system. Young also maintained there is no hard evidence to support the claim that workers buy more healthcare than they need because employment-based health coverage makes it so inexpensive. “I think that's a troublesome argument. I think people buy less risk because they don't want to be saddled with healthcare later,” she said. Young added that “there are a lot of reasons why insurance is more costly”—such as geographic, age, and health differences among workers—unrelated to over-consumption of healthcare. Getting rid of employment-based health benefits by eliminating the tax exclusion could also have a number of unintended negative consequences, she suggested, such as an end to the related disability benefits that employers typically provide their workers, and the availability of on-site medical clinics, wellness programs, and employee assistance programs. She said that taxing health benefits would have a disparate impact on young, healthy workers and older, sicker workers. The value to young workers would be far less than to older workers, but both would be subject to the same tax. Making a fair allocation would be extremely complex. “Let's really look at the impact on employer-sponsored healthcare before we do anything,” Young said. “Don't dismantle the system now until you know what you're doing.”
The True Cost of Tax Deferrals The “cost” to the federal Treasury of deferring taxes on retirement benefits is a topic of growing debate both inside and outside the Beltway. A panel at the recent EBRI policy forum examined the cost of such policies and how such costs are “scored” (for budgetary purposes). It also examined the cost and value of the benefits provided to employers and workers, and what changes to the current approaches might mean. Karen Smith, senior research associate at Urban Institute, noted that 401(k) plans are now the predominant saving vehicle for most Americans—plans that provide the ability for workers to defer income from taxes on contributions and investment returns on those contributions. She noted that participants receive the benefit of deferring taxes while they are working, and the effective deferral of paying taxes at lower rates when they withdraw those funds at retirement.
ebri.org Issue Brief • August 2012 • No. 374
Smith
6
Smith also explained that higher-income workers are more likely to be offered plans, are more likely to participate in such plans, and tend to receive larger tax benefits from the plans (Figure 3). “You'd expect to have lower wages for workers who have pensions and health insurance,” she noted. “In fact, many studies have found just the opposite—that, in fact, the coefficient for those with pensions and health insurance are positive. So workers offered health insurance and offered pensions actually have higher wages” than those who are not offered plans, she said. Smith noted that DC plans have higher contribution limits compared with IRAs; DC plans encourage longer tenure, and therefore serve to develop more human capital within companies; and they also attract people with a higher taste for savings, who might be better-quality workers. She noted that Congress, recognizing the fact that these plans would benefit high-income workers, imposed nondiscrimination rules that require broad-based participation across the firm and ensure, as a matter of public policy, that benefits are provided to lower-income workers as well. “Most economists assume that for every dollar that an employer contributes to a DC plan, employers will reduce the wages by a dollar,” she explained, “and so most analyses that look at the distributional impact of these tax expenditures come to the conclusion that they really benefit high-income workers.” She went on to cite a recent study of tax expenditures that found that higher-income workers were more likely to benefit than lower-income workers. However, she said that lower-income workers aren’t always willing to make a dollar-for-dollar trade of wages for benefits, that low-income workers aren't willing to give up wages in order to have tax savings—because they’d rather have the cash wages to meet current expenses.
What Happens to Wages? Smith then explained the methodology of a study that she and Eric Toder, co-director of the Urban-Brookings Tax Policy Center, had conducted to estimate employee earnings as a function of worker characteristics and job characteristics. She said that they separated the population into high income and low income, defining the latter as workers with family income in the bottom 40 percent of the income distribution ($60,000 in today's dollars). High income was defined as those in the top 40 percent of the distribution (about $88,000 in today's dollars), and the study used separate regressions for males and females, because men and women have very different earnings profiles, according to Smith. (The Smith-Toder study is available online at www.urban.org/UploadedPDF/1001578--Do-LowIncome-Workers-Benefit-from-401k-Plans-brief.pdf). She explained that they were looking for the absolute-dollar reduction in wages associated with access to pensions, and the dollar reduction in wages associated with an additional dollar of employer contributions to DC plans, using the 2004 ebri.org Issue Brief • August 2012 • No. 374
7
and 2008 pooled Survey of Income and Program Participation data matched with Social Security administrative earnings data. The data include historic earnings and worker DC contributions, and factors such as age, race, sex, marital status, and pension characteristics. She noted that the study found that earnings are higher for married workers relative to unmarried workers. They are also higher for those with better health, and with longer job tenure, she said. Smith also noted that earnings are higher for union workers and for women who don't have small children. Smith said that when they examined workers with both health insurance coverage and DC retirement-plan coverage, they also found evidence of higher wages. This suggests some kind of market segmentation where some employers offer both higher wages and higher benefits, and other employers don't, she said. Looking only at employers that offer DC plans, they then looked to answer the question, “What happens when the employer increases the employer contribution?” Here they found, as expected, a reduction in wages associated with additional employer DC contributions, but with big differences between high-income and low-income workers. According to the findings, for high-income men, an additional dollar of DC contribution from the employer reduces wages by 90 cents, but for low-income men it reduces wages by only 29 cents. For women, the differences were even larger: An additional employer contribution of a dollar reduces their compensation by 99 cents—virtually a dollar-fordollar shift—but only 11 cents for low-income women. Smith said those results led them to conclude that while low-income workers may not value retirement savings the same way high-income workers do, they really do benefit from the tax benefit for 401(k) plans because they are getting both higher wages and higher total compensation.
What is a Tax Expenditure? Judy Xanthopoulos, principal at Quantria Strategies, LLC, said that while legislators are engaged in tax reform discussions on Capitol Hill, “it is important to understand the tax expenditure concept—what it is and what it isn't.” Many use tax-expenditure estimates to initiate the tax-reform discussion and to raise revenues. The corresponding revenue estimates often differ from the tax-expenditure estimates. This is particularly true for defined-contribution-plan tax expenditures, she said. Citing a paper, co-written with Mary Schmitt that examined tax expenditures for defined contribution plans, she noted that pensions are a tax deferral, not an exclusion from income. This is an important point when comparing cash-flow tax expenditures, because it distinguishes pension deferrals from other tax exclusions, she explained.
Xanthopoulos
She said the paper explains the tax expenditure concept and the way that current cash-flow measures overstate the true cost of retirement savings. She noted that the biggest difference between tax expenditure estimates and a revenue estimate for scoring tax reform is that the latter incorporates taxpayer behavior, while tax expenditure estimates do not. (The Xanthopoulos-Schmitt study is available online at http://papers.ssrn.com/sol3/papers.cfm?abstract_id=1905721). According to Xanthopoulos, congressional budget and Treasury Department staffs are required to use cash-flow numbers for determining tax expenditures. The cash-flow method compares current deferrals as well as the current earnings on those deferrals, offset by the withdrawals, “so cash-flow analysis offers a static estimate that truly overstates the costs of current pension contributions,” she said. She noted that the Treasury Department prepares alternate estimates for selected tax provisions using present-value analysis. Applying present-value analysis to defined contribution and other pension provisions provides a more accurate measure of the cost. She cautioned that there are many assumptions that affect the analysis, and that present-value
ebri.org Issue Brief • August 2012 • No. 374
8
measures are very sensitive to assumptions such as tax rates at the time of contribution and withdrawal, discount rates used in the present-value analysis, the rate of return on earnings, and the demographics of those contributing. “Having been involved in budget scoring for a long time, I believe no single correct present-value estimate exists,” Xanthopoulos cautioned. She noted that unlike exclusions from income, “pension contributions will be subject to tax at a later date, and we have to be careful to not to use an imperfect tool—like a tax expenditure measure—as a means to making policy decisions.” Xanthopoulos predicted that making fundamental changes to the existing tax treatment of retirement plans would cause a dramatic negative response: “If you were to eliminate the tax treatment for qualified retirement plans, they would cease to exist in their current form. There would be a significant behavioral response by current participants if policymakers eliminate the income deferral,” she said.
How Changes in Assumptions, Policies Matter Ithai Lurie, financial economist at the Treasury Department, next discussed his recent work with Shanthi Ramnath6 (also a financial economist at Treasury), which looked at the longterm changes in tax expenditures, specifically for 401(k) plans, and how changes in policy and assumptions matter. The discussion represented their views and not the views of the Treasury Department, he explained. He noted that the tax deferral for 401(k) accounts is different from things such as the tax exclusion for health premiums, because, at some point in the future, taxes will be assessed on the 401(k) deferral and revenue collected; the tax exclusion for health premiums means no revenue is ever collected for that benefit. Measuring the tax expenditure on retirement Lurie plans (specifically 401(k)s) is difficult, because of the need to consider the value of the deferral in the year it was made, how much earnings may accumulate over time, the amount and timing of the eventual distributions, and the treatment of rollovers, he said. Lurie explained that one of the reasons that the estimated revenue impact of tax deferral seems so large on a cash flow basis is that the cohorts are different: Those deferring the contributions are different than those receiving the distributions from those programs. “That's a big issue for estimating a tax expenditure for the 401(k)s,” he noted, because there are more people contributing than taking distributions at present due to the shift from defined benefit to defined contribution plans. As a result, Lurie said that the paper looked at different time horizons, considering the cost of the contribution, and what the costs of the deferral are over different time horizons, as well as the overall cost throughout the period. “We want to think about different assumptions about rate of return, the discount grades, and the tax rates, how those affect our measure of tax expenditure,” he said. To do so, Lurie said they started with tax data linked to W-2s from 2008, which provided information about the employee contributions to 401(k)-type plans. The employer contribution rate was imputed based on the employee contribution, age, gender and income (from the Survey of Income and Program Participation, or SIPP, since the tax data did not contain employer contributions). Based on that information, Lurie said, it was apparent that income matters, while age does not matter much (although participation was somewhat higher as people get older). Lurie said they assumed people retire at age 65, their balances were distributed uniformly done over 10 years as an annuity, that the tax rate is fixed at 2008 levels, and that the money was invested in a type of bond, such that the individual gets a constant return over time, and that the discount rates are constant over time. Working with those assumptions, he said that, in the year of the contribution, the total contribution times the marginal tax rates is the taxpayer’s obligation—the deferral cost to the federal government. “The total loss of the deferral is basically what you have in your account, which is what you put in, times your return over the time that the account existed, times the tax rate. That's a total deferral times your marginal tax rate, and the revenues collected are basically the distributions times your marginal tax rates,” he explained.
ebri.org Issue Brief • August 2012 • No. 374
9
Looking at the net present value over several different time horizons, he noted that the net present value of a 4 percent rate of return with 4 percent discount rates produces a situation where there's about $85 billion in cost in the first year. Looking over the five-year tax expenditure budget window, the cost of the earnings deferrals is $13 billion in net present value. With a 10-year window, the cost increases because there are more people in the system who are under 65 than over 65. “But,” he noted, “if you look at the full window of people who started at age 23 in our sample and go to age 65, and then distribute for 10 years, you see that the total value of the deferral is actually positive. So the federal government gets money back—and this was a 4 percent rate of return.” When looking at different rates of return, Lurie said that as discount rates increase, the net present value cost generally increases. Lurie then outlined a simple policy analysis based on this approach, assuming the imposition of a combined cap of $10,000 on both employer and employee 401(k) contributions. Most of the “losers” in this policy scenario would be those with more than $150,000 in income, a group he said that would lose about $3,200 in tax value. While the federal government comes out better in this scenario, in that they are taking in more tax revenue, Lurie added that “there's not a lot of money there” in the aggregate—whatever the tax rates, the rates of return, or the discount rates. In a very low interest-rate world, he said the contribution cap would generate between $5 billion–$10 billion in return to the government in net present value, or as much as $30 billion under 8 percent returns. Lurie explained that because the tax expenditure on 401(k)-type plans is a deferral, rather than an exclusion, reducing the tax expenditure in the current period also reduces the positive stream of revenue in the future—a revenue loss that, because it occurs outside the budget horizon, can be overlooked but should not be. “Over time, there are budget considerations outside the window that may matter a lot,” he said. He also cautioned that reducing retirement savings today could have adverse effects on other portions of the budget, such as lower income for retirees and increased dependency on (and cost to) Medicaid. Ultimately, he said, lowering the contribution limits for 401(k) retirement accounts by capping the contributions would primarily affect high-wage earners, but would put a very small dent in the budget deficit. And, he added, the result of a very small dent in the deficit over the very long run assumes no behavioral changes that may affect outcomes.
Changes in Behaviors While much of the discussion around changing tax incentives seems to assume no change in current behaviors, EBRI Research Director Jack VanDerhei outlined research that examined not only how employers and workers would likely respond to certain changes, but also how those responses might impact retirement savings. He noted that the 2012 Retirement Confidence Survey (RCS), fielded in January, contained specific questions with respect to a proposal to modify the current favorable federal tax treatment of 401(k) plan contributions in exchange for a flat-rate government match. Additionally, he noted that questions dealing with the same proposal were incorporated in an employer survey of 401(k) plan sponsors fielded by AllianceBernstein, providing insights as to how a group of nearly 1,000 sponsors of varying sizes would respond to the proposed changes.
VanDerhei
VanDerhei noted that different-size employers have different types of objectives in offering these plans. He acknowledged that, under the current federal tax treatment for 401(k) plans, there are obvious advantages for workers with a higher marginal tax rate. He noted that some critics accuse 401(k)s of offering “upside-down” incentives but said that disregards the impact of other key provisions of the tax code on these programs (notably the 402(g) deferral limits, the 415(c) total-contribution limits, the average deferral percentage (ADP) nondiscrimination requirements and actual participant behavior).
ebri.org Issue Brief • August 2012 • No. 374
10
VanDerhei explained that if those “upside-down incentives” were the only forces at work, it would be expected that the higher the salary, the higher the overall account balance as a multiple of salary. However, drawing on the massive EBRI/ICI 401(k) database, and specifically focusing on workers in their 60s broken down by tenure and salary, he noted that “…what we find are relatively flat lines” (Figure 4).
He went on to say that “we've been doing this every year since 1996. We just don't see the kind of empirical verification one might expect if the ‘upside-down’ incentives were really the driver behind what was going on in the current system.” VanDerhei cited a recent Investment Company Institute survey that indicated that 45 percent of defined contributionowning households state that they probably would not be saving for retirement at all if it weren't for their DC retirement plans. He also noted results from the 2011 RCS, which asked 401(k) participants about the importance of being able to deduct or exclude their retirement savings plan contributions from taxable income. “Those with the lowest income definitely had the highest percentage saying that the current tax provision was very important,” VanDerhei said. The RCS also found a high percentage of lower-income workers saying they would reduce their retirement savings if the current tax deferral was eliminated. “Financial economics would tell you exactly the opposite, but because of behavioral considerations, and binding constraints, at least some individuals are probably already putting in just as much as they possibly can,” VanDerhei said. “If that saving shifts from a before-tax basis to after-tax, there's going to be less dollars saved.” Taking those employee and employer responses, VanDerhei showed the results of running those through the EBRI Retirement Security Projection Model,® or RSPM, noting that “when we went back and broke out the simulation results by plan size, the results were truly phenomenal.” Looking at the two smallest plan sizes (those with less than $10 million in assets) produces either a 36 percent or a 40 percent average reduction in projected 401(k) balances if the current favorable federal tax treatment of 401(k) plan contributions were modified in exchange for a flat-rate government match.
ebri.org Issue Brief • August 2012 • No. 374
11
The Paradoxes of Retirement Policy
Barry
Mike Barry, president of Plan Advisory Services Group, noted that the current tax system provides incentives to highly paid people to save, but also has a nondiscrimination rule that, in effect, sees to it that retirement benefits generally also accrue to lower-income workers who participate in the plan. He noted what he described as a paradox: The less workers value the benefits being provided (because they are lowincome), the larger the value of those benefits from the standpoint of policymakers. “We are basically fighting the normal inclinations of human beings [not to save for retirement],” he noted. “They have different preferences than we think are correct, and we're pushing against those preferences with the system that we have.” Doing so has a cost—not just the tax expenditure but the undervaluation of benefits (vs. cash) by lowerpaid employees.
That raises the question of whether the United States should have a national retirement policy that encourages retirement savings, he said. He offered three reasons why it should: First, he noted that an income tax system has a bias in favor of consumption, and thus it is necessary to mitigate the tax on savings. “The retirement savings tax incentives that we have are one such mitigation of the tax on savings,” he said. Second is what behavioral economists refer to as “hyperbolic discounting,” future spending that is “less valuable” than current consumption. “People like to spend and they don't like to save—and since retirement is pretty much the last thing you do in life, people really don't like to save for retirement.” To counteract this universal trait, all modern economies have developed systems of "forced" savings (in the United States, Social Security) and have policies to encourage saving, he said. Third is a general belief that we should have some sort of safety net, including a retirement safety net. Barry said it is unrealistic to expect employers to pay workers more than their value to the firm to finance their retirement costs, just as it is unrealistic to expect low-income workers to save enough to pay their own retirement, especially those who “can barely make the rent, barely feed their kids.” He said that both the undervaluation of retirement benefits by low-paid employees and the $5 billion a year the federal government collects in early withdrawal penalty taxes indicates that the current system undervalues low-paid employees’ need and preference for cash. Rather than using the tax system to try to increase low-income savings among people who have far more immediate needs, Barry suggested a more efficient policy would do so explicitly through Social Security. “If those people need more money, let's just give it to them,” he said. “I think we're pushing too hard against that, and I think we're spending too much tax dollars to push against that.” And he added that arguments between left and right over fairness might be more simply reconciled—rather than through the current nondiscrimination system—through a system of deductions and tax credits.
Exploring IRA Withdrawal Trends What do individuals actually do with their retirement savings after retirement? Craig Copeland, senior research associate at EBRI, presented data that help answer that question. Copeland noted that over the years EBRI has conducted a great deal of research on the accumulation phase of retirement savings, both with 401(k)s and individual retirement accounts (IRAs). He noted that EBRI’s Center for Research on Retirement Income is currently working on an integration of defined contribution balances and IRAs, but that new analysis of IRA withdrawal trends during the so-called “spend-down” phase offers valuable insights on these trends.
ebri.org Issue Brief • August 2012 • No. 374
Copeland
12
The results come from 2010 data in the EBRI IRA Database,TM which had 14.85 million accounts, held by 11.1 million individuals, with $1 trillion in assets—roughly one-fifth of both owners and assets in the IRA universe, according to Copeland. Results from that database7 show that 32 percent of those age 55 and older with a traditional IRA are withdrawing from those accounts. Interestingly, he noted, there isn’t a large percentage of people withdrawing from their IRAs until reaching the group age 71 and older—the point at which required minimum distributions are triggered. How much are they withdrawing from these accounts? Looking at the entire span of distributions, Copeland noted that the middle-range withdrawal is $5,000 in one year from IRAs. Younger IRA owners show a slightly higher overall distribution amount than the oldest owners, he said, “so it looks like those people are doing something else rather than spending it down for retirement” (Figure 5).
Median withdrawal rates amounted to 5.5 percent of the account balance in 2010, which Copeland said was in a range that is somewhat sustainable for a number of years—not too far above 3–5 percent withdrawal rate that many financial professionals recommend as a sustainable post-retirement withdrawal rate. However, Copeland noted that the younger people in the group were much more likely to have a much larger distribution, whereas those 71 or older were much more likely to be withdrawing at a rate of 3–5 percent.
2010 vs. 2008 Comparisons Comparing withdrawal activity in the same group of people between 2010 and 2008, Copeland noted that 32 percent of IRA owners in the EBRI database withdrew from their IRAs in 2008, vs. 38.4 percent in 2010. By type of IRA, Copeland noted that virtually all the withdrawal activity is coming from a traditional IRA, rather than a Roth—not surprising, given the differing tax rules on withdrawals between those two types of accounts, he observed. By age, Copeland noted that 10 percent or fewer of those ages 55–60 are making withdrawals, compared with 80 percent of those 71 and older. Virtually all of those who withdrew from a traditional IRA in 2008 did so again in 2010. Regardless of age, Copeland said, once individuals started withdrawing from these accounts it was very likely they
ebri.org Issue Brief • August 2012 • No. 374
13
would to do so the next year. Even looking at the relatively low percentage of 55–60-year-olds who withdrew from their accounts in 2008, 75 percent of them also withdrew from their accounts in 2010. Copeland noted that the withdrawal amounts were relatively small in 2008 and 2010, mostly $5,000 or less, although he noted a slightly higher likelihood for a larger distribution in 2010 among those who withdrew funds then, and in 2008.
Age Differences Copeland did note a definite difference among age groups. For instance, for those ages 60–70 who made a withdrawal in both 2008 and 2010, significantly more took larger distributions (above $15,000) than the overall average. However, for those ages 60–70 who withdrew in 2008 and 2010, there was virtually no difference in the amount withdrawn: For each of those years in this age group, “those distributions match almost exactly the dollar amounts,” he said. Copeland noted that the median withdrawal rate was almost 10 percent in 2008 among those 55–59, but for 71 and older (a group that is likely to be in the spend-down phase), the median withdrawal rate was actually lower: 7.2 percent. For 2010, the median withdrawal percentage for those 71 and older was just 5.2 percent, and the withdrawal rates were very similar across each of the age groups. “For those 71 and older, they're very consistent in their withdrawal percentage, being mostly within 5 percentage points from where they were the year before,” Copeland said.
What Are 401(k) Plans Delivering? Steve Utkus, director of Vanguard’s Center for Retirement Research, launched the session with a macro view of where 401(k) plans are today, looking at data from a recent study published by Jim Poterba, David Wise, and Steve Venti using data from the Health and Retirement Survey. Utkus began with the caveat that given the ongoing evolution of taxdeferred retirement accounts, the data represents a view of the system “probably at its midpoint,” as many of the 80 million participants with accounts were unlikely to have spent an entire working career in the 401(k) system. He began by reporting on personal retirement accounts among households ages 65‒69, either retired or on the verge of retirement, and separately showed data for married vs. Utkus single-person households. Utkus noted that about 65 percent of married households in this age range had an account, and the remainder had no personal retirement accounts. They either never had an account or had spent the account by their late 60s. The median value of these accounts was $35,000 including those with no savings, although Utkus noted that if only those households that had with an account with a balance were considered, the median value was $122,000 (Figure 6). Figure 6
ebri.org Issue Brief • August 2012 • No. 374
14
Looking at single-person households—which include individuals who were either never married, divorced or widowed— Utkus cited a dramatic difference: “Single-person households have negligible amounts in tax-deferred retirement accounts. Only about a third of single-person households had an account, and so the median value among all singleperson households is zero. Among those with an account, the median value was $64,000, about half that of what married couples with accounts had. What this suggests is that single-person households are either less likely to be covered by plans or less likely to contribute to them when offered.” Adding in all other taxable financial assets (such as bank, brokerage, mutual fund accounts, insurance policies, etc.), married couples in the 65–69 age demographic had median savings of $111,000, although among the top 40 percent (the 60th percentile), the median savings value was around $200,000. However, looking at single individuals, Utkus noted that the median financial holdings of all single people in the 65–69 age group was $12,500—a “really dramatic difference between single-person households and married couples,” he noted. Utkus noted that, “when you examine this data, it obviously raises the issue of coverage—who has a retirement account and who doesn't.” He said that while coverage rates can be expected to grow, the rates aren’t likely to exceed 60 percent or so of households. A very important question for future research is the stark difference between married and single-person households. How will tax-deferred accounts evolve in the future? Utkus noted that, on a historical basis, depending on the period measured, pre-retiree balances double about every eight to nine years. “Defined contribution assets will continue to grow in a dramatic way over time because of ongoing contributions and compound earnings,” he noted, providing a growing pool of assets for future retirees.
Improving Outcomes Laurie Nordquist, director of Institutional Retirement & Trust at Wells Fargo, focused on what retirement plan sponsors can do to get their workers to participate in a retirement plan and save more. “We all know that if we can get people in the plan, get them contributing at an appropriate rate and make sure they're diversified, they're going to have a better chance of really garnering the income they need in retirement,” she said. “From a plan-design standpoint, automatic enrollment and managed investment accounts can really impact the plan, but they impact different groups differently.” She noted that employer match levels seemed to have a bigger impact on older workers, but automatic enrollment was “much more significant in terms of younger employees,” particularly since most plan sponsors continue to adopt automatic plan designs on a prospective basis for new hires. But she cautioned that, even with automatic enrollment, “so many participants stay wherever we put them” in terms of the initial deferral rate.
Nordquist
Nordquist said that plan sponsor committees tend to spend most of their time looking at the plan’s investment options and (more recently) fees, but not nearly as much time on things such as benchmarking plan design features. However, she noted that while younger workers don’t participate in the same numbers, or at the same rate, as older workers, the impact of automatic plan designs are already having some positive effects, such as with asset diversification. Turning to the impact of automatic-contribution-increase designs, Nordquist cited an example where, with no autoincrease, the average contribution rate among participants is 5.9 percent, a rate that increases to 6.9 percent when an automatic-contribution-increase design feature was added. Depending on the 401(k) plan, somewhere between a quarter and 35 percent of participants were saving at a 10 percent deferral rate. “The plan levers are really important,” she said. “I'm a firm believer that the plan design can make a bigger difference than trying to change participants' attitudes and behaviors, one by one. If we can carry this forward and get more plan sponsors to turn on more of the levers, I think it will really make a difference.”
ebri.org Issue Brief • August 2012 • No. 374
15
Ed Murphy, managing director and head of Defined Contribution, Putnam Investments, cited a recent study the firm had conducted with Brightworks, an independent consulting firm. The survey of some 3,300 participants indicated that access to a retirement savings plan and actively participating in that plan made a significant difference, with participating individuals looking to replace about 87 percent of their preretirement income, on average (including Social Security). That compared with a 65 percent replacement rate for those who were eligible but not contributing, and 46 percent for those who did not have access to a retirement savings plan. Murphy noted that those contributing at 10 percent of pay and higher were on track to replace 124 percent of preretirement income levels, while those in the 4–10 percent deferral range could anticipate replacing 84 percent (Figure 7). He also noted that the median income of the best- and least-prepared quartiles were the same ($93,000), pointing out that “savings isn’t really dependent upon income. It’s about behavior.” Figure 7
Murphy
The study also found what Murphy termed a “strong correlation” with savings rates when a paid financial adviser was involved—a 20 point increase in savings for those using an advisor. Murphy said that a key takeaway from the study was that plan design is critically important. “It really is about setting those initial automatic savings thresholds higher than 3 percent,” he said. “It's about autoescalation, and it's about encouraging people to save and in making it simple and easy for people to save.”
Figure 8
Asked about thoughts or research on the most effective structure of the match in a 401(k) plan, Nordquist noted that much of what drives participant behaviors depends on whether the workforce is stable or has high turnover. She said that, typically, if the employer match is at least 25 cents on the dollar, it's more likely to drive savings behavior than a match at lower levels. She also noted that a number of the plan design changes don’t have to cost the plan sponsor anything (Figure 8).
ebri.org Issue Brief • August 2012 • No. 374
16
International Comparisons—Are There Lessons to Be Learned in Pension Plan Design? These days it seems as though every nation on the planet, including the United States, is struggling with the challenges of getting its citizens financially ready for, and then helping them live through, retirement. What lessons can be drawn from the experience of other nations? Dan DeKeizer, vice president and senior actuary at MetLife Global Employee Benefits, noted a series of threats to the notion of an adequate and comfortable retirement: demographics; economic growth trends; inflation at the public/corporate level; inadequate savings levels and annuitization rates; and, on the cost side, inflation and health care. A growing percentage of the population of other countries is living beyond the traditional U.S. retirement age of 65 and he cited the example of Japan—where, over the next few decades, more than a third of the population will be comprised of that demographic. DeKeizer also pointed out the rapidity of the aging trend in classically emerging-market economies such as Mexico, Turkey, and Brazil. He noted that it took France about a century to move from 7 percent of their population being over age 65 to double that percentage; however, Brazil will undergo that kind of shift in less than 20 years.
DeKeizer
“The speed with which those emerging economies are aging is quite dramatic,” DeKeizer explained, “and that forces them to make policy choices without the luxury of time.” He noted that societies that are able to phase in changes over time can do so in ways that are more “politically palatable”—a luxury that may not be available to countries like Mexico, Brazil, or China. “They have to find ways to make hard political choices that take effect quite rapidly,” he said. “You're shifting real income up the generations, and if you're trying to do that in a country where your real GDP, your national real income is shrinking, you have a serious political problem, because now you're not just sharing part of the gains, part of the growth. You're actually reducing lifestyle opportunities for the working population in exchange for maintaining or improving lifestyle opportunities for the nonworking population.” He noted that there are really only four areas that policymakers can affect: Have people work longer (by changing the default retirement age, such as in the United Kingdom or France). Push people to save more (increase the contribution rate in the system, such as in Germany and Australia, where both are set to do that; or implement automatic enrollment/escalation, as they now have in the U.K.; or provide tax preferences for saving, such as recent changes in Turkey do). Encourage people to spend less in retirement (perhaps through some kind of consumption tax, or tailored inflation indexing, or even just via lowered lifestyle expectations). Use economic assets in a manner thought to be more efficient (via mandatory annuitization, such as Chile’s example; via some kind of pooling system; or even a renationalization of assets, such as was recently done in Hungary). “Countries around the world have made policy choices in these categories in attempting to resolve their situation of an aging population and insufficient economic growth to support the promises they would like to make, the lifestyle they would like to offer to their pensioners or retirees,” DeKeiser said. DeKeiser highlighted three themes that appear to underpin recent proposals from international policymakers: First, any proposal that requires significant and sustained real rates of return is risky and is not likely to survive political and economic volatility.
ebri.org Issue Brief • August 2012 • No. 374
17
Secondly, among the voting population, there is a strong anchoring effect—a date that people have in mind as the “right” retirement date, which is hard to change. (Witness the new government in France, which reduced the retirement age for certain workers as one of its first acts in office, reversing the recent act of the previous government that had imposed modest increases in the retirement ages.) Because of this strong anchoring effect, DeKeiser noted that plans that introduce auto-escalation, either in the level of retirement plan contributions or in the ages at which individuals are eligible to take benefits, are more effective than “cliffs” (or abrupt changes) in the amounts or the dates. Finally, voluntary systems are not very effective at delivering adequate retirement incomes for low- and midwage workers, so the trend has been to move to mandatory (or at least auto-enrollment) types of systems.
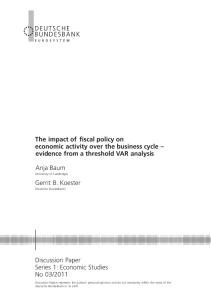
Comparison “Shopping” Robyn Cameron, senior partner at Mercer and global leader of their International Consulting Group, noted that with the variety of retirement systems in place around the world, and mix of private and public systems, it has been widely acknowledged that it is difficult to categorize pension systems and make direct comparisons between countries. She referenced research that was started in 2009 as a partnership between Mercer and the nonprofit Australian Centre for Financial Studies aimed at doing this. Cameron noted that the “Melbourne Mercer Global Pension Index” evolved from this research and measures a number of different factors (more than 40 indicators) that the index normalizes around the world in order to make comparisons between countries.
Cameron
First of all, Cameron set the groundwork for the discussion by noting that the overall framework used for the research was based on the World Bank’s five “pillars” of retirement
provision, consisting of: Pillar 0: A basic public pension that provides a minimal level of protection. Pillar 1: A public, mandatory, and contributory system linked to earnings. Pillar 2: A private, mandatory and fully funded system. Pillar 3: A voluntary and fully funded system. Pillar 4: Financial and non-financial support to the elderly outside pensions. She noted that in 2011, the Melbourne Mercer Global Pension Index included 16 countries, which cover half of the world’s population, and that the index was drawn from the perspective of three fundamental questions: 1.
Adequacy (the actual benefits that a retiree receives from the system).
2.
Sustainability (how reliable is the system, are retirees able to depend on the system to keep delivering?).
3.
Integrity (when individuals retire, is the money going to be there?).
A sub-index was created for each of these three categories. Under adequacy, the factors considered include the minimum/base pension; the net replacement rate for median-income earners; benefit-design issues in the system (such as taxation, vesting, portability, access age, and income streams); household savings rate/home ownership; and level of growth assets. Under sustainability, the factors considered are coverage of private pension plans; level of pension assets as a percentage of gross domestic product (GDP); demographic issues (life expectancy, pension age, fertility rate); level of mandatory contributions with funding; labor-force participation rate among older workers; and net government debt. The integrity sub-index includes a consideration of the regulation of private pension plans, governance requirements, protection of member benefits, communication to members, and costs of the system. ebri.org Issue Brief • August 2012 • No. 374
18
Cameron noted that different countries fared better in some areas than others. For example, the Netherlands was topranked of the 16 countries considered in the adequacy and integrity sub-indexes, while Sweden was top-ranked in sustainability. She explained that in order to calculate the overall index for a country, the three sub-indexes were weighted: 40 percent on adequacy, 35 percent on sustainability, and 25 percent on integrity. The research concluded that an overall index score of 80 would be required to earn an “A” grade rating on the overall retirement system, and that none of the countries in the last three years of the study had yet reached that threshold, she said. However, in the “B” category (with an overall score of 65 to 80) were the Netherlands, Australia, Sweden, Switzerland, Canada, and the U.K. Those in the “C” category (index score of 50 to 65) were Chile, Poland, Brazil, the United States, Singapore, France and Germany. She noted that the C scoring indicated some good features, but also some significant risks and challenges that would need to be addressed in order to achieve a higher rating (Figure 9). Figure 9
The 2011 Results Melbourne Mercer Global Pension Index NTH
B+
AUS
B+
SWE
B Grade
SUI CAN UK C+
CHL POL BRA
C Grade
USA SNG FRA GER JPN IND
D Grade
CHN
0
20
40
60
80
100
Index value MERCER Mercer
16 August 2012
0
.
Cameron said that the index is updated each year by taking into account new data that may become available (factors such as Organization for Economic Co-operation and Development (OECD) data, longevity, financial situations, and market activity that might affect pension assets) and that the methodology is refined. She specifically noted that the current version had been adjusted to factor in fertility rates and some workforce statistics, as well as the addition of new countries (three last year). She said that changes in relevant laws in each country are taken into account, as are changes affecting benefit calculation such as the recent change to the reference index for pensions in the U.K. The report8 identifies areas of improvement/enhancement for each individual country in the index. Cameron closed by noting common challenges for retirement systems all around the world: The need to increase the state pension age and/or “normal” retirement age for full benefits. The need to promote higher labor-force participation at older ages. The need to encourage or require higher levels of private saving. The need to increase retirement coverage of employees and/or the self-employed. The need to reduce asset leakage from retirement savings systems before retirement.
ebri.org Issue Brief • August 2012 • No. 374
19
Integrating Retirement Income Optimization The last session of the policy forum focused on the question of how to integrate an efficient investment portfolio approach for retirement income optimization with plan options during the accumulation phase. Chris Raham, senior advisor with Ernst & Young, noted that no matter what the measure is, and whether certain or non-certain risks are included, the overwhelming message today is that people who are in the middle stage of their accumulation profile are at risk of running short of funds in retirement—and, left to their own devices, without modification, are likely to be in significant trouble. The amount of time for people 10 to 15 years away from retirement have spent thinking about and planning for retirement in a meaningful way changes dramatically by wealth level, he said. Raham said that employment changes are often driven by influences immediately before retirement that workers cannot control: job termination, disability, layoffs, etc. These events will adversely affect individuals’ ability to live comfortably in retirement.
Raham
He noted that an important and growing trend among many plan sponsors is the acknowledgement of outcome variability in retirement savings and that sponsors are incorporating these issues in communication materials to better illustrate tradeoffs, such as the costs of early retirement and benefits of delaying retirement. Raham said that there are some risk elements that aren't yet fully addressed in many workers’ retirement plans, such as greater longevity and health care expenditures. By introducing these elements in the planning discussion, he said, individuals can prepare and plan for their retirement as it may actually occur, rather than simply projecting a specific financial outcome. The result, he noted, is that more individuals now anticipate there's going to be uncertainty, and they anticipate the need to “course-correct.” One transformation, compared with two or three years ago, is that organizations are beginning to develop and implement guaranteed-income options, he noted. “All this effort is focused on moving people from a traditional investment allocation approach to something that we would consider to be a more durable approach to generating income.”
Protecting Income Raham said there are different ways to protect income as it accumulates toward retirement, and, regardless of the approach, the basic choice is a form of asset allocation between an investment and an insurance-type of instrument. For individuals saving outside the workplace, the next thing to consider is the tax-efficient sheltering of income, Raham added, noting that several studies have shown as much as 30‒40 percent more lifetime income can be generated if it’s in a tax-efficient product. “This may play more in the retail [individual] environment than the ‘in-plan’ employmentbased design,” he noted, but it is a critical consideration. Why is this all important? Raham noted that the outcomes of investment-only solutions for income protection are significantly less than if insurance-based products are also included to provide risk-oriented or risk-mitigating types of solutions. He noted that health care costs could have a significant impact on income levels and that protection from that risk (insurance or something else) could help mitigate that cost significantly. “Risk protections are important for increasing or preserving the level of income in retirement, especially for those with little accumulated assets,” he said.
“Starting” Points Raham said there are ways plan sponsors can present participants with information in a more retirement-friendly way to help them better understand the importance of starting to save early in their careers. This is especially important for workers who are largely dependent on a 401(k) plan for their retirement income and who need to understand the accumulation, transition, and retirement phases of financing their retirement. He identified five basic questions related to the nature and timing of the retirement decision:
ebri.org Issue Brief • August 2012 • No. 374
20
Am I going to do it now? Am I going to do it a little later? Should I keep working? Should I not keep working? How should I think about social programs? Should I take Social Security benefits earlier or later? How should I think about any kind of Medicare-type assistance programs? Should I think about (or do I even have assets to think about) pension benefits that might be available to me from a prior employer? What about things like home equity? What should I do with my 401(k) dollars? What are the tax consequences involving the things I want to do? Raham explained that when his firm did mass-market research, it found that just getting participants to address those five categories of questions could result in a 40–50 percent increase in after-tax retirement income for those earning around $100,000. Raham said that foundational changes in thinking and approaches are now occurring among private-sector retirement plan sponsors and that affordable access to employment-based plans might be the most crucial policy objective. While the objectives and complexity of retirement plans will always differ by corporate sponsor, he predicted that both workers and plan sponsors are likely to benefit from these changes. Illustrating one type of approach, Bob Shaw, executive vice president, Individual Markets at Great-West Life and Annuity, talked about the experience his firm had with the introduction of a Guaranteed Lifetime Withdrawal Benefit (GLWB) as an in-plan lifetime income option. He noted that the offering was designed to guarantee an annual income payment stream throughout retirement, and that the annual income payment is typically 4–7 percent of the customer’s “benefit base” (which is initially set at asset value when the customer elects the GLWB).
Shaw
Shaw noted that there are three key benefits of this offering:
1. Upside potential: If markets go up, the participant/customer can lock in higher income levels. 2. Downside protection: If the markets decline, the guaranteed income levels do not drop. 3. Guaranteed income for life: If the participant/consumer manages to deplete their account value over time, the income payments are guaranteed for life. Additionally, if the participants need to access some or all of their account value at some point in the future, they are able to withdraw without charge, although the protected future income stream will be decreased proportionately. Shaw explained that as they were coming to market with the product, they focused on two things: the benefits provided by the GLWB, and at what age the guarantee should be added—early on prior to when income is needed, or at the point of retirement. Working with Ibbotson Associates, he said they compared the product to a typical asset allocation strategy that a participant might have, with a relatively high equity component preretirement that declines over time up to or throughout retirement. This approach—similar to the “glide path” of a target-date fund—was compared with the GLWB product with a static asset allocation mix at 60 percent equities but with guaranteed income. Shaw noted that there were two components to be explored: what's happening to the participant's income level, and what's happening to their account value (or wealth). Running a stochastic investment analysis, he noted that, in the typical asset allocation strategy with 25‒30 percent allocation to equities in the later years, 401(k) accounts in poor markets may be fully depleted between the ages of 75 and 80. However, with the GLWB, in poor markets, while the participants’ account values still ran out of money, the participants could rely on the guaranteed withdrawal payments. And in good markets, staying more heavily invested in the equity markets means that the participant’s account values may actually be higher, even after GLWB fees, than the ebri.org Issue Brief • August 2012 • No. 374
21
401(k) accounts with declining equity allocations and no guarantee. The higher account balance associated with the GLWB allows the participant to take more guaranteed income, helping to keep up with the erosive effects of inflation. Shaw noted that guaranteed withdrawal benefit products can help optimize asset allocations for customers when they become focused on generating retirement income. “First of all, they never run out of that stream of income payments that's expected from their retirement savings, so they have longevity protection, and secondly, by guaranteeing income and reducing that specific risk, the participant may feel more comfortable in maintaining a more aggressive equity exposure through retirement,” he said. Shaw said it was decided to start the feature 10 years prior to retirement because it helped protect against sequenceof-returns risk, the toll that negative market returns can take on retirement accounts as the worker enters or nears retirement. Workers are likely to have their largest account balances just as they enter retirement. This makes the level of returns more important to the worker. If returns are negative as the worker begins to withdraw, their balance will be depleted faster. If returns are positive as the worker begins to withdraw, their balance may last longer. Obviously, this is beyond the control of the worker, so it’s important to have a product that guarantees their income stream no matter what returns are. And starting that guarantee prior to retirement means workers will not have to change their plans if the market suddenly drops right before they retire. In working with Ibbotson, it was found that seven to 10 years prior to retirement was the most appropriate time to begin protecting against market movements versus paying the guarantee fee, Shaw explained. A key question with the approach is whether individuals will fully understand the nature of the product and be able to exercise self-control: Do they understand that dipping into the account value would undermine the guarantee? Disclosures will be made to individuals so that they can understand how the product works, Shaw said. Raham noted that there were risks with relying on any single product as a solution to ensuring adequate retirement income. He suggested the best answer is a composition of solutions, some of which might include equity investments, dividend-based products, and growth-of-dividend strategies. Shaw noted that these products are evolving, which “really accents the need for product portfolio discussions now, not just traditional asset allocation discussions.”
Endnotes 1
See Paul Fronstin, “Employment-Based Health Benefits: Trends in Access and Coverage, 1997–2010,” EBRI Issue Brief (April 2012), online at www.ebri.org/pdf/briefspdf/EBRI_IB_04-2012_No370_HI-Trends.pdf 2
See Craig Copeland, “Individual Retirement Account Balances, Contributions, and Rollovers, 2010: The EBRI IRA DatabaseTM” (Figure A), EBRI Issue Brief no. 371 (May 2012) online at www.ebri.org/publications/ib/index.cfm?fa=ibDisp&content_id=5068 3
See the EBRI “Value of Benefits Survey,” www.ebri.org/pdf/notespdf/0302notes.pdf
4
See “Fiscal Year 2012 Analytical Perspectives, Budget of the U.S. Government,” Tax Expenditures section, Table 17.3 on pg. 252. www.whitehouse.gov/sites/default/files/omb/budget/fy2012/assets/spec.pdf 5
See the recommendations by the National Commission on Fiscal Responsibility and Reform (the so-called Simpson-Bowles report, named for co-chairs Alan Simpson and Erskine Bowles), online at www.fiscalcommission.gov/; and testimony by William Gale before the Senate Finance Committee, “Tax Reform Options: Promoting Retirement Security,” Sept. 5, 2011, online at http://finance.senate.gov/imo/media/doc/Testimony%20of%20William%20Gale.pdf 6
Ithai Z. Lurie and Shanthi Ramnath, "Long-Run Changes in the 401(k) Type Plans Tax-Expenditure." National Tax Journal (64-December 2011), pp: 1025-38.
7
More EBRI research on IRAs was published in May 2012 EBRI Issue Brief (endnote 2).
8
Information about the Melbourne Mercer Global Pension Index, and the full report is available at www.mercer.com/globalpensionindex
ebri.org Issue Brief • August 2012 • No. 374
22
Statement of Ownership United States Postal Service Statement of Ownership, Management, and Circulation Publication Title: EBRI Employee Benefit Research Institute Issue Brief Publication Number: 0887-137x 1) Filing Date: 08/31/2012. 2) Issue Frequency: Monthly. 3) Number of Issues Published Annually: 12. 4) Annual Subscription Price: $300 per year or is included as part of a membership subscription. 5) Complete Mailing Address of Known Office of Publication: (Not printer): Employee Benefit Research Institute (EBRI), 1100 13th Street NW, Suite 878, Washington, DC 20005. 6) Complete Mailing Address of Headquarters or General Business Office of Publisher (Not printer): Employee Benefit Research Institute (EBRI), 1100 13th Street NW, Suite 878, Washington, DC 20005. 7) Full Names and Complete Mailing Addresses of Publisher, Editor, and Managing Editor (Do not leave blank): Publisher, Employee Benefit Research Institute – Education and Research Fund, 1100 13th Street NW, Suite 878, Washington, DC 20005. Editor, Dallas L. Salisbury, Employee Benefit Research Institute – Education and Research Fund, 1100 13th Street NW, Suite 878, Washington, DC 20005. Managing Editor, Stephen Blakely, Employee Benefit Research Institute – Education and Research Fund, 1100 13th Street NW, Suite 878, Washington, DC 20005. 8) Owner: Full Name: Employee Benefit Research Institute – Education and Research Fund. 9) Known Bondholders, Mortgagees, and Other Security Holders Owning or Holding 1 Percent or More of Total Amount of Bonds, Mortgages or Other Securities: None. 10) Tax Status (For completion by nonprofit organizations authorized to mail at nonprofit rates) The purpose, function, and nonprofit status of this organization and the exempt status for federal income tax purposes: Has not changed during preceding 12 months: 501(c)(3). 11) Publication’s name: EBRI Employee Benefit Research Institute Issue Brief. 12) Issue Date for Circulation Data Below: August 2012. 13) Extent and Nature of Circulation: a. Total Number of Copies: Average No. Copies Each Issue During Preceding 12 Months: 346; No. Copies of Single Issue Published Nearest to Filing Date: 346. b. Paid and/or Requested Circulation (1) Paid/Requested Outside-County Mail Subscriptions Stated on Form 3526: Average No. Copies Each Issue During Preceding 12 Months: 207; No. Copies of Single Issue Published Nearest to Filing Date: 207. (2) Paid In-County Subscriptions Stated on Form 3526; Average No. Copies Each Issue During Preceding 12 Months: 28; No. Copies of Single Issue Published Nearest to Filing Date: 28. (3) Sales Through Dealers and Carriers, Street Vendors, Counter Sales, and Other Non-USPS Paid Distribution: Average No. Copies Each Issue During Preceding 12 Months: 0; No. Copies of Single Issue Published Nearest to Filing Date: 0; (4) Other Classes Mailed Through the USPS: Average No. Copies Each Issue During Preceding 12 Months: 0; No. Copies of Single Issue Published Nearest to Filing Date: 0; c. Total Paid and/or Requested Circulation [Sum of 15b. (1), (2), (3), and (4)] Average No. Copies Each Issue During Preceding 12 Months: 235; No. Copies of Single Issue Published Nearest to Filing Date: 235. d. Free Distribution by Mail (Samples, complimentary, and other free): (1) Outside-County as Stated on Form 3526: Average No. Copies Each Issue During Preceding 12 Months: 52; No. Copies of Single Issue Published Nearest to Filing Date: 52; (2) In-County as Stated on Form 3526: Average No. Copies Each Issue During Preceding 12 Months: 9; No. Copies of Single Issue Published Nearest to Filing Date: 9. (3) Other Classes Mailed Through the USPS: Average No. Copies Each Issue During Preceding 12 Months: 0; No. Copies of Single Issue Published Nearest to Filing Date: 0. e. Free Distribution Outside the Mail (Carriers of other means): Average No. Copies Each Issue During Preceding 12 Months: 0; No. Copies of Single Issue Published Nearest to Filing Date: 0. f. Total Free Distribution (Sum of 15d. And 15e.): Average No. Copies Each Issue During Preceding 12 Months: 61; No. Copies of Single Issue Published Nearest to Filing Date: 61. g. Total Distribution (Sum of 15c. And 15f.): Average No. Copies Each Issue During Preceding 12 Months: 296; No. Copies of Single Issue Published Nearest to Filing Date: 296. h. Copies not Distributed: Average No. Copies Each Issue During Preceding 12 Months: 50; No. Copies of Single Issue Published Nearest to Filing Date: 50. i. Total (Sum of 15g. And 15h.): Average No. Copies Each Issue During Preceding 12 Months: 346; No. Copies of Single Issue Published Nearest to Filing Date: 346. j. Percent Paid and/or Requested Circulation: Average No. Copies Each Issue During Preceding 12 Months: 79%; No. Copies of Single Issue Published Nearest to Filing Date: 79%. 16. Publication of Statement of Ownership Publication: Will be printed in the August 2012 issue of this publication. 14) Signature and Title of Editor, Publisher, Business Manager, or Owner: Dallas Salisbury, editor; Employee Benefit Research Institute, publisher; Stephen Blakely, managing editor. Date: 08/13/2012. I certify that all information furnished on this form is true and complete: Stephen Blakely, Editor and Director of Communications. Date: 08/13/2012.
EBRI Employee Benefit Research Institute Issue Brief (ISSN 0887137X) is published monthly by the Employee Benefit Research Institute, 1100 13th St. NW, Suite 878, Washington, DC, 20005-4051, at $300 per year or is included as part of a membership subscription. Periodicals postage rate paid in Washington, DC, and additional mailing offices. POSTMASTER: Send address changes to: EBRI Issue Brief, 1100 13th St. NW, Suite 878, Washington, DC, 20005-4051. Copyright 2012 by Employee Benefit Research Institute. All rights reserved. No. 374.
Who we are
What we do
Our publications
Orders/ Subscriptions
The Employee Benefit Research Institute (EBRI) was founded in 1978. Its mission is to contribute to, to encourage, and to enhance the development of sound employee benefit programs and sound public policy through objective research and education. EBRI is the only private, nonprofit, nonpartisan, Washington, DC-based organization committed exclusively to public policy research and education on economic security and employee benefit issues. EBRI’s membership includes a cross-section of pension funds; businesses; trade associations; labor unions; health care providers and insurers; government organizations; and service firms. EBRI’s work advances knowledge and understanding of employee benefits and their importance to the nation’s economy among policymakers, the news media, and the public. It does this by conducting and publishing policy research, analysis, and special reports on employee benefits issues; holding educational briefings for EBRI members, congressional and federal agency staff, and the news media; and sponsoring public opinion surveys on employee benefit issues. EBRI’s Education and Research Fund (EBRI-ERF) performs the charitable, educational, and scientific functions of the Institute. EBRI-ERF is a tax-exempt organization supported by contributions and grants. EBRI Issue Briefs is a monthly periodical with in-depth evaluation of employee benefit issues and trends, as well as critical analyses of employee benefit policies and proposals. EBRI Notes is a monthly periodical providing current information on a variety of employee benefit topics. EBRI Fundamentals of Employee Benefit Programs offers a straightforward, basic explanation of employee benefit programs in the private and public sectors. The EBRI Databook on Employee Benefits is a statistical reference work on employee benefit programs and work force-related issues. Contact EBRI Publications, (202) 659-0670; fax publication orders to (202) 775-6312. Subscriptions to EBRI Issue Briefs are included as part of EBRI membership, or as part of a $199 annual subscription to EBRI Notes and EBRI Issue Briefs. Change of Address: EBRI, 1100 13th St. NW, Suite 878, Washington, DC, 20005-4051, (202) 659-0670; fax number, (202) 775-6312; e-mail:
[email protected] Membership Information: Inquiries regarding EBRI membership and/or contributions to EBRI-ERF should be directed to EBRI President Dallas Salisbury at the above address, (202) 659-0670; e-mail:
[email protected]
Editorial Board: Dallas L. Salisbury, publisher; Stephen Blakely, editor. Any views expressed in this publication and those of the authors should not be ascribed to the officers, trustees, members, or other sponsors of the Employee Benefit Research Institute, the EBRI Education and Research Fund, or their staffs. Nothing herein is to be construed as an attempt to aid or hinder the adoption of any pending legislation, regulation, or interpretative rule, or as legal, accounting, actuarial, or other such professional advice. www.ebri.org EBRI Issue Brief is registered in the U.S. Patent and Trademark Office. ISSN: 0887137X/90 0887137X/90 $ .50+.50
© 2012, Employee Benefit Research InstituteEducation and Research Fund. All rights reserved.