J. Dairy Sci. 97:7547–7563 http://dx.doi.org/10.3168/jds.2014-8237 © American Dairy Science Association®, 2014. Open access under CC BY-NC-ND license.
Diseases, reproductive performance, and changes in milk production associated with subclinical ketosis in dairy cows: A meta-analysis and review D. Raboisson,*†‡1 M. Mounié,‡ and E. Maigné‡
*Université de Toulouse, Institut National Polytechnique (INP), Ecole Nationale Vétérinaire de Toulouse (ENVT), UMR 1225, Interaction Hôte Agent Pathogène (IHAP), F-31076 Toulouse, France †INRA, UMR1225, IHAP, F-31076 Toulouse, France ‡INRA, ODR, Observatoire des Programmes Communautaires de Développement Rural, F- 31326 Auzeville, France
ABSTRACT
Many studies have shown that subclinical ketosis (SCK) is associated with an increased risk of developing various diseases, reproductive disorders, and changes in milk production. The present work aims at producing an overview between this disorder and theses outcomes. A meta-analysis of the literature, including 131 different models from 23 papers, or a review when the literature was scarce was conducted. For each outcome, the odds ratio (OR), relative risk, or hazard ratio was presented for various moderators to reduce heterogeneity among the studies. The raw change in milk production associated with SCK was estimated and adjusted, taking into consideration the outcomes known to interact with milk production during the peripartum period. The results showed that 2 main categories of moderators had a significant effect on the adjusted risk. First, the adjustment made by defining SCK as (1) β-hydroxybutyrate concentration >1.4 mM, (2) nonesterified fatty acid (NEFA) concentration >0.4 mM prepartum, or (3) NEFA concentration >1.0 mM postpartum corrected the underestimated risk (despite low significance). This is because several trials reported the relevant risks using lower thresholds for the β-hydroxybutyrate or NEFA values. Using a low threshold leads to lower risk of disease compared with using a high threshold. Second, the correction produced using the polyfactorial terms corrected the overestimation of risk because many trials reported only univariable models. The relative risk or OR (95% confidence interval) related to abomasal displacement, clinical ketosis, early culling and death, metritis, placental retention, clinical mastitis, lameness, and a doubling of the SCC in cases with SCK were 3.33 (2.60–4.25), 5.38 (3.27–8.83), 1.92 (1.60–2.30), 1.75 (1.54–2.01), 1.52 (1.20–1.93), 1.61 (1.24–2.09), 2.01(1.64–2.44), and 1.42 (1.26–1.60), respectively. The precision level of the Received April 15, 2014. Accepted August 28, 2014. 1 Corresponding author:
[email protected]
estimate depended on the outcome. The direct mean ± standard deviation of the 305-d milk losses associated with SCK were 251 ± 73 kg after adjusting for abomasal displacement, clinical ketosis, metritis, and placental retention. The OR (95% confidence interval) for first service calving risk in cases of SCK was 0.67 (0.53–0.83). The calving-to-first-service interval was 8 d longer and the calving-to-conception interval was 16 to 22 d longer in cows with SCK. The relationships among the different reproductive indicators were quantified in only 1 or 2 trials. The present work highlights the need to conduct further studies on the associations between SCK and the risks of diseases, changes in milk production, and reproductive parameters. Key words: dairy cow, subclinical ketosis, ketosis, risk factor, review INTRODUCTION
Most transition dairy cows experience a negative energy balance (NEB) because of increased energy demands at parturition, decreased DMI shortly before parturition, and a decrease in DMI relative to demand. A certain degree of NEB is expected in transition cows. Subclinical ketosis (SCK) is defined as the presence of increased blood ketone concentrations without clinical signs. Clinical ketosis refers to the presence of clinical signs in addition to an increase in blood ketones (Andersson, 1988). The definition of SCK consists of a blood BHBA concentration greater than 1.4 mM during early lactation (Duffield et al., 2009). However, increased concentrations of both BHBA and NEFA will be used as markers of SCK. Many studies have shown that increased concentrations of BHBA or NEFA are associated with an increased risk of developing various diseases, reproductive disorders, and changes in milk production (Duffield et al., 2009; McArt et al., 2013; Suthar et al., 2013). Most of these studies have determined the objective cow-level NEFA and BHBA thresholds that are associated with increased risk of disorder. These thresholds allow the
7547
7548
RABOISSON ET AL.
producer to identify individual cows at risk for these outcomes during the transition period. A large proportion of these data were obtained in North America in the 2000s. Many of these studies used similar statistical methods and expressed their results in the same way, leading to a good overview of the NEB issue and allowing for the comparison of study results. However, 3 main factors have complicated the use of these results. First, data regarding certain outcomes have remained scarce. For instance, only one trial examined the link between SCK and lameness (Suthar et al., 2013). Second, the covariates included in the models have differed among and within studies, and the estimation of the relevant risk has often depended on these covariates. For instance, including the covariate hypocalcemia in one model led to a decrease in the risk of SCK from 24.6 to 13.6 (Seifi et al., 2011). Finally, the BHBA or NEFA thresholds have differed among studies and for different studied outcomes. Additionally, the calculated odds ratio (OR), relative risk (RR), and hazard ratio (HR) have been highly dependent on the defined BHBA and NEFA thresholds, and these thresholds have not always matched the chosen definition of SCK. The use of these data has been complicated by the changing definition of SCK. The BHBA threshold, for example, varies from 0.3 (Suthar et al., 2013) to 1.8 mM (Duffield et al., 2009). This third point is all the more concerning because the same studies have been used to define SCK and to determine the risk of various outcomes. In most cases, several thresholds have been tested, and the best model (lowest P-value) has been retained (with the best threshold and OR, RR, or HR linked). Depending on the studied outcome and peripartum period [prepartum or postpartum wk 1 and (or) 2], the best threshold for a given metabolite (BHBA or NEFA) can vary. However, for practical purposes, the chosen definition of SCK has been assumed to remain constant, even if the risks estimated in the literature were not always obtained using this consensus definition. Given the growth of the literature on this topic in the 2000s, an overview of the association between SCK and (1) the risk of various diseases, (2) the changes in milk production, and (3) the changes in reproductive performance is needed. Such an overview must include a clear quantification of the risk of various outcomes in cows with SCK. For each outcome (disease or change in performance), the data available in the literature must be adjusted using a standardized method to account for the different studied metabolites, thresholds, covariates, peripartum periods, and statistical methods. The aim of the present work was to provide an overview of the relationship between SCK and (1) the risk of abomasum displacement, clinical ketosis, culling, metritis, placental retention, mastitis, and lameness; (2) Journal of Dairy Science Vol. 97 No. 12, 2014
the changes in milk production and SCC; and (3) the changes in reproductive performances in dairy cows. To ensure this, a meta-analysis was performed when data were available, and a review of the literature was performed when data were scarce. MATERIALS AND METHODS
A literature search and screening process were conducted using the PubMed (http://www.ncbi.nlm. nih.gov/pubmed), CAB (www.cabi.org), and Google Scholar (http://scholar.google.com/) search engines to create a data set of papers using the key words “hyperketonemia,” “ketosis,” “cattle,” and “cow,” separately or in combination. New papers referenced by at least 1 of the papers identified in the previous step were also included. Because of the lack of published data on the risk of mastitis in cows with SCK, unpublished information from the Mastitis National Council Website (https://www.nmconline.org/) was also included. Inclusion and Exclusion Criteria
To be included in the data set, the papers must have examined the risks of various diseases, the changes in milk production, or the changes in reproductive performances (named outcomes) in peripartum dairy cows with and without subclinical ketosis. Only papers that calculated risks at the animal level were included, except one that addressed milk production. Thus, all review papers, herd-level analyses, and nontarget papers (such as research on the association between NEB and immunity or on the prevention or treatment of subclinical or clinical ketosis) were excluded. Publications through June 2013 were included. Twenty-three papers evaluating the association between SCK and the abovementioned outcomes in dairy cattle were available. Most of the papers studied several outcomes, and 131 different models published in the literature were included in the present study. A template for data extraction was drafted. It included the numbers of cows and herds studied, the average milk production, the statistical method used (logistic regression, Poisson regression, or raw data with contingency table), the expression of risk, the prevalence of SCK, the metabolite used to diagnose SCK (blood BHBA and NEFA or milk BHBA), the threshold used to diagnose SCK, the peripartum week of sampling, the number of samplings per cow, the nature of the reported model [univariable (U) or multivariable (M)], the prevalence of the outcome or of the mean value if relevant, the value of the risk or the change in the outcome and its 95% confidence interval, standard error or standard deviation, and all of the covariates
7549
SUBCLINICAL KETOSIS IN DAIRY COWS
Table 1. Nonesterified FA and BHBA thresholds used to build the moderators for the diagnosis of subclinical ketosis (SCKDIAG) Prepartum Class SCKDIAG1 1 2 3 SCKDIAG2 1 2 3
Postpartum
NEFA (mM)
NEFA (mM)
BHBA (mM)
0.3 0.4 0.5
0.7 1.0 NC1
1.2 1.4 1.8
0.2 0.3 0.5
NC 0.7 NC
1.0 1.2 1.8
1
NC = no case or not defined.
included within the given model. The threshold used to diagnose SCK was then transformed into 2 categorical moderators (SCKDIAG1 and SCKDIAG2) according to the rules noted in Table 1. All of the covariates of the models were grouped into 8 moderators for the metaanalysis according to the rules described in Table 2. The moderator associated with univariable or multivariable models was designated U/M and the moderator referring to the risk expression (i.e., OR, RR, or HR) was designated OR/RR. When relevant, the risk was adjusted to a standardized value of only 1 detection per cow and per period (prepartum or postpartum). All of the studied publications had taken samples before the onset of disease. Many models were reported in each publication, and choices had to be made regarding which model to retain. Different models within a single paper were often based on the same cow-level raw data but differed in terms of
(1) the outcome variable studied, (2) the use of NEFA or BHBA to define SCK (moderator designated SCKNEFABHBA), (3) the threshold NEFA or BHBA values used to define SCK (i.e., different classes for SCKDIAG1 or SCKDIAG2), and (4) the covariates included in the studied models (i.e., moderator U/M). When univariable and multivariable models were available for the same study and outcomes, the multivariable model was retained. When the NEFA or BHBA thresholds of the multivariable model were different from the reference values (Table 1), the related univariable model (with the same outcome) and the correct reference value were also kept for the meta-regression. When the risk was defined for the prepartum and postpartum period for the same outcome within the same publication, both models were retained. When either NEFA or BHBA values were used to define the risk within the same publication, outcome and prepartum or postpartum
Table 2. Definition of the moderators P1 to P8 used in the multivariable models described in the literature and in the meta-regressions Moderator
Definition1
P1
MET and (or) PR and (or) MF and (or) Ca
P2
MET and (or) PR and (or) MF and (or) Ca
P3
MET and (or) PR and (or) MF and (or) Ca
P4
MF and (or) Ca
P5
Ca
P6
Twins and (or) dystocia
P7
Endometritis
P8
Milk
1
Class 0 1 0 1 0 1 2 0 1 2 0 1 0 1 2 0 1 2 0 1 2
(Reference) (Reference) (Reference) (Reference)
(Reference) (Reference) (Reference)
Rule Not tested Tested (P < 0.05 or P > 0.05) Not tested or P > 0.05 P < 0.05 Not tested Tested and P > 0.05 P < 0.05 Not tested Tested and P > 0.05 P < 0.05 Not tested or P > 0.05 P < 0.05 Not tested Tested and P > 0.05 P < 0.05 Not tested Tested and P > 0.05 P < 0.05 Not tested Tested and P > 0.05 P < 0.05
MET = metritis; PR = placental retention; MF = milk fever; Ca = hypocalcemia. Journal of Dairy Science Vol. 97 No. 12, 2014
7550
RABOISSON ET AL.
period, both models were included. Therefore, because of various degrees of dependence among the models retained for the meta-regression, 1 extra moderator was created (designated “group”) for each outcome by grouping the different models in the same paper into different random classes. A minimum of 10 trials for any outcome was arbitrarily established as the requirement for assessing the meta-regression between SCK and the outcome. Most of the outcomes were defined as previously proposed (LeBlanc et al., 2002b). In brief, metritis included systemic illness (LeBlanc et al., 2002b). Subclinical endometritis and cytological endometritis were considered to be the same disease (Dubuc et al., 2010; Cheong et al., 2011), and clinical endometritis (LeBlanc et al., 2002a) was defined as purulent vaginal discharge, as previously proposed (Dubuc et al., 2010). If relevant, the duration of the period of disease inclusion was reported with the results.
variability among the true effects that is not accounted for by the moderators included in the model. All of the variables that met the first screening criteria were entered into a backward stepwise regression model until all of the variables that remained were significant at P < 0.05. Forest plots were used to display visually the estimated effect size, its 95% confidence interval and the final meta-regression adjustments. For all of the meta-regressions, the reference classes of the moderators were chosen to allow for the direct interpretation of the effect size as an adjusted risk of outcome in the case of SCK. Because OR, RR, or HR were used in the various analyses, the term “risk” refers to any of these terms when at least 2 of them were used in the meta-regression. Values within parentheses after the risk value refer to 95% confidence intervals.
Statistical Analysis: Meta-Analysis
Abomasal Displacement
A meta-analysis was conducted on the extracted outcomes using the metafor package (Viechtbauer, 2010) of R (version 3.0.2; R Foundation for Statistical Computing, Vienna, Austria). A random-effects model was first conducted for each metabolite to estimate the logarithmic effect size, its 95% confidence interval, and its statistical significance. The effect size estimate analysis was conducted using a standardized z statistic. The inconsistency of results among trials was quantified using both Cochran’s Q test and the I2 statistic (Higgins et al., 2003). The I2 statistic describes the percentage of total variation across studies that was caused by heterogeneity rather than chance (I2 lay between 0 and 100%). A value greater than 50% was considered to indicate substantial heterogeneity. If evidence of heterogeneity was found, a meta-regression analysis was subsequently performed to explore the sources of heterogeneity, using the logarithmic individual effect size for each trial as the outcome and a fixed-effects model or mixed-effects model with the random moderator “group.” The meta-regression was first conducted by screening for the moderators SCKDIAG1, SCKDIAG2, SCKNEFABHBA, OR/RR, U/M, and P1 to P8 [where P1, P2, and P3 refer to metritis and (or) placental retention and (or) milk fever and (or) hypocalcemia; P4 refers to milk fever or hypocalcemia; P5 refers to hypocalcemia; P6 refers to twins and or dystocia; P7 refers to endometritis; and P8 refers to milk production]. The τ2 of the models, without or with moderators, were compared to explain the decrease in heterogeneity that occurred when the moderator was included in the model. Here, τ2 denoted the amount of residual heterogeneity among the true effects; that is,
The association between SCK and abomasal displacement was reported in 38 models from 10 publications (Supplemental Table S1; http://dx.doi.org/10.3168/ jds.2014-8237). Sixteen of these models in 3 papers considered only left abomasal displacement, whereas the others described right or left displacement. Because 87.5% of the abomasal displacement occurred on the left side (Doll et al., 2009), the following results were standardized for left abomasal displacements only. The results were also standardized for the number of detections (the number of samplings a few days apart taking from the same cow) reported in the study (McArt et al., 2013). The mean (SD) risk of abomasal displacement associated with SCK was 5.12 (3.50), which was very close [5.16 (3.66)] to the results obtained when excluding trials with tests on milk (Geishauser et al., 1997b; LeBlanc et al., 2005) or when using paired animals (Geishauser et al., 1997a,b, 1998). The comparison of the raw results obtained in these studies revealed 3 pieces of important findings (Supplemental Table S1; http://dx.doi.org/10.3168/ jds.2014-8237). First, when comparing the model results obtained within the same publications, during the same physiological period, and in models with the same set of covariates, it could be observed that the increased threshold values used to diagnose SCK resulted in increased risk values. For instance, the risk increased from 2.6 to 2.8 when the BHBA threshold increased from 1.2 to 1.4 mM. The risks were 3.1, 3.7, and 6.2 when the BHBA thresholds were 1.2, 1.4, and 1.8 mM, respectively (Duffield et al., 2009). Two exceptions occurred: no change in OR was detected when the BHBA threshold increased from 1.2 to 1.4 mM (LeBlanc et
Journal of Dairy Science Vol. 97 No. 12, 2014
RESULTS
7551
SUBCLINICAL KETOSIS IN DAIRY COWS
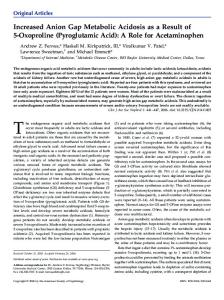
al., 2005) and a decreased risk was observed when the BHBA threshold increased from 1.0 to 1.4 mM (Seifi et al., 2011). Second, for a given threshold, period and study, the risk was always lower in the multivariable models than in the univariable model. The 2 exceptions were an OR increase from 3.4 to 3.6 and from 6.2 to 7.0, from the multivariable to the univariable model (LeBlanc et al., 2005; Duffield et al., 2009). Third, it was difficult to compare the risks of changes in covariates because changes in several covariates often occurred simultaneously. The inclusion of hypocalcemia (<2.3 mM) in the model (with all of the other parameters fixed and a BHBA threshold of 1.0 mM) resulted in a decrease in the OR of abomasal displacement from 24.6 to 13.6 (Seifi et al., 2011). The values of the effect size for left abomasal displacement followed a log-linear or a χ2 distribution (Kolmogorov-Smirnov test accepted). The heterogeneity of the data set was high [I2 = 68% (46–79%) and Q statistics χ2 = 126.6, df = 37; P < 0.001]. The intercept of the logarithmic effect size in the random-effect model with no moderator was 1.355 (SE = 0.085; P < 0.001), which corresponded to an effect size of 3.87 (3.25–4.58). Including the moderators SCKDIAG1, SCKNEFABHBA, U/M, OR/RR, P1, P3, P4, and SCKDIAG1 + SCKNEFABHBA reduced the heterogeneity by 15, 14, 16, 3, 5, 7, 10, and 17%, respectively (Table 3; Figure 1). The exclusion of results obtained with tests on milk or from trials with matched cows did not reduce the heterogeneity and did not change the coefficients of the meta-regression. In summary, the present work retains the risk (95% CI) of left abomasal displacement in cows with SCK adjusted for the moderator U/M, which is 3.3 (2.60–4.25). Clinical Ketosis
The association between SCK and clinical ketosis was reported in 16 models from 5 publications (Supplemental Table S2; http://dx.doi.org/10.3168/jds.20148237). The raw risk (mean ± SD) of clinical ketosis in cows with SCK was 8.90 ± 7.54, and it was 7.30 ± 3.77 when the nonsignificant (P > 0.05) result (Dohoo and Martin, 1984) was excluded. No particular trends were observed when results within the same publication or period and results from models with different covariates were compared. The values of the effect size for clinical ketosis followed log-linear or χ 2 distributions. The heterogeneity of the data set was high [I2 = 77% (51–87%) and Q statistics χ2 = 93.9, df = 15; P < 0.001). The intercept of the logarithmic effect size for the random-effects regression with no moderator was 1.938 (SE = 0.180; P < 0.001), which corresponded to an effect size of 6.95
(4.88–9.88). The inclusion of the moderators SCKNEU/M, and OR/RR reduced the heterogeneity by 28, 27, and 55%, respectively (Table 4; Figure 2). In summary, the present work shows the need to retain the risks (95% CI) of clinical ketosis in cows with SCK adjusted for the moderator U/M or on moderator OR/ RR, which are 5.38 (3.27–8.83) and 8.01 (4.80–13.36), respectively. FABHBA,
Culling
The association between SCK and culling within 60 d of calving was reported in 10 models from 3 studies (Supplemental Table S3; http://dx.doi.org/10.3168/ jds.2014-8237). Two papers (5 models) included death along with culling. The raw risk (mean ± SD) of early culling (including death) was 2.34 ± 1.03 after adjusting for the number of detections (McArt et al., 2013), and it was 1.9 ± 0.1 for early culling only (excluding death). A comparison of the raw data obtained in different studies emphasized that adjusting for hypocalcemia (with all of the other covariates fixed) led to a decrease in risk from 4.7 to 3.6 for sampling during postpartum wk 1 and from 2.6 to 1.7 for sampling during postpartum wk 2 (Seifi et al., 2011). The heterogeneity of the data set was high [I2 = 72% (38–95%) and Q statistics χ2 = 46.2, df = 9; P < 0.001]. The intercept of logarithmic effect size in the random-effects regression with no moderator was 0.655 (SE = 0.092; P < 0.001), which corresponded to an effect size of 1.92 (1.60–2.30). The inclusion of the moderator SCKNEFABHBA reduced the heterogeneity by 66% (Table 4; Figure 3) despite the limited significance (P = 0.08) of the moderator. The inclusion of the moderator P2 reduced the heterogeneity by 33%, but this result was not retained because of the correlation between P2 and SCKNEFABHBA (data not shown). In summary, the present work shows that the risk of early culling with no adjustment was 1.92 (1.60–2.30). The risk (95% CI) adjusted for the moderator SCKNEFABHBA, which is 1.50 (1.07–2.10), has to be retained. Metritis and Placental Retention
The association between SCK and metritis was reported in 12 models from 5 studies (Supplemental Table S4; http://dx.doi.org/10.3168/jds.2014-8237). A comparison of the raw results confirmed that the risk of metritis was lower in univariable models compared with multivariable models. The raw risks (mean ± SD) of puerperal metritis were 3.4 ± 4.3 and 2.2 ± 0.5 after removing the extreme value of 17.0, which was obtained with a very low NEFA threshold (0.36 mM postpartum) instead of the recommended threshold Journal of Dairy Science Vol. 97 No. 12, 2014
7552
Journal of Dairy Science Vol. 97 No. 12, 2014
Table 3. Risk of abomasal displacement in cases of subclinical ketosis obtained via meta-analysis1 Descriptive statistics3 n
m
SD
No moderator Intercept SCKDIAG1 = 1 SCKDIAG1 = 2 SCKDIAG1 = 3 Intercept SCKNEFABHBA = SCKNEFABHBA = Intercept U/M = U U/M = M Intercept OR/RR = OR OR/RR = RR Intercept P1 = 1 (yes) P1 = 0 (no) Intercept P3 = 1 (tested) P3 = 0 (no) P3 = 2 (yes) Intercept P4 = 1–2 (yes) P4 = 0 (no) Intercept SCKNEFABHBA = SCKNEFABHBA = SCKDIAG1 = 1 SCKDIAG1 = 2 SCKDIAG1 = 3
38
5.16
3.50
1
BHBA NEFA
BHBA NEFA
16 17 5
5.80 5.20 4.70
6.40 2.70 2.00
26 12
5.85 3.52
3.87 1.90
17 21
4.87 5.31
2.56 4.20
33 5
5.30 3.93
3.60 3.10
26 12
6.60 4.80
6.60 2.50
5 26 7
2.90 4.87 7.58
2.23 2.40 6.30
5 33
9.40 4.47
6.45 2.40
Estimate (SE) 1.57 (0.06)*** −0.42 (0.10)*** Reference −0.39 (0.15)** 1.50 (0.05)*** Reference −0.44 (0.10)*** 1.18 (0.06)*** 0.40 (0.09)*** Reference 1.45 (0.05)*** Reference −0.39 (0.11)*** 1.13 (0.07)*** Reference 0.43 (0.09)*** 1.10 (0.08)*** Reference 0.45 (0.10)*** 0.09 (0.15) 0.71 (0.16)*** Reference 0.71 (0.17)*** 1.63 (0.06)*** Reference −0.38 (0.11)*** −0.36 (0.10)*** Reference −0.15 (0.17)
Mixed-effects meta-regression
Risk
95% CI
4.83 0.65
4.28–5.44 0.54–0.79
0.67 4.51
0.50–0.90 4.06–5.01
0.64 3.20 1.49
0.52–0.79 2.89–3.66 1.25–1.78
4.27
3.88–4.71
0.98 3.09
0.54–0.84 2.70–3.54
1.53 3.01
1.34–1.75 2.55–3.55
1.57 1.08 2.05
1.28–1.93 0.82–1.44 1.49–2.80
2.04 5.12
1.47–2.84 4.53–5.80
0.68 0.69
0.55–0.85 0.57–0.84
0.86
0.62–1.19
Estimate (SE)
Risk
95% CI
1.35 (0.09)*** 1.24 (0,15)*** −0.02 (0.14) Reference −0.41 (0.23)†
3.87 3.47 0.98
3.25–4.58 2.57–4.67 0.74–1.30
0.66
0.42–1.04
1.20 (0.12)*** 0.24 (0.11)* Reference
3.33 1.27
2.60–4.25 1.02–1.59
1.11 (0.13)*** Reference 0.28 (0.11)* 1.05 (0.15)*** Reference 0.34 (0.18)* 0.17 (0.21) 0.83 (0.28)*** Reference 0.48 (0.29)†
3.04
2.35–3.92
1.31 2.84
1.06–1.64 2.11–3.82
1.40 1.19 2.28
1.05–1.83 0.78–1.81 1.32–3.94
1.62
0.92–2.86
Results refer to left abomasal displacement, adjusted for 87.5% that occurred on the left side (Doll et al., 2009). 2 SCKDIAG1 = class of subclinical ketosis definition; SCKNEFABHBA = test (NEFA or BHBA) used to define subclinical ketosis; U = univariable models; M = multivariable models; OR = odds ratio; RR = relative risk; P1 and P3 refer to metritis and (or) placental retention and (or) milk fever and (or) hypocalcemia; P4 refers to milk fever or hypocalcemia. 3 n = number; m = mean. ***P < 0.001; **P < 0.01; *P < 0.05; †P < 0.10.
RABOISSON ET AL.
Item2
Fixed-effects meta-regression
SUBCLINICAL KETOSIS IN DAIRY COWS
7553
Figure 1. Forest graph for abomasal displacement. Adjustments were made for the moderator “multivariable models.” The column on the left refers to univariable (U) or multivariable (M) models. The column on the right refers to the logarithmic-scale observed outcomes [odds ratio (OR) or relative risk (RR)] and their relative 95% CI in brackets. The gray diamonds represent the logarithmic effect size adjusted for the U or M models. Cameron 1998 = Cameron et al. (1998); Chapinal 2011 = Chapinal et al. (2011); Duffield 2009 = Duffield et al. (2009); Geishauser 1997a and 1997b = Geishauser et al. (1997a) and (1997b); Leblanc 2005 = LeBlanc et al. (2005); McArt 2012 = McArt et al. (2013); Ospina 2010 = Ospina et al. (2010c); Seifi 2011 = Seifi et al. (2011); Suthar 2013 = Suthar et al. (2013). Journal of Dairy Science Vol. 97 No. 12, 2014
7554
Journal of Dairy Science Vol. 97 No. 12, 2014
Table 4. Risk of clinical ketosis, early culling, and puerperal metritis in cases of subclinical ketosis obtained via meta-analysis Descriptive statistics2 1
Item
1
BHBA NEFA
BHBA NEFA
m
SD
16
8.90
7.54
12 4
9.90 6.1
8.32 3.95
5 11
4.25 6.40
11.7 2.80
13 3
10.10 3.90
7.91 1.82
10
2.34
1.03
2 8
1.55 2.50
0.34 1.08
6 4
2.74 1.73
1.17 0.29
12
3.40
4.30
6 6
1.91 4.90
0.36 5.94
Estimate (SE)
Risk
95% CI
10.8 0.63
8.50–13.88 0.46–0.86
10.13
8.66–11.85
0.28 5.17 2.64
0.19–0.40 4.26–6.26 1.99–3.51
11.21
9.51–13.21
0.27
0.20–0.38
0.29 (0.03)*** Reference 0.41 (0.07)*** 0.77 (0.03)*** Reference −0.44 (0.10)***
1.33
1.25–1.42
1.51 2.15
1.30–1.74 2.03–2.29
0.64
0.53–0.77
0.57 (0.07)*** Reference 0.21 (0.09)*
1.76
1.54–2.01
1.23
1.03–1.47
2.39 (0.12)*** −0.45 (0.15)** Reference 2.31 (0.08)*** Reference −1.27 (0.18)*** 1.63 (0.10)*** 0.97 (0.14)*** Reference 2.41 (0.08)*** Reference −1.28 (0.16)***
Random-effects meta-regression Estimate (SE)
Risk
95% CI
1.93 (0.18)
6.95
4.88–9.88
5.38 1.40
3.27–8.83 0.94–2.10
8.01
4.80–13.36
0.37
0.15–0.91
0.66 (0.09)*** 0.41 (0.17)* Reference 0.39 (0.22)†
1.92 1.50
1.60–2.30 1.07–2.10
1.47
0.95–2.27
0.65 (0.05)*** 0.56 (0.07)*** Reference 0.21 (0.09)*
1.91 1.75
1.75–2.10 1.54–2.01
1.23
1.04–1.46
1.68 (0.26)*** 0.34 (0.21)† Reference 2.08 (0.26)** Reference −0.98 (0.46)*
SCKDIAG1 = class of subclinical ketosis definition; SCKNEFABHBA = test (NEFA or BHBA) used to define subclinical ketosis; U = univariable models; M = multivariable models; OR = odds ratio; RR = relative risk; P1 and P2 refer to metritis and (or) placental retention and (or) milk fever and (or) hypocalcemia. 2 n = number; m = mean. †P < 0.01; *P < 0.05; **P < 0.001; †P < 0.0001.
RABOISSON ET AL.
Clinical ketosis No moderator Intercept SCKDIAG1 = 1 SCKDIAG1 = 2 Intercept SCKNEFABHBA = SCKNEFABHBA = Intercept U/M = U U/M = M Intercept OR/RR = OR OR/RR = RR Culling No moderator Intercept SCKNEFABHBA = SCKNEFABHBA = Intercept P2 = 1 (yes) P2 = 2 (no) Metritis No moderator Intercept P1 = 1 (yes) P1 = 0 (no)
n
Fixed-effects meta-regression
7555
SUBCLINICAL KETOSIS IN DAIRY COWS
Figure 2. Forest graph for clinical ketosis. Adjustments were made for the moderator “multivariable models.” The column on the left refers to univariable (U) or multivariable (M) models. The column on the right refers to the logarithmic-scale observed outcomes [odds ratio (OR) or relative risk (RR)] and their relative 95% CI in brackets. The gray diamonds represent the logarithmic effect size adjusted for U or M models. Duffield 2009 = Duffield et al. (2009); Ospina 2010 = Ospina et al. (2010c); Seifi 2011 = Seifi et al. (2011); Suthar 2013 = Suthar et al. (2013); Dohoo 1984 = Dohoo and Martin (1984).
Figure 3. Forest graph for early culling. No adjustments were made. The column on the right refers to the logarithmic-scale observed outcomes [odds ratio (OR) or relative risk (RR)] and their relative 95% CI in brackets. Seifi 2011 = Seifi et al. (2011); Roberts 2012 = Roberts et al. (2012); McArt 2013 = McArt et al, (2013).
0.424 (SE = 0.120; P < 0.001), which corresponded to an effect size of 1.52 (1.20–1.93). Mastitis and Lameness
during this period (1.0 mM; Oetzel, 2004). The heterogeneity of the data set was low [I2 = 5% (0–93) and Q statistics χ2 = 12.4, df = 11; P = 0.33; Figure 3]. The intercept of the logarithmic effect size in the randomeffects regression with no moderator was 0.652 (SE = 0.046; P < 0.001), which corresponded to an effect size of 1.94 (1.75–2.10). Including the moderators P1 or P3 reduced the heterogeneity by only 5% (Table 4; Figure 4). Similar results were obtained when the moderators P1 or P3 were included. The coefficients were not sensitive to the exclusion of the extreme value. In summary, the present work shows the need to retain the risk (95% CI) of metritis in cows with SCK adjusted for the moderator P1, which is 1.75 (1.54–2.01). The association between SCK and placental retention was reported in 3 models from 3 studies (Supplemental Table S5; http://dx.doi.org/10.3168/jds.2014-8237). One of the results was not significant. The mean raw risk of placental retention in the case of SCK was 1.60 (0.33). The heterogeneity of the data set was low [I2 = 35% (0–97)]. The intercept of the logarithmic effect size in the random-effect regression with no moderator was
The associations between SCK and clinical mastitis or a high SCC were reported in 4 models (Supplemental Table S6; http://dx.doi.org/10.3168/jds.2014-8237). The mean OR (±SD) for clinical mastitis in cows with SCK was 1.64 ± 0.2 for the 2 significant univariable models. The mean risk (±SD) of a high SCC in cows with SCK was 1.46 ± 0.2. This value lacked precision because various SCC thresholds (250,000 or 400,000 cells/mL), various definitions of SCK (blood and milk), various exclusion criteria [e.g., cows with >200,000 cells/mL on the first test (van Straten et al., 2009)], and various definitions of high SCC (number of SCC controls greater or lower than the SCC threshold) were used in these publications. One publication was excluded because the results were not expressed relative to a SCC threshold (Al-Rawashdeh, 1999). The heterogeneity was null for both clinical mastitis and SCC, in part because of the small number of results. The intercepts of the logarithmic effect size in the random-effects regression with no moderator were 0.477 (SE = 0.133; P < 0.001) for clinical mastitis and 0.353 (SE = 0.062; P < 0.001) for high SCC, which corresponded to effect Journal of Dairy Science Vol. 97 No. 12, 2014
7556
RABOISSON ET AL.
Figure 4. Forest graph for metritis. Adjustments were made for the moderator P1 [metritis, placental retention, milk fever, and (or) hypocalcemia taken into account]. The column on the left indicates whether P1 was included (P1 = 1 or 0, respectively). The column on the right refers to the logarithmic-scale observed outcomes [odds ratio (OR) or relative risk (RR)] and their relative 95% CI in brackets. The gray diamonds represent the logarithmic effect size adjusted for univariable (U) or multivariable (M) models. Duffield 2009 = Duffield et al. (2009); Ospina 2010 = Ospina et al. (2010c); Suthar 2013 = Suthar et al. (2013); Chapinal 2011 = Chapinal et al. (2011); Dubuc 2010 = Dubuc et al. (2010).
sizes of 1.61 (1.24–2.09) for clinical mastitis and 1.42 (1.26–1.60) for high SCC. The OR for lameness in cows with SCK was higher in the multivariable models than in the univariable models (Supplemental Table S6; http://dx.doi. org/10.3168/jds.2014-8237) and it increased with an increasing BHBA threshold value for the multivariable models. The mean OR (±SD) for lameness in cows with hyperketonemia was 2.0 ± 0.2. The heterogeneity was null. The intercept of the logarithmic effect size in the random-effects regression with no moderator was 0.696 (SE = 0.101; P < 0.001), which corresponded to an effect size of 2.01 (1.64–2.44). Milk Production
The association between SCK and changes in milk production was reported in 13 models from 4 studies (Table 5). Because of data scarcity, only a review was performed; no meta-analysis could be performed on this association. Moreover, 1 additional study that reported an association at the herd level was also included Journal of Dairy Science Vol. 97 No. 12, 2014
(Ospina et al., 2010a). All but 2 of the studies focused on the 305-d corrected milk production projected at the third milk test or 120 DIM. The other 2 studies reported the mean daily milk production for the first 30 d or for an unspecified duration and were, therefore, excluded from the analysis (Dohoo and Martin, 1984; McArt et al., 2013). The association between milk production and SCK was ambiguous, with both positive and negative associations reported. First, the association was often negative when SCK was diagnosed during early lactation. Indeed, a negative association was obtained when SCK was diagnosed prepartum and a negative or positive association was obtained when SCK was diagnosed postpartum, depending on the parity of the cows (Ospina et al., 2010a,b). Moreover, in another study, the association was negative or positive when SCK was diagnosed during wk 1 or 2 postpartum, respectively (Duffield et al., 2009). Such an indeterminate association was most likely linked to the fact that cows with moderate SCK are able to produce more milk than cows without SCK (Duffield et al., 2009). Thus, the association between milk production and SCK depended on when the SCK was diagnosed. Because the present work focused on the effects of SCK on performance, only results associated with early detection of SCK were considered, and results obtained when SCK was diagnosed during wk 2 were not considered further. Second, the link between milk production and SCK depended on parity, as at least 2 studies suggested (Ospina et al., 2010a,b). The association was positive for primiparous cows and negative for multiparous cows in 1 publication. Because the aim of the present work was to obtain information for an average cow, standardization was undertaken for all parities, with weights of one-third and two-thirds assigned to primiparous and multiparous cows, respectively. Thus, the postpartum data reported by Ospina et al. (2010c) and data reported by Ospina et al. (2010a) are summarized in Table 5. Finally, the direct and indirect 305-d milk loss (mean ± SD) associated with SCK was 340 ± 48 kg of milk. This estimation must be adjusted for the bias that resulted from SCK being linked with diseases associated with lower milk production. Indeed, none of the retained models that evaluated the milk outcome adjusted for covariates that represent common peripartum diseases. Nonetheless, these diseases are known to induce losses in milk production (Fourichon et al., 1999; Seegers et al., 2003). To adjust for these covariates, the milk losses associated with each of these covariates were calculated for an average 305-d lactation. The mean (±SD) 305-d milk losses for cows with low (300 ± 31) and high (406 ± 39) abomasal displacement scenarios, clinical ketosis low (86 ± 7) and high (159
Table 5. Models included in the review of the relationship between subclinical ketosis and milk production1 Diagnosis of SCK No. of cows 1,183 449 449 658 658 997
1,433 1,672 650 1,022 650 1,022
12,200
All
L1 L1 L >1 L >1 7,000 to 10,000 All
35.0 7,100 7,100 12,500
All All All All All All All All L1 L >1 L1 L >1
16
Week (no.) of detection5
Value (kg)
SE
P-value Definition6
NEFA: 0.33
−2 to −1 (1)
−683
180
<0.001
NEFA: 0.57 BHBA: 0.9 NEFA: 0.72 BHBA: 1.0 BHBA: 1.4
+1 +1 +1 +1 +1
to +2 to +2 to +2 to +2 (1)
488 403 −647 −393 −126
203 195 195 195 NA9
0.02 0.4 0.001 0.04 0.33
BHBA: BHBA: BHBA: BHBA:
(1) (1) (1) and +2 (6) and +2 (3) to +4 (1)
−333 272 236 −1.2 −2.1 −1.0311
NA 0.04 NA 0.008 NA 0.06 NA 0.006 NA 0.04 NA <0.05
to to to to to to
−1.4012 −282 −288 −593 −534 −358
NA 91 159 107 141 99
12 24 16 43 43 12
1.8 1.2 1.4 1.2 to 2.9
BHBA milk
+1 +2 +2 +1 +1 +1
5 >1513 >1513 >1513 >2013 >1513
BHBA milk NEFA: 0.27 NEFA: 0.6 NEFA: 0.7 BHBA: 1.2 BHBA: 1.0
+1 −2 +1 +1 +1 +1
(1) (1) (1) (1)
+4 (1) −1 +2 +2 +2 +2
<0.05 <0.001 <0.001 <0.001 <0.001 <0.001
ME 305-d production calculated at 120 DIM
Parity P-value Kept4 +
Ospina et al. (2010b)
>0.05 >0.05 >0.05 >0.05 T10
+7 +8 +7 +8 +
Duffield et al. (2009)
T T T Daily milk (0–30 DIM) >0.05 >0.05 Daily milk (DIM?) NA
+
305-d production calculated at third test
ME 305-d production
0.001
Reference
NA NA NA NA NA NA
McArt et al. (2013) Dohoo and Martin (1984) + +14 +15 +14 +15
Ospina et al. (2010a)
Other covariates included monensin treatment and season: tested (Duffield et al., 2009); season and BCS at sampling: P > 0.05, but kept in the model (Ospina et al., 2010b); herd size: P > 0.05, but kept in the model (Ospina et al., 2010a). 2 L1 = primiparous; L >1 = multiparous. 3 Prev= prevalence; SCK = subclinical ketosis. 4 Kept in the final estimation in the review. 5 Peripartum week of detection (and number of detections). 6 ME = mature equivalent. 7,8 For the same number, data were gathered with a weight of one-third for L1 and two-thirds for L >1 for the mean calculation in the review. 9 NA = not available. 10 T = tested but P > 0.05 and then removed from the model. 11 Corresponds to −4.4%. 12 Corresponds to −6.0%. 13 The association between SCK and milk production was analyzed at the herd level: the herd was considered to be affected with SCK if the percentage of cows above the BHBA or NEFA threshold was above 15 or 20%. 14,15 For the same number, data were gathered with a weight of one-third for L1 and two-thirds for L >1 for the mean calculation in the review.
1
SUBCLINICAL KETOSIS IN DAIRY COWS
997 997 997 1,115 1,115 1,433
Average milk Prev of Test: threshold production (kg) Parity2 SCK3 (%) (mM)
Difference in milk production if SCK
7557
Journal of Dairy Science Vol. 97 No. 12, 2014
7558
RABOISSON ET AL.
± 12) scenarios, metritis (100 ± 7), placental retention low (0 ± 0) and high (206 ± 10) scenarios, and clinical mastitis (5% of the milk production) were calculated in a previous review (Fourichon et al., 1999; Seegers et al., 2003). A recent study reported milk losses of 259 and 753 kg in cows with metritis and placental retention, respectively (Dubuc et al., 2011); however, these values were not used because the results were only significant for multiparous cows. The retained risk used to calculate the direct association between SCK and the 305-d milk losses for abomasal displacement (3.33), clinical ketosis (5.38), metritis (1.75), placental retention (1.52), clinical mastitis (1.61), and high SCC (1.42) were the results of the previous part of the current study. A previous study reported that a 2-fold increase in SCC (>50,000 cells/mL) resulted in a loss of 106 kg (1.55%) of milk from an individual cow (Hortet and Seegers, 1998). Accounting for the European policies related to SCC and the definitions of OR/RR (Supplemental Table S6; http://dx.doi.org/10.3168/ jds.2014-8237), the mean 305-d milk loss was 106 kg for an SCC increase from 200,000 to 400,000 cells/mL. The milk loss incurred in lame cows was defined as the mean of the values reported in various published studies, although case definitions, basal milk production level, and the prevalence of lameness differed among these studies (Green et al., 2002; Hernandez et al., 2002, 2005; Amory et al., 2008; Bicalho et al., 2008; Archer et al., 2010; Singh et al., 2011). An average (±SD) decrease in the 305-d milk yield of 475 (±316) kg of milk (5.7%) was retained. The corresponding risk was 2.01. Because the risk of these diseases in cases of SCK and the mean milk losses in cases of these diseases was known, it was possible to calculate the quantity of milk lost because of diseases linked to SCK. Then, the direct and indirect (unadjusted for diseases) mean (±SD) 305-d milk losses associated with SCK (340 ± 48 kg of milk) can be adjusted for these diseases. The final results show that, after adjusting for all of these peripartum diseases, the direct average milk loss (SD) related to SCK was 112 (89) kg, or 251 (73) kg if adjustments were made for abomasal displacement, clinical ketosis, metritis, and placental retention only. Reproductive Performance
The association between SCK and reproductive performance was evaluated using the first service calving risk (FSCR; 5 models), the calving-to-first-service interval (CFSI; 2 models), and the calving-to-conception interval (CCI; 3 models). Only 3 studies were included (Supplemental Table S7; http://dx.doi.org/10.3168/ jds.2014-8237). None of the results from any of the Journal of Dairy Science Vol. 97 No. 12, 2014
studies with 6 time detections (McArt et al., 2013) were significant. The mean (±SD) FSCR obtained from the 3 significant models in cows with SCK was 0.60 ± 0.16. The intercept (SE) of the logarithmic effect size in the random model without moderators was −0.310 (0.110; P < 0.01), which corresponded to an effect size of 0.73 (0.59–0.91). The heterogeneity was high [I2 = 63% (0–96)] but it decreased [I2 = 32% (0–95)] when only the 4 models produced by Walsh et al. (2007) were retained; the intercept (SE) of the logarithmic effect size decreased to −0.400 (0.112; P < 0.001), which corresponded to an effect size of 0.67 (0.53–0.83). The HR for the CFSI in cows with SCK was only significant [HR = 0.85 (0.74–0.99)] when the SCK was diagnosed during wk 1 or 2 (P > 0.05 if wk 1 and 2). The risk value corresponded to a CFSI that was prolonged by 8 d (Walsh et al., 2007). The HR for the CCI in cows with SCK reported in 2 models were 0.03 (0.01–0.20) and 0.09 (0.02–0.30) for 2 models (resulting in interval prolonged by 22 and 16 d, respectively) and between 0.81 and 0.90 for others (P < 0.05 for 1 of 4 models). The heterogeneity of the meta-regression was very high (I2 = 100%). This value was mainly attributable to the paper by Walsh et al. (2007). For all 3 of the studied outcomes (FSCR, CFSI, or CCI), most of the covariates known to affect reproduction efficiency seemed to be included in the models; therefore, the obtained risk should have represented the direct association between reproductive performance and SCK. However, it remains unclear which covariates were significant and were included, which were not significant and forced, and which were not significant and excluded from the final multivariable models reported in the literature. Recently, the association between SCK and subclinical endometritis was reported to be independent of the incidences of placental retention and puerperal metritis (Dubuc et al., 2010). The reported OR for subclinical endometritis in cows with SCK was 1.4 (1.1–1.8) and 1.4 (1.1–2.0) for the univariable and multivariable models, respectively (Supplemental Table S7; http://dx.doi. org/10.3168/jds.2014-8237). This suggests that the results obtained using the multivariable model should be retained. In contrast, SCK and purulent vaginal discharge were not directly related (Dubuc et al., 2010). In a multivariable model, purulent vaginal discharge was explained by SCK when metritis was not included in the model [OR = 1.36 (1.01–1.83)]; however, the inclusion of metritis in the model resulted in a nonsignificant association between purulent vaginal discharge and SCK (Supplemental Table S7). The reported OR for purulent vaginal discharge in cows with metritis was 2.3 (1.4–3.7).
7559 FSCR = first-service calving risk; CFSI = calving-to-first-service interval; CCI = calving-to-conception interval. MOD = moderator; Prev = prevalence. 3 OR = odds ratio; HR = hazard ratio; SCK = subclinical ketosis. 4 U= univariable model; M = multivariable model; P1 to P8: moderators used in the meta-regression; P1, P2, and P3 refer to metritis and (or) placental retention and (or) milk fever and (or) hypocalcemia; P4 refers to milk fever or hypocalcemia; P6 refers to twins and (or) dystocia; P8 refers to milk production; P1 to P8 were categorical moderators with 2 or 3 classes. 5 SCE = subclinical endometritis; PVD = purulent vaginal discharge. 6 NA = not available. 2
1
1 0 0 2 2 0 2 1 0 0 1 1 0 1 1 0 0 1 0 0 0 1 0 0 1 1 0 1 0 0 0 0 0 0 0 1 0 0 1 1 0 1 M U M M M U M 0.40–0.93 0.34–0.81 0.49–0.99 0.49–0.94 0.79–0.92 0.64–0.84 0.65–0.83 OR OR OR HR HR HR HR 0.61 0.52 0.69 0.68 0.85 0.73 0.74 26 26 17 26 NA6 17 NA SCE SCE PVD SCE SCE PVD PVD NA NA 38% 116 d 135 d 119 d 134 d FSCR FSCR FSCR CFSI CCI CCI CCI
779 779 1,600 779 2,134 1,811 2,134
P6 P4 P3 P2 95% CI Risk Value Prev Mod5 No. of cows Mean value Outcome1
OR or HR (95% CI) for disease in cases of SCK3 Explanatory2
Table 6. Models included in the meta-analysis for reproductive performances
The present work used the OR or RR (and sometimes the HR) for most of the outcomes. The logistic regression model, which directly estimates the OR adjusted for the effect of covariates, is a popular tool used to assess the risk of exposure to a certain factor. However, the interpretation of the OR is not always straightforward and OR are often interpreted as RR. The RR is generally preferred over the OR because the OR can overestimate the RR. In the present work, the raw data illustrated that RR < OR for a given outcome. Odds ratios are often used because of issues related to the convergence of models when calculating the RR by binomial regression. Recently, the Poisson regression with robust error variance has been used to efficiently calculate RR. For this reason, no real justification exists for relying on logistic regression when the RR is the parameter of primary interest (Zou, 2004). The preferential use of Poisson regression was recently highlighted by Ospina et al. (2012). In the present work, the difference between the OR and RR generally remained low. Such differences are negligible when the probability of the outcome is low and when the baseline risk for each subgroup is relatively constant (Zou, 2004). These criteria were met in the present work for abomasal displacement, clinical ketosis, early culling, metritis, and placental retention, which all had a low prevalence. This finding was also in accordance with the nonsignificant association between SCK and the moderator OR/RR (except in the case of clinical ketosis). The significant association between clinical ketosis and the explanatory variable OR/RR obtained in meta-regression must be interpreted with care because
U/M
DISCUSSION
P1
Uni- or multivariable model and covariate4 included
P8
Reference
Because of the complex relationship between SCK and reproductive diseases or performance, the associations between subclinical endometritis or purulent vaginal discharge and the FSCR, CFSI, and CCI were investigated (Table 6). However, only 7 models from 3 studies described all of these relationships. Most of the models were adjusted for a variety of different covariates, including milk production, placental retention, and metritis. The mean OR for FSCR in cows with subclinical endometritis (2 models) or purulent vaginal discharge (1 model) were 0.59 (0.34–0.83) and 0.69 (0.49–0.99), respectively. The mean HR for the CFSI and CCI in cows with subclinical endometritis were 0.68 (0.49–0.94) and 0.85 (0.79–0.92), respectively. They corresponded to prolongations in the respective intervals of an additional 26 and 32 d. The mean HR for the CCI when purulent vaginal discharge were 0.73 (0.64–0.84) and 0.74 (0.65–0.83), depending on the study (intervals prolonged by 32 and 48 d, respectively).
Cheong et al. (2011) Cheong et al. (2011) LeBlanc et al. (2002a) Cheong et al. (2011) Dubuc et al. (2012) LeBlanc et al. (2002a) Dubuc et al. (2012)
SUBCLINICAL KETOSIS IN DAIRY COWS
Journal of Dairy Science Vol. 97 No. 12, 2014
7560
RABOISSON ET AL.
all but 3 results (1 paper) presented OR. Altogether, this univariable regression might have hidden another correlated variable, and the interchangeable use of OR or RR (i.e., risk) in the present paper appeared appropriate. The definition of SCK is based on high NEFA or high BHBA concentration. At present, NEFA and BHBA concentrations are commonly and consensually used to evaluate NEB and SCK; however, readers must keep in mind that these both indicators have limits for evaluating NEB and SCK. For instance, cows may have high BHBA and NEFA concentrations that originate from their diet, or they may have simultaneously high BHBA and low NEFA concentrations (Doreau et al., 2001; Kessel et al., 2008; Moyes et al., 2013). The risk of SCK increased (or decreased if risk <1) when higher thresholds (NEFA or BHBA concentration) were used to define SCK. It is quite logical that animals with high levels of ketones would be more ill than animals with moderate or low levels of ketones, as observed in most studies in which several thresholds values were used (Walsh et al., 2007; Duffield et al., 2009; Suthar et al., 2013). This supposition was also in accordance with the negative coefficient of SCKDIAG_ class = 1 relative to the reference (SCKDIAG_class = 2) for abomasal displacement and clinical ketosis (fixedeffects models; Tables 3 and 4), despite the lack of significance with the mixed-effects model. It is surprising that the adjusted risks obtained with the moderator SCKDIAG were not significant for the other outcomes and were only significant for abomasal displacement and clinical ketosis in the fixed-effects model. The raw data and the results of the present work suggest that a threshold of 1.4 mM for BHBA is appropriate because the thresholds of the models whose results had the lowest P-value were most often between 1.0 and 1.4 mM. However, the meta-regression demonstrated that using a value of 1.0 mM instead of 1.4 mM influenced the value of the risk, at least for abomasal displacement. In other words, using 1.0, 1.2, or 1.4 mM interchangeably as a BHBA threshold could result in important over- or underdiagnoses. Although postpartum BHBA values have been used as a recognized gold standard for diagnosing SCK and SCK, NEFA values also appear to be a useful tool. The metabolite NEFA is commonly used prepartum (Oetzel, 2004). However, several studies have shown that using postpartum NEFA concentrations resulted in a greater risk than using prepartum NEFA and postpartum BHBA concentrations (Cameron et al., 1998; LeBlanc et al., 2005; Ospina et al., 2010c). Other variables included in the meta-analysis are also of great interest for the purpose of adjusting the OR/RR. The effects of using a NEFA test instead of a BHBA test were significant for clinical ketosis and Journal of Dairy Science Vol. 97 No. 12, 2014
abomasal displacement (fixed-effects meta-regression only) and for early culling. Although NEFA is sometimes used during the postpartum period, the moderator SCKBHBANEFA tests could, in fact, represent prepartum and postpartum sampling periods, respectively. The opposite positive or negative NEFA coefficient, depending on the outcome remained unexplained. As expected, the coefficient for the moderator U/M = U was positive (with the multivariable model as the reference) when significant, suggesting that the risks were overestimated if the raw mean value reported in the literature was retained or if univariable models were retained. This finding was in agreement with the positive estimates obtained for P1, P2, and P4 for abomasal displacement and P1 for metritis because these results were similar to U/M = U [the reference is “other variables were taken into account and (or) significant in the model reported in the literature”]. The opposite result obtained for P2 for culling was likely related to the bias associated with collinearity with the moderator test (which led to the rejection of these results). The results of the meta-regression showed a moderateto-high adjustment of the risk and thus highlight the usefulness of such an analysis. The 2 main categories of moderators that were expected to explain risk in the meta-regression were shown to be of great importance through their effect on the adjusted risk. Namely, the correction caused by the moderator SCKDIAG corrected for the underestimation of the risk, whereas the correction caused by the multivariable terms (moderators U/M or P1 to P4) adjusted for the overestimation of the risk. More variables than those obtained in the present study were expected to be significant, and more important adjustments of the risk were expected. The first possible reason for these results was the scarcity of literature for most of the studied outcomes, particularly when fewer than 10 results were available for a given outcome. This lack is further highlighted by the dearth of significance for clinical ketosis, culling, and metritis (Table 4) obtained in meta-regression relative to abomasal displacement. The second reason was the variety of methods by which SCK was diagnosed in published studies. Most of the studies included only 1 sampling per cow or 1 prepartum and 1 postpartum sampling per cow. Recently, the median time that elapsed between a BHBA level >1.2 mM and a BHBA value <1.2 mM was reported to be 5 d (McArt et al., 2013). This shows that isolated samplings, even weekly or biweekly sampling, might underestimate the prevalence of SCK and the calculated risk, because some positive cows may be sampled before or after they had high BHBA. Indeed, the estimated risks referred to risks of disease (or changes in other outcomes) for cows
SUBCLINICAL KETOSIS IN DAIRY COWS
with SCK compared with cows without SCK and with a fraction of cows with SCK. Despite adjustments made in the present work for (1) the number of detections and (2) the definition of SCK (through SCKDIAG), the risks most likely remained underestimated because not all of the cows with SCK were identified in the studied papers. It would have been more appropriate to use the studies with several detections (McArt et al., 2013) as references. However, adjusting the results that were obtained with only 1 detection would have been difficult. Moreover, the diagnosis of SCK was almost never made using more than one sampling per cow in the field. The third reason for the lack of many significant metaregression models might have been the variability in the definitions of covariates. The covariates used in the meta-regression (namely P1 to P7) were well-defined and relatively homogeneous because most of the papers included in the present work used the definition provided by LeBlanc et al. (2002b). In contrast, other variables were excluded from the meta-regression. The variables of parity, treatment with monensin, season, and BCS were often included as covariates of the models from the literature. However, these variables often remained nonsignificant. When significant, the values of the coefficients were not always reported. Moreover, the definition of these variables was sometimes imprecise or differed among studies. For instance, the variable BCS referred to BCS at sampling and not to the BCS change around parturition. Consequently, these variables were not retained as moderators in the current meta-analysis. Similarly, the duration during which disease was considered differed among studies, which might have contributed to the variability in the raw data used in the present work. The present meta-regression was performed as recommended (Viechtbauer, 2010; Kovalchik, 2013). The intercept obtained in the random-effects model with no moderator was more precise than the raw mean of risk because the lowest variance the raw value, the highest weight in the meta-regression. The final meta-regression (and relative adjusted risk) that was retained was judged on the reduction of the heterogeneity relative to the regression without moderator. For metritis, because I2 was low, including a moderator in the meta-regression induced only a slight change in the value of the intercept. As recommended by Kovalchik (2013), both the fixed-effects and mixed-effects models were reported in the present work. The fixed-effects meta-regression is a description of the k studies, and the random or mixed-effects meta-regression regards the k studies as a sample of a larger universe of studies. In the case of homogeneous effect size (such as that observed for metritis) and subsequent very low heterogeneity, the distinction between the fixed- and mixed-effects models
7561
disappeared. Such an occurrence was also observed for abomasal displacement (moderator SCKDIAG and U/M) and clinical ketosis (moderator U/M). In the present work, all associations from models that were included in the meta-regression progressed in the same direction (positive or negative), even if they were not significant. Because of this lack of conflicting data, the number of trials with opposing results that was needed to reverse the conclusion of the meta-regression (i.e., the failsafe number) was not evaluated. When the available data were scarce for a given outcome, a review, rather than a meta-analysis, was performed. The scarcity of data on the relationship between SCK and SCC, clinical mastitis, or lameness was remarkable. Similarly, few studies quantified the relationship between SCK and reproductive performance, even if the association was based on consensus. High NEFA or BHBA concentrations were reported to induce immune dysfunction, which, in turn, is a major component of inflammatory disease in the reproductive tract (LeBlanc et al., 2011; LeBlanc, 2012). Moreover, nutrition and NEB in particular are considered crucial for reproductive efficiency (Ferguson, 2005; Melendez and Risco, 2005). The association between milk production and SCK was ambiguous, with opposing associations observed for primiparous and multiparous cows and when ketones were sampled in wk 1 or 2. Detailed discussions are available in the relevant studies (Duffield et al., 2009; Ospina et al., 2010b). In brief, certain authors reported that the particular physiological circumstances that heifers experience in early lactation were responsible for the positive association between SCK and milk production that is sometimes found for primiparous cows (Ospina et al., 2010c). However, this association was not observed at the herd level (Ospina et al., 2010a). Moreover, low BHBA and NEFA thresholds were used when positive associations were observed, suggesting that high-producing cows might have had higher blood ketone levels early in lactation than low-producing cows did and, therefore, experienced only a moderate increase in ketone concentration (Table 5). The positive association between SCK and milk production that was observed when samples were taken in wk 2 postpartum (Duffield et al., 2009) is in agreement with the observation that cows that develop SCK within the first week postpartum had a lower milk production than those that developed SCK after the first week of lactation (McArt et al., 2013). The difficulties in analyzing the association between milk production and SCK can be summarized as follows: the higher the ketone concentrations are during early lactation, the greater the milk losses will be, but the greater the cow’s production is, the greater risk she has of succumbing to ketosis. Importantly, most of these results Journal of Dairy Science Vol. 97 No. 12, 2014
7562
RABOISSON ET AL.
did account for covariates, namely peripartum diseases that are known to interact with milk production. The current work proposed an adjusted estimation. CONCLUSIONS
The present meta-analysis showed that adjustments made for various moderators resulted in substantial changes in the risk of various outcomes. The risk (95% CI) of abomasal displacement was 3.33 (2.60–4.25); the risk was 5.38 (3.27–8.83) for clinical ketosis, 1.92 (1.60–2.30) for early culling and death, 1.75 (1.54–2.01) for metritis, and 1.52 (1.20–1.93) for placental retention. These estimations had high-to-moderate levels of precision. For mastitis, high SCC, and lameness, a low degree of precision is suspected because few studies on these outcomes were available. The present estimations showed that the RR or OR of clinical mastitis, lameness and a doubling of the SCC in cows with SCK was equal to 1.61 (1.24–2.09), 2.01 (1.64–2.44), and 1.42 (1.26–1.60), respectively. The direct and indirect mean ± standard deviation 305-d milk losses associated with SCK amounted to of 340 ± 48 kg of milk. Losses of 251 ± 73 kg were obtained when adjustments were made for abomasal displacement, clinical ketosis, metritis, and placental retention. The losses were 112 ± 89 kg when all of the peripartum diseases were considered. Until now, the association between reproductive performance and SCK has not been extensively studied; therefore, the precision of the proposed results regarding reproductive performance must be considered low. The OR for FSCR in cows with SCK was 0.67 (0.53–0.83). Cows with SCK had a CFSI and CCI that were 8 and 16 to 22 d long, respectively. Most of the relationships between different reproductive indicators were quantified in only 1 or 2 studies. The present work suggests that further studies on the associations between SCK and diseases, changes in milk production, and reproductive performance must be conducted. REFERENCES Al-Rawashdeh, O. F. 1999. Prevalence of ketonemia and associations with herd size, lactation stage, parity, and postparturient diseases in Jordanian dairy cattle. Prev. Vet. Med. 40:117–125. http:// dx.doi.org/10.1016/S0167-5877(99)00017-3. Amory, J. R., Z. E. Barker, J. L. Wright, S. A. Mason, R. W. Blowey, and L. E. Green. 2008. Associations between sole ulcer, white line disease and digital dermatitis and the milk yield of 1824 dairy cows on 30 dairy cow farms in England and Wales from February 2003–November 2004. Prev. Vet. Med. 83:381–391. http://dx.doi. org/10.1016/j.prevetmed.2007.09.007. Andersson, L. 1988. Subclinical ketosis in dairy cows. Vet. Clin. North Am. Food Anim. Pract. 4:233–251. Archer, S. C., M. J. Green, and J. N. Huxley. 2010. Association between milk yield and serial locomotion score assessments in UK dairy cows. J. Dairy Sci. 93:4045–4053. http://dx.doi.org/10.3168/ jds.2010-3062. Journal of Dairy Science Vol. 97 No. 12, 2014
Bicalho, R. C., L. D. Warnick, and C. L. Guard. 2008. Strategies to analyze milk losses caused by diseases with potential incidence throughout the lactation: A lameness example. J. Dairy Sci. 91:2653–2661. http://dx.doi.org/10.3168/jds.2007-0744. Cameron, R. E. B., P. B. Dyk, T. H. Herdt, J. B. Kaneene, R. Miller, H. F. Bucholtz, J. S. Liesman, M. J. Vandehaar, and R. S. Emery. 1998. Dry cow diet, management, and energy balance as risk factors for displaced abomasum in high producing dairy herds. J. Dairy Sci. 81:132–139. http://dx.doi.org/10.3168/jds.S00220302(98)75560-2. Chapinal, N., M. Carson, T. F. Duffield, M. Capel, S. Godden, M. Overton, J. E. Santos, and S. J. LeBlanc. 2011. The association of serum metabolites with clinical disease during the transition period. J. Dairy Sci. 94:4897–4903. http://dx.doi.org/10.3168/ jds.2010-4075. Cheong, S. H., D. V. Nydam, K. N. Galvão, B. M. Crosier, and R. O. Gilbert. 2011. Cow-level and herd-level risk factors for subclinical endometritis in lactating Holstein cows. J. Dairy Sci. 94:762–770. http://dx.doi.org/10.3168/jds.2010-3439. Dohoo, I. R., and S. W. Martin. 1984. Subclinical ketosis: Prevalence and associations with production and disease. Can. J. Comp. Med. 48:1–5. Doll, K., M. Sickinger, and T. Seeger. 2009. New aspects in the pathogenesis of abomasal displacement. Vet. J. 181:90–96. http:// dx.doi.org/10.1016/j.tvjl.2008.01.013. Doreau, M., A. Ollier, and B. Michalet-Doreau. 2001. An atypical case of ruminal fermentations leading to ketosis in early lactating cows. Revue/Méd. Vét. 4:301–306. Dubuc, J., T. F. Duffield, K. E. Leslie, J. S. Walton, and S. J. LeBlanc. 2010. Risk factors for postpartum uterine diseases in dairy cows. J. Dairy Sci. 93:5764–5771. http://dx.doi.org/10.3168/jds.20103429. Dubuc, J., T. F. Duffield, K. E. Leslie, J. S. Walton, and S. J. Leblanc. 2011. Effects of postpartum uterine diseases on milk production and culling in dairy cows. J. Dairy Sci. 94:1339–1346. http:// dx.doi.org/10.3168/jds.2010-3758. Dubuc, J., T. F. Duffield, K. E. Leslie, J. S. Walton, and S. J. LeBlanc. 2012. Risk factors and effects of postpartum anovulation in dairy cows. J. Dairy Sci. 95:1845–1854. http://dx.doi.org/10.3168/ jds.2011-4781. Duffield, T. F., K. D. Lissemore, B. W. McBride, and K. E. Leslie. 2009. Impact of hyperketonemia in early lactation dairy cows on health and production. J. Dairy Sci. 92:571–580. http://dx.doi. org/10.3168/jds.2008-1507. Ferguson, J. D. 2005. Nutrition and reproduction in dairy herds. Vet. Clin. North Am. Food Anim. Pract. 21:325–347. http://dx.doi. org/10.1016/j.cvfa.2005.03.001. Fourichon, C., H. Seegers, N. Bareille, and F. Beaudeau. 1999. Effects of disease on milk production in the dairy cow: A review. Prev. Vet. Med. 41:1–35. http://dx.doi.org/10.1016/S0167-5877(99)00035-5. Geishauser, T., K. Leslie, T. Duffield, and V. Edge. 1997a. Evaluation of aspartate transaminase activity and beta-hydroxybutyrate concentration in blood as tests for prediction of left displaced abomasum in dairy cows. Am. J. Vet. Res. 58:1216–1220. Geishauser, T., K. Leslie, T. Duffield, and V. Edge. 1997b. An evaluation of milk ketone tests for the prediction of left displaced abomasum in dairy cows. J. Dairy Sci. 80:3188–3192. http://dx.doi. org/10.3168/jds.S0022-0302(97)76291-X. Geishauser, T., K. Leslie, T. Duffield, D. Sandals, and V. Edge. 1998. The association between selected metabolic parameters and left abomasal displacement in dairy cows. Zentralbl. Veterinärmed. A 45:499–511. http://dx.doi.org/10.1111/j.1439-0442.1998. tb00853.x. Green, L. E., V. J. Hedges, Y. H. Schukken, R. W. Blowey, and A. J. Packington. 2002. The impact of clinical lameness on the milk yield of dairy cows. J. Dairy Sci. 85:2250–2256. http://dx.doi. org/10.3168/jds.S0022-0302(02)74304-X. Hernandez, J., J. K. Shearer, and D. W. Webb. 2002. Effect of lameness on milk yield in dairy cows. J. Am. Vet. Med. Assoc. 220:640–644. http://dx.doi.org/10.2460/javma.2002.220.640.
SUBCLINICAL KETOSIS IN DAIRY COWS
Hernandez, J. A., E. J. Garbarino, J. K. Shearer, C. A. Risco, and W. W. Thatcher. 2005. Comparison of milk yield in dairy cows with different degrees of lameness. J. Am. Vet. Med. Assoc. 227:1292– 1296. http://dx.doi.org/10.2460/javma.2005.227.1292. Higgins, J. P. T., S. G. Thompson, J. J. Deeks, and D. G. Altman. 2003. Measuring inconsistency in meta-analyses. BMJ 327:557– 560. http://dx.doi.org/10.1136/bmj.327.7414.557. Hortet, P., and H. Seegers. 1998. Calculated milk production losses associated with elevated somatic cell counts in dairy cows: Review and critical discussion. Vet. Res. 29:497–510. Kessel, S., M. Stroehl, H. H. Meyer, S. Hiss, H. Sauerwein, F. J. Schwarz, and R. M. Bruckmaier. 2008. Individual variability in physiological adaptation to metabolic stress during early lactation in dairy cows kept under equal conditions. J. Anim. Sci. 86:2903–2912. http://dx.doi.org/10.2527/jas.2008-1016. Kovalchik, S. 2013. Tutorial on Meta-Analysis in R. R useR! Conference 2013, University of Castilla-La Mancha, Albacete, Spain. Accessed Sep. 29, 2014. www.r-project.org/conferences/useR-2013/. LeBlanc, S. J. 2012. Interactions of metabolism, inflammation, and reproductive tract health in the postpartum period in dairy cattle. Reprod. Domest. Anim. 47:18–30. http://dx.doi.org/10.1111/ j.1439-0531.2012.02109.x. LeBlanc, S. J., T. F. Duffield, K. E. Leslie, K. G. Bateman, G. P. Keefe, J. S. Walton, and W. H. Johnson. 2002a. Defining and diagnosing postpartum clinical endometritis and its impact on reproductive performance in dairy cows. J. Dairy Sci. 85:2223–2236. http://dx.doi.org/10.3168/jds.S0022-0302(02)74302-6. LeBlanc, S. J., T. F. Duffield, K. E. Leslie, K. G. Bateman, J. TenHag, J. S. Walton, and W. H. Johnson. 2002b. The effect of prepartum injection of vitamin E on health in transition dairy cows. J. Dairy Sci. 85:1416–1426. http://dx.doi.org/10.3168/jds.S00220302(02)74209-4. LeBlanc, S. J., K. E. Leslie, and T. F. Duffield. 2005. Metabolic predictors of displaced abomasum in dairy cattle. J. Dairy Sci. 88:159– 170. http://dx.doi.org/10.3168/jds.S0022-0302(05)72674-6. LeBlanc, S. J., T. Osawa, and J. Dubuc. 2011. Reproductive tract defense and disease in postpartum dairy cows. Theriogenology 76:1610–1618. http://dx.doi.org/10.1016/j.theriogenology.2011.07.017. McArt, J. A., D. V. Nydam, and G. R. Oetzel. 2013. Dry period and parturient predictors of early lactation hyperketonemia in dairy cattle. J. Dairy Sci. 96:198–209. http://dx.doi.org/10.3168/ jds.2012-5681. Melendez, P., and C. A. Risco. 2005. Management of transition cows to optimize reproductive efficiency in dairy herds. Vet. Clin. North Am. Food Anim. Pract. 21:485–501. http://dx.doi.org/10.1016/j. cvfa.2005.02.008. Moyes, K. M., T. Larsen, and K. L. Ingvartsen. 2013. Generation of an index for physiological imbalance and its use as a predictor of primary disease in dairy cows during early lactation. J. Dairy Sci. 96:2161–2170. http://dx.doi.org/10.3168/jds.2012-5646. Oetzel, G. R. 2004. Monitoring and testing dairy herds for metabolic disease. Vet. Clin. North Am. Food Anim. Pract. 20:651–674. http://dx.doi.org/10.1016/j.cvfa.2004.06.006. Ospina, P. A., D. V. Nydam, and T. J. DiCiccio. 2012. Technical note: The risk ratio, an alternative to the odds ratio for estimating
7563
the association between multiple risk factors and a dichotomous outcome. J. Dairy Sci. 95:2576–2584. http://dx.doi.org/10.3168/ jds.2011-4515. Ospina, P. A., D. V. Nydam, T. Stokol, and T. R. Overton. 2010a. Association between the proportion of sampled transition cows with increased nonesterified fatty acids and β-hydroxybutyrate and disease incidence, pregnancy rate, and milk production at the herd level. J. Dairy Sci. 93:3595–3601. http://dx.doi.org/10.3168/ jds.2010-3074. Ospina, P. A., D. V. Nydam, T. Stokol, and T. R. Overton. 2010b. Associations of elevated nonesterified fatty acids and β-hydroxybutyrate concentrations with early lactation reproductive performance and milk production in transition dairy cattle in the northeastern United States. J. Dairy Sci. 93:1596–1603. http://dx.doi.org/10.3168/jds.2009-2852. Ospina, P. A., D. V. Nydam, T. Stokol, and T. R. Overton. 2010c. Evaluation of nonesterified fatty acids and β-hydroxybutyrate in transition dairy cattle in the northeastern United States: Critical thresholds for prediction of clinical diseases. J. Dairy Sci. 93:546–554. http://dx.doi.org/10.3168/jds.2009-2277. Roberts, T., N. Chapinal, S. J. Leblanc, D. F. Kelton, J. Dubuc, and T. F. Duffield. 2012. Metabolic parameters in transition cows as indicators for early-lactation culling risk. J. Dairy Sci. 95:3057– 3063. http://dx.doi.org/10.3168/jds.2011-4937. Seegers, H., C. Fourichon, and F. Beaudeau. 2003. Production effects related to mastitis and mastitis economics in dairy cattle herds. Vet. Res. 34:475–491. http://dx.doi.org/10.1051/vetres:2003027. Seifi, H. A., S. J. Leblanc, K. E. Leslie, and T. F. Duffield. 2011. Metabolic predictors of post-partum disease and culling risk in dairy cattle. Vet. J. 188:216–220. http://dx.doi.org/10.1016/j. tvjl.2010.04.007. Singh, Y., S. S. Lathwal, A. K. Chakravarty, A. K. Gupta, T. K. Mohanty, T. V. Raja, R. L. Dangi, and B. K. Roy. 2011. Effect of lameness (hoof disorders) on productivity of Karan Fries crossbred cows. Anim. Sci. J. 82:169–174. http://dx.doi.org/10.1111/ j.1740-0929.2010.00800.x. Suthar, V. S., J. Canelas-Raposo, A. Deniz, and W. Heuwieser. 2013. Prevalence of subclinical ketosis and relationships with postpartum diseases in European dairy cows. J. Dairy Sci. 96:2925–2938. http://dx.doi.org/10.3168/jds.2012-6035. van Straten, M., M. Friger, and N. Y. Shpigel. 2009. Events of elevated somatic cell counts in high-producing dairy cows are associated with daily body weight loss in early lactation. J. Dairy Sci. 92:4386–4394. http://dx.doi.org/10.3168/jds.2009-2204. Viechtbauer, W. 2010. Conducting meta-analyses in R with the metafor package. J. Stat. Softw. 36:1–48. Walsh, R. B., J. S. Walton, D. F. Kelton, S. J. LeBlanc, K. E. Leslie, and T. F. Duffield. 2007. The effect of subclinical ketosis in early lactation on reproductive performance of postpartum dairy cows. J. Dairy Sci. 90:2788–2796. http://dx.doi.org/10.3168/jds.2006560. Zou, G. 2004. A modified poisson regression approach to prospective studies with binary data. Am. J. Epidemiol. 159:702–706. http:// dx.doi.org/10.1093/aje/kwh090.
Journal of Dairy Science Vol. 97 No. 12, 2014