Look for the final version in the Quarterly Journal of Experimental Psychology 2009
Active Involvement, not Illusory Control, increases Risk Taking in a Gambling Game Frédéric Martinez Université de Lyon
Jean-François Bonnefon
Julie Hoskens
CNRS and Université de Toulouse
Université de Toulouse
The research considers the influence of Choice (the possibility for the player to choose a gamble or another) and Involvement (the physical interaction with the gambling device) on risk taking in gambling games, and whether this influence is mediated by illusory control over the outcome of the gamble. Results of a laboratory experiment (n = 100) show that (a) although Choice does increase illusory control, this influence does not translate in increased risk taking, and (b) whilst Involvement does increase risk taking, this effect is not mediated by illusory control. These results are discussed in relation to problem gambling, beliefs in the deployability of personal luck, and arousal approaches to risk taking.
Would you wager less money at the roulette table if the dealer placed your bets for you? Would you spend less money on the slot machine if you could not pull the arm? That is, do Choice and Involvement increase the risks we are willing to take in a gambling game? We define Choice as the possibility for the player to choose a gamble or another, rather than leaving that decision to another person (e.g., the dealer, the bank, another player). We define Involvement as the physical interaction with the gambling device, which triggers the (quasi-)immediate resolution of the gamble (e.g., spinning the wheel, throwing the dice, picking the ball from the urn).1 Choice and Involvement are orthogonal dimensions of the gambling experience, although they have often been counfounded in experimental studies. Remarkably, although the empirical evidence for the effects of Choice and Involvement on risk taking is at best mixed, and at worst flawed, there is a consensus that would these effects exist, they would operate through illusory control. In this article, we question this postulate and show that (a) although Choice does increase illusory control, this influence does not translate in increased risk taking, and (b) although Involvement does increase risk taking, this effect is not mediated by illusory control. We first review the mixed empirical evidence for the links between choice, involvement, illusory
control and risk taking in gambling games, which leads us to consider three potential models. We then report the results of a laboratory experiment testing these three models.
Choice, Involvement, and Illusory Control in Gambling Choice and risk taking Prior data are inconclusive about the effect of Choice on risk taking in gambling games—either because of small samples, of inconsistent results, or because of confounds with Involvement. Dixon (2000) investigated risk taking in a game of roulette as a function of Choice. For each participant (five adult women), sequences of three trials with free choice (participants chose the location on the roulette board where they placed their bets) alternated with sequences of three trials with forced choice (participants gave their chips to the experimenter, who selected the location). Four of the five participants wagered a greater number of chips when they could place their bets themselves. This study hints at an effect of Choice on risk taking, measured by the number of chips wagered; however, the small size of the sample makes it difficult to draw a definitive conclusion, and the Dixon (2000) article does not document the statistical significance of this effect. Using a dice-throwing game, Dunn and Wilson (1990) showed that participants who could choose their target number made larger bets than participants who were randomly assigned their target number. This effect, however, disappeared in higher-stakes games. In a study of computer blackjack,
Frédéric Martinez, GREPS, Université de Lyon, France. JeanFrançois Bonnefon, CLLE (CNRS, UTM, EPHE), Université de Toulouse, France. Julie Hoskens, ECCD (UTM), Université de Toulouse, France. Correspondence concerning this article should be sent to Frédéric Martinez, Groupe de Recherche en Psychologie Sociale, équipe PSECO, Institut de Psychologie, Université de Lyon, 5, Avenue Pierre Mendès-France 69676 BRON, France. E-mail:
[email protected].
1 Note that our notion of (active) Involvement as physical interaction with the gambling device is different from Langer’s (1975) notion of ‘passive’ involvement. Passive involvement basically consists of delaying the gamble, for example by postponing its resolution, or by giving players their lottery numbers in instalments rather than at a single point in time.
1
2
MARTINEZ, BONNEFON, & HOSKENS 2009
Chau and Phillips (1995) awarded or denied 12 participants the ability to choose their dealer, as blackjack players are often found to switch to new tables after a streak of losses. This manipulation did not impact the size of participants’ bets. Gilovich and Douglas (1986) showed that bingo players increased the size of their bets (after a win) when they could make choices during the game—more precisely, when they could choose the numbers on their bingo cards and when they could choose which of five computer keys to press to generate the random number that determined whether any space could be filled on the card. Note that Choice here is confounded with Involvement, because the choice of a computer key entails a physical interaction with the gambling device, which triggers the resolution of the gamble.
Involvement and risk taking Support for the effect of Involvement on risk taking is less equivocal. Previous studies strongly suggest that risk taking increases with active Involvement. From their observations of patrons playing craps in real-world casinos, Davis, Sundahl, and Lesbo (2000) concluded that higher bets were placed on patrons’ own dice rolls than on other patrons’ rolls. Participants in the study of Ladouceur and Mayrand (1987) played a game of roulette where they were either actively or passively involved (either they threw the ball or the dealer did). Risk taking was assessed through a combination of the odds chosen by participants and the raw amount they waged, and was influenced by Involvement. Chau and Phillips (1995) observed that computer blackjack players were likely to wager larger bets when they were playing for themselves (and got to press a key to draw a new card) than when they were betting on other players (and were passive spectators of the resolution of the gamble). Finally, Fernandez-Duque and Wifall (2007) presented participants a game in which they selected cards, one at a time, from a set of 10, after being instructed that nine cards won a dollar each and one lost all the money and ended the game. Some participants played the game (which implied active Involvement with the gambling device), others made their decisions while observing a confederate play the game. Involved participants took more risks (in this case, picked up more cards) than noninvolved participants.
The role of illusory control Whether or not it is real, the effect of Choice and Involvement on risk taking is traditionally considered from the perspective of illusory control. According to Langer (1975), any condition that encourages participants in a game of chance to behave as if they were participating in a game of skill induces an illusion of personal control. Insofar as Choice and Involvement qualify as such conditions, it is expected that they will induce such an illusion, which will manifest itself in an inappropriate perception of one’s chances to win. In turn, this inappropriate perception will translate into increased risk taking. It seems reasonable to accept that Choice induces an illusion of control over the outcome of the game. Participants
who can choose their bets likely maintain the illusion that their betting strategy can influence the outcome of the game. Indeed, all five participants in the study of Dixon, Hayes, and Ebbs (1998) decided to buy the right to choose the location of their bets in a roulette game, rather than betting on random locations. Accordingly, lottery players have a marked preference for choosing their own numbers rather than having them chosen at random (Wohl & Enzle, 2002), especially when they score high on ‘desirability for control’ (Burger, 1991), and have higher expectations of success when they can do so. They also require more compensation to exchange their tickets (Langer, 1975, Exp. 2), even when the exchange ticket has a higher probability of winning (Langer, 1975, Exp. 3). It is not clear, however, that Involvement promotes an illusion of control in gambling games. In particular, participants in the Ladouceur, Mayrand, Dussault, Letarte, and Tremblay (1984) study did not manifest illusory control over the outcome of the game when they could throw the dice themselves instead of watching the dealer do it. Langer (1975, Exp. 4) showed an effect of Involvement on illusory control, but the task was not a gamble, and had all the appearances of a game of skill. Langer and Roth (1975) observed an effect of Involvement on illusory control in a coin-tossing game, but since Choice was not manipulated orthogonally (and was offered to all participants), it is impossible to assess whether Involvement alone was responsible for increased illusory control. This skepticism is reinforced by the results of Wortman (1975): Participants blindly drew (or watched someone else drew) a colored marble from a can to determine which consumer item they won. Drawing the marble caused an illusion of control only when there was foreknowledge of which marble was associated with which prize (i.e., only when Choice was offered to participants as to which prize they were aiming at). Finally, it has not been firmly established that illusory control increases risk taking in gambling games, although illusory control does appear to encourage risk taking in other domains (Horswill & McKenna, 1999). Gambling studies rarely include simultaneous measures of illusory control and risk taking, and when they do (Chau & Phillips, 1995), no causal model is tested. Previous results are thus inconclusive at best. In particular, May, Whelan, Meyers, and Steenbergh (2005) exposed participants in a roulette game to messages aiming at increasing or decreasing illusory control; although messages did influence participants’ level of irrational thinking, no significant difference was observed in gambling behavior.
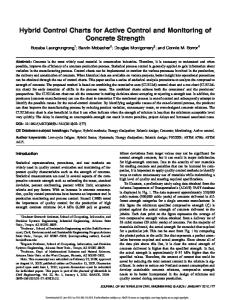
Summary Figure 1 displays the three models that seem the best candidates in light of previous findings. From the data we have reviewed, it seems reasonable to assume that Choice impacts illusory control, and this link is therefore featured in all the models. It also seems reasonable to assume that Involvement impacts risk taking, and this link is featured (directly or indirectly) in all the models. Now, although Choice should have an effect on illusory control, previous data are not clear about
ACTIVE INVOLVEMENT, NOT ILLUSORY CONTROL, INCREASES RISK TAKING IN A GAMBLING GAME
Figure 1. Three theoretical models for the effect of Choice and Involvement in illusory control and risk taking in a gambling game. H-
F-
Choice
Control
Choice
Control
Involvement
Risk
Involvement
Risk
F- Choice Control
Risk
Involvement
3
different payments (2 to 1, 3 to 1, 4 to 1) as a function of the proportion of white balls they contained, in order for any bet on any urn to have an expected value of zero (e.g., a wager of 10 chips on the third urn had an expected value of .25 × 4 × 10 − 10 = 0). Although this calculation was not explicitly shown to participants, each urn was clearly labelled with its proportion of winning balls and its payment, and no participant complained that he or she had not understood the payment scheme. A game turn consisted of (a) choosing an urn to bet on, (b) deciding on the amount of the bet, (c) drawing a ball from the urn, (d) possibly receiving some gains, and (e) putting back the ball in the urn. Participants were informed that a 20 A C voucher would be given (at random) to two of the five players finishing the game with the most chips.
Design whether this effect translates into increased risk taking. And although Involvement should have an effect on risk taking, previous data are not clear about whether this effect is mediated by illusory control. Considering this various possibilities and constraints, we arrive at three potential models. In the Half-mediation model, both Choice and Involvement lead to increased risk taking, but only the effect of Choice is mediated by illusory control. In the Fullseparation model, only Involvement has an (unmediated) effect on risk taking; in this model, Choice promotes illusory control, but this does not translate in increased risk taking. Finally, in the Full-mediation model, both Choice and Involvement lead to increased risk taking, and both effects are mediated by illusory control. To discriminate between these models, we report an experiment where we independently manipulated Choice and Involvement, included several measures of perceived control, and assessed risk taking through several indices.
Methods Participants Participants were 100 undergraduate psychology students at the University of Toulouse (89 women, mean age = 21.8, SD = 3.3), individually recruited by a research assistant. This research assistant (who was blind to the objectives of the study) also performed as the experimenter; we will refer to her as ‘the dealer.’
Procedure Participants took the task individually. The task consisted of a series of gambles (in fact, six; but participants did not know exactly how many gambles they would play, they just knew the game would last for some 15 minutes). Participants received an initial pool of 60 chips and were presented with three urns. Each urn contained 24 balls, with different proportions of white (winning) balls and red (losing) balls (12–12, 8–16, and 6–18, respectively). The three urns had
The game procedure depended on the experimental condition participants were assigned to, following a 2 × 2 betweensubject design that manipulated Involvement (Player draws vs. Dealer draws) and Choice of urn (Free-choice vs. Forcedchoice). In the player-draws condition, participants could draw the ball from the urn themselves, while it was a prerogative of the dealer in the dealer-draws condition. In the free-choice condition, participants could freely decide during each turn which urn they would bet on. In the forcedchoice condition, the dealer made this choice for them. In fact, the sequence of urns imposed to a participant in the forced-choice condition was determined by the choices made by the previous participant, who was assigned to the freechoice condition. Thus, the 50 sequences of choice imposed by the dealer in the forced-choice condition exactly matched the 50 sequences of choice made by participants in the freechoice condition.
Measures Once they had familiarized themselves with the rules, and before the game session began, participants answered to three preliminary questions, measuring illusory control: How many chips do you expect to have at the end of the game? Do you think that one has better chances to win the voucher if one can decide oneself on the urn to bet on? (yes or no) Do you think that one has better chances to win the voucher if one can draw the ball from the urn oneself? (yes or no). The latter two questions will only be used as a supplement to the first question, which will be our main measure of illusory control. Our four measures of interest are: 1. Expectation: The number of chips participants expect to leave with at the end of the game. This is an implicit measure of their illusion of control. 2. Bet: The number of chips wagered by participants, on average, during the six turns of play. This is a crude measure of risk taking. 3. Investment: The ratio of the amount of chips wagered by participants to the amount of chips they currently have in their possession, on average, during the six turns of play. This is a more sophisticated measure of risk taking.
4
MARTINEZ, BONNEFON, & HOSKENS 2009
Table 1 Mean expectation, bet size, and investment ratio as a function of Choice and Involvement. Forced Choice Dealer draws Player draws Free Choice Dealer draws Player draws
Expectation
Bet
Investment
46 (28) 40 (30)
7 (3) 10 (5)
.13 (.06) .17 (.10)
54 (38) 65 (52)
8 (5) 10 (6)
.16 (.08) .19 (.12)
Note. Standard deviations are shown in between parenthesis; n = 25 in each row.
4. Luck: The ratio of the numbers of white balls actually drawn to the number of white balls expected from chance. This measure of luck will be used as a covariate in some analyzes. The choice of the risk taking measures was dictated by a concern of consistency with the extent literature on gambling: Almost all the articles we have reviewed in the introduction use Bet as a measure of risk taking. Another traditional measure of risk taking would address the players’ preferences for low-probability gambles, but this measure is unavailable in the present design, because Choice is denied to half the players. As indicated by a power analysis, with N = 100, a linear regression including three uncorrelated predictors has a satisfactory power of .80 to detect a small to moderate effect size (β = .25) at a significance level of .05 (one-tailed), assuming that the predictors and the errors from the regression model have a standard deviation of at most 1 (which is necessarily true of our Choice, Involvement, and Luck predictors, as well as of our Investment dependent variable).
Results The mean and standard deviations of Expectation, Bet and Investment in the four experimental groups are reported in Table 1. To test the three candidate models we identified, we performed a series of regression analyzes (see results in Table 2). Note that we did not include the interaction term Choice × Involvement in the regression analyzes, for the sake of parsimony (there was no a priori theoretical motivation for that inclusion). We nevertheless checked that including the interaction term did not make any difference to the results of the regression analyzes. We first regressed the hypothesized mediator (Expectation) on the predictors (Choice and Involvement). Next, we regressed each of the dependent variables (Bet and Investment) on the predictors plus their covariate (Luck). Finally, we regressed each dependent variable on the two predictors, the Luck covariate and the hypothesized mediator. Mediation is achieved when inclusion of the mediator in the regression
significantly decreases the contribution of one or several predictors to the dependent variables. The broad picture is clear. First, illusory control (as measured by Expectation) increases when participants can choose the urns they bet on (Choice) but not when participants can draw the balls themselves (Involvement). Results related to our two additional, explicit yes/no measures of illusory control confirm this finding. Overall, 58 of the 100 participants believe that one’s chances are better if one can choose, whereas only 14 of the 100 participants believe that one’s chances are better if one can draw, a large and significant difference (Z = 6.1, p < .001, Cohen’s h = 0.96). Note that whether the participants could themselves choose or draw (depending on the experimental group they had been assigned to prior to responding) did not appear to make any difference to their answers to these two general, hypothetical questions: A multivariate analysis of variance did not detect any effect of Choice, Involvement or their interaction on these two answers (all F s < 1, all ps > .35). Second, the risks participants are willing to take are impervious to the Choice manipulation but not to the Involvement manipulation. Involvement has a reliable influence on the number of chips participants wager, as well as the ratio of their resources this bet represents. Interestingly, the Luck covariate (negatively) affects Investment but not Bet: It appear that participants who where lucky with their draws (and consequently in possession of a comparatively large number of chips) did not substantially increase the size of their bets, which mechanically decreased the proportion of their resources they wagered. Third, it is remarkably clear from Table 2 that Expectation does not serve as a mediator for the effect of Involvement on Bet or Investment. Indeed, the contribution of Involvement to Bet and Investment is strictly the same whether or not Expectation is included in the regression. Furthermore, Involvement is not in any case a significant predictor of Expectation. Two of the conditions for statistical mediation are thus violated. The same conclusion applies to Choice: the contribution of Choice to Bet or Involvement is not reduced by the inclusion of Expectation in the regression. Furthermore, although Choice does significantly increase the Expectation mediator, it has no detectable effect on Bet or Investment even before the mediator is included in the regression. Again, two of the conditions for statistical mediation are violated. Overall, results are entirely consistent with the fullseparation model, and falsify both the full-mediation and the half-mediation models. Choice indeed has an effect on Expectation, but this effect on Expectation does not impact in turn Bet or Investment. On the other hand, Involvement does have an effect on Bet and Investment, but this effect is not mediated by Expectation—and in particular, Involvement has no detectable effect on Expectation.
General Discussion Participants in our experimental gambling game played differently and had different expectations depending on
ACTIVE INVOLVEMENT, NOT ILLUSORY CONTROL, INCREASES RISK TAKING IN A GAMBLING GAME
5
Table 2 Mediation results Predictors Choice Involvement (Luck) Expectation R2
Mediator Expectation
Dependent variables Bet Investment
Mediation tests Bet + Expectation Investment + Expectation
+.22∗ +.03
+.08 +.21∗∗ +.13
+.07 +.26∗∗ −.30∗∗
.05
.07
.14
+.08 +.21∗ +.13 <.01 .07
+.05 +.26∗∗ −.29∗∗ +.11 .15
Note. Parameters are standardized β-coefficients. ∗ p < .05, ∗∗ p < .01. whether they could choose the location of their bets, and whether they were actively involved in the mechanistic resolution of the gamble. Players who could choose the location of their bets expected to fare better than those who could not, but did not take larger risks. Players who could draw the balls from the urns took larger risks than those who could not, but did not expect to fare better. In other terms, a clear separation was observed between the effects of Choice (which impacted illusory control) and Involvement (which impacted risk taking). It might come as a surprise that the effect of Choice is limited to illusory control, and does not extend to risk taking, especially since illusory control has been shown to play a role in problem gambling (Ginakis & Ohtsuka, 2005). We do not see however any contradiction between our results and the conception according to which illusory control is a key aspect of pathological gambling. Illusory control can influence gambling decisions in other ways than simply increasing wagers. For example, illusory control can be an encouragement to engage in a gamble in the first place; or an encouragement to adopt self-destructive attitudes such as chasing, that is, persistent gambling in the hope of making up for a series of losses (Breen & Zuckerman, 1999). One reviewer suggested that participants in the Forced Choice condition may have had theories ranging from a benevolent to a malevolent dealer, because they were not told that their forced choices were actually that of the previous participant. If true, this may have watered down the effect of Choice on risk taking, as some participants (those who have illusions of control about Choice and believe in a benevolent dealer) could have wagered more in the Forced Choice condition. This, however, would imply greater variance in the Forced Choice group, which is not found in our data— variance is in fact slightly greater in the Free Choice group, both for the Bet and Investment variables. Another potential concern about our experimental design is that Expectation may reflect general optimism about future outcomes, over and above any effect of illusory control: Although perceptions of control imply optimism, the locus of optimism might be located outside illusory control. We acknowledge this possibility, but cannot think of any plausible reason for Choice to trigger optimism/pessimism about the results of the gamble that would not be due to perceptions
of control. Furthermore, this concern is moot in the case of Involvement: Because Involvement does not impact Expectation, we can tentatively conclude that it has no effect on optimism, control-based or not. What is left to explain is why Involvement increases risk taking, and why this effect is not mediated by illusory control. In the rest of this discussion, we suggest that the lack of mediation by illusory control rules out an explanation in terms of belief in the deployability of personal luck, and that the effect of Involvement is best explained by the increased arousal it may deliver. Wohl and Enzle (2002) expanded on Langer’s model of illusory control to include perception of personal luck as a source of illusory control. In a first study, they showed that letting participants choose themselves a scratch-and-win lottery ticket enhanced both their perception of personal luck and their perceived chance of winning. In further studies, they demonstrated that participants behaved as if luck was a personal quality that could be transmitted to the gambling device by mechanisms akin to sympathetic magic. One might then consider that our participants behaved as if they could ‘magically’ enhance their chances of winning by drawing the ball from the urn, and that this belief encouraged them to wager larger amounts of chips. This account, however, would predict an effect of Involvement on Expectation, and an effect of Expectation on risk taking—neither of which is detected in the present study. One reviewer suggested that the timing of the control measure might be responsible for the lack of an Involvement effect on illusory control. It could be that, unlike that of Choice (which is immediate), the effect of Involvement on illusory control builds up as a result of actually taking action, and requires measurement through out the game. We acknowledge that possibility, and the methodological challenge of finding a nonintrusive measure of illusory control that would not disrupt the continuity of the gambling task. We believe, though, that an explanation in terms of arousal gives the most consistent account of our results. Gambling is physically arousing (Meyer et al., 2000), and higher levels of arousal increase one’s inclination to accept a higher risk level; for example, aroused individuals are willing to pay more for lotteries and less for insurance (Mano, 1994). In parallel, Coventry and Norman (1998) did not observe
6
MARTINEZ, BONNEFON, & HOSKENS 2009
any link between arousal and illusory control in a gambling task. Thus, our results can be readily explained by postulating that active involvement results in higher arousal (see also Fernandez-Duque & Wifall, 2007, for a similar intuition): Participants who can draw the balls experience higher arousal, and therefore take greater risks, but they do not feel greater control over the outcome of the gamble. Illusory control has been legitimately identified as a key aspect of gambling—but we should be careful in assessing both its determinants and its behavioral consequences. Our findings emphasize that the quantitative risks players are willing to take (arguably a critical feature of gambling) are increased by their active involvement in the mechanistic aspects of the gamble, independently of the illusion they maintain over the control they exert. Further investigations will likely clarify whether this effect is due to increased arousal.
References Breen, R. B., & Zuckerman, M. (1999). Chasing in gambling behavior: personality and cognitive determinants. Personality and Individual Differences, 27, 1097–1111. Burger, J. M. (1991). The effects of desire for control in situations with chance determined outcomes: Gambling behaviour in lotto and bingo players. Journal of Research in Personality, 25, 196– 204. Chau, A. W., & Phillips, J. G. (1995). Effects of perceived control upon wagering and attributions in computer Blackjack. Journal of General Psychology, 122, 253–270. Coventry, K. R., & Norman, A. C. (1998). Arousal, erroneous verbalizations and the illusion of control during a computergenerated gambling task. British Journal of Psychology, 89, 629–645. Davis, D. D., Sundahl, I., & Lesbo, M. (2000). Illusory personal control as a determinant of bet size and type in casino craps games. Journal of Applied Social Psychology, 30, 1224–1242. Dixon, M. R. (2000). Manipulating the illusion of control: Variations in gambling as a function of perceived control over chances outcomes. Psychological Record, 50, 705–719. Dixon, M. R., Hayes, L. J., & Ebbs, R. E. (1998). Engaging in illusionary control during repeated risk-taking. Psychological Reports, 83, 959–962.
Dunn, D. S., & Wilson, T. D. (1990). When the stakes are high : A limit to the illusion control effect. Social Cognition, 8, 305–323. Fernandez-Duque, D., & Wifall, T. (2007). Actor/observer asymmetry in risky decision making. Judgment and Decision Making, 2, 1–8. Gilovich, T., & Douglas, C. (1986). Biased evaluations of randomly determined gambling outcomes. Journal of Experimental Social Psychology, 22, 228–241. Ginakis, S., & Ohtsuka, K. (2005). Problem gambling: An exploration of the role of global personal hopefulness, short-term gambling hope, and illusion of control beliefs. Gambling Research, 17, 7–16. Horswill, M. S., & McKenna, F. P. (1999). The effect of perceived control on risk taking. Journal of Applied Social Psychology, 29, 378–392. Ladouceur, R., & Mayrand, M. (1987). The level of involvement and the timing of betting in roulette. The Journal of Psychology, 121, 169–176. Ladouceur, R., Mayrand, M., Dussault, R., Letarte, A., & Tremblay, J. (1984). Illusion of control: Effect of participant’s participation and implication. The Journal of Psychology, 117, 47–52. Langer, E. J. (1975). The illusion of control. Journal of Personality and Social Psychology, 31, 311–328. Langer, E. J., & Roth, J. (1975). Heads I win, Tails it’s chance: The illusion of control as a function of the sequence of outcomes in a purely chance task. Journal of Personality and Social Psychology, 32, 951–955. Mano, H. (1994). Risk taking, framing effects, and affect. Organizational Behavior and Human Decision Processes, 57, 38–58. May, R. K., Whelan, J. P., Meyers, A. W., & Steenbergh, T. A. (2005). Gambling-related irrational beliefs in the maintenance and modification of gambling behaviour. International Gambling Studies, 5, 155–167. Meyer, G., Hauffa, B. P., Schedlowski, M., Pawlak, C., Stadler, M. A., & Exton, M. S. (2000). Casino gambling increases heart rate and salivary cortisol in regular gamblers. Biological Psychiatry, 48, 948–953. Wohl, M. J. A., & Enzle, M. E. (2002). Temporal orientation and perceived control as determinants of risk-taking. Personality and Social Psychology Bulletin, 28, 1388–1397. Wortman, C. B. (1975). Some determinants of perceived control. Journal of Personality and Social Psychology, 31, 282–294.