Ascending Prices and Package Bidding: A Theoretical and Experimental Analysis* John H. Kagel Department of Economics Ohio State University Yuanchuan Lien Humanities and Social Science Division California Institute of Technology Paul Milgrom Department of Economics Stanford University 4/10/2009 We use theory and experiment to explore the performance of multi-stage, price-guided, combinatorial auctions. Dynamics in combinatorial auctions can help bidders to identify relevant packages and encourage losing bidders to bid to their limits. Our experiment compares a dynamic combinatorial mechanism to a simultaneous ascending auction. Unlike earlier experiments, we report not only comparative efficiency and revenue but also statistics about bidder behavior that, according to theory, help determine auction performance. We test the hypothesis that subjects in a combinatorial mechanism reach efficient and core allocations in the very environments where particular automated bidders perform similarly. *
Research support from National Science foundation grants ITR-0427770 and SES0648293 is gratefully acknowledged. Nels Christiansen and Marissa Beck provided very valuable research support and David Moshal created the auction software. We thank Peter Cramton, Jacob Goeree and attendees at the University of Arizona conference in honor of Vernon Smith’s eightieth birthday and the Penn State CAPCP conference for helpful comments.
I. Introduction The welfare theorems of neoclassical economics teach that in certain economic environments, the efficient allocations are precisely the ones supported by linear, marketclearing prices. It is quite common, however, to encounter situations with scale economies or with a combination of indivisibilities and complementarities in which such market-clearing prices do not exist.1 Still, auctions are used to fix prices even in these settings. There is a long history in economic thought asserting that prices work well to guide resource allocation because they minimize the amount of communication required in the process of achieving an efficient allocation. Hayek (1945) makes this famous argument informally and Hurwicz (1977) makes the corresponding formal argument, assuming that all production sets and preferred sets are convex. Recent theoretical results of Nisan and Segal (2006) make it clear that without such a restrictive and simplifying assumption, these arguments may not apply: priceguided procedures are not guaranteed to achieve even a fraction of the maximum possible value. This theoretical possibility, however, is based on a worst-case analysis and leaves open the possibility that auctions guided by individual item prices might perform well in a far wider range of environments than those studied in neoclassical economic theory. Over the past few years, economic experimenters have explored that possibility. They have designed price-guided auction mechanisms – cousins of the Walrasian tatonnement process – and tested them on selected allocation problems. These new auctions differ from the original Walrasian mechanism in two important ways. First, for any specified prices, the quantities bid at each round represent not just a report but an actual commitment to buy the demanded bundle at the specified prices. And second, these mechanisms use both current and past bids in a single optimization to determine the winning bids. For example, if bids of 10 for A and 4 for B made at some round lose to a bid of 15 for the bundle AB and if a bid of 6 is subsequently made for B, then the old losing bid of 10 for A can become a winning bid in that round because it has become part of the unique combination of bids that achieves the maximum total of 16.
1
Gul and Stacchetti (1999) and Milgrom (2000) show that a sufficient condition for market-clearing prices to exist is that goods are substitutes for all bidders and that if the set of preferences is drawn from a larger set than the substitutes valuations, then there exist preference profiles such that no market-clearing prices exist.
1
Two recent papers report pioneering experiments with such mechanisms. The RAD design of Kwasnica, Ledyard, Porter, and DeMartini (2005) uses bids at each round to compute prices that come “as close as possible” to market clearing in a particular metric. After each round, the prices are reported back to the bidders and used to set minimums for the next round of bidding. Individual prices in RAD can increase or decrease from round to round. In contrast, the combinatorial clock auction (CCA) mechanism introduced and tested by Porter, Rassenti, Roopnarine, and Smith (2003) determines prices that increase monotonically from round to round. Like RAD, the CCA reports tentative prices to bidders after each round and uses the prices to limit the acceptable bids. Porter, Rassenti, Roopnarine, and Smith (2003) report surprisingly efficient outcomes from experiments testing the CCA. In 25 auction trials, efficiencies of 99% are reported in two trials and 100% in the remaining 23 trials. Unfortunately, these results cannot be replicated because detailed information about the auction rules, the bidder interfaces, the valuations used and the bids placed in their experiment are unavailable. How should economists explore and compare the potential of these and other new mechanisms to solve difficult package allocation problems? Experiments to date have been divorced from theory, but experiments alone cannot resolve the comparative performance of alternative package auctions designs. To illustrate the reason for this conclusion, consider the experiment reported by Brunner, Goeree, Holt, and Ledyard (2007) and Goeree, Holt, and Ledyard (2007) testing a RAD-inspired design to sell radio spectrum licenses for FCC auction 73. The experiment entailed selling 18 licenses – 12 “national” licenses and 6 “regional” licenses.2 The number of possible packages is the number of non-empty subsets of a set of 18 items, which is 262,143. So, setting aside any possible value interdependencies or externalities, the set of possible value profiles for n bidders is ℜ 262143n – far too large to explore thoroughly + using experiments alone. The comparative performance of alternative mechanisms is best explored by standard science utilizing both theory and experiments, generating hypotheses based on experimental results and economic reasoning and testing those in new experiments.
2
The experiment was designed to model the impact of package bidding for the C-band in FCC Auction 73, which had 12 licenses in total. The experiment was commissioned by the FCC and so a number of the design elements were dictated by them. The computer interface had a calculator to aid bidders in creating and evaluating any package they wanted to bid on.
2
In this paper, we use theory and experiments to explore the performance of price-guided package auctions. Our experiment compares a combinatorial clock auction (CCA) to a simultaneous ascending auction (SAA). Our theory, presented in section II, identifies sufficient conditions under which any “standard” package auction mechanism leads to efficient or core allocations. Supposing that these sufficient conditions are necessary ones in practice, we hypothesize that simulations using automated bidders with a simple strategy should predict whether the outcomes of actual experiments are (nearly) efficient or in the core. Section III describes the experimental procedures. Section IV presents the experimental results and tests our hypotheses. Concluding remarks are offered in section V.
II. Theory and Hypotheses The formal theory introduced in this section studies standard package auctions, which are defined by three properties: the winning bids are the ones made at any time during the auction that maximize the total price received by the seller; each winning bidder pays the amount of its winning bid; and losers pay zero. Both RAD and the CCA, are standard package auctions, but so are the menu auctions of Bernheim and Whinston (1986) and the ascending proxy auction of Ausubel and Milgrom (2002), which use no individual item prices.3 Our theory of standard package auctions emphasizes the role of goods assignments that maximize total value for all bidders and for certain relevant subsets of bidders. We call each bidder’s part of the goods assignment its “efficiency-relevant” or “core-relevant” bundle. The theorems assert roughly that if bidders bid no less aggressively on the efficiency- or corerelevant bundles than on the bundles they actually win, then the auction outcome is efficient or in the core, respectively. Our analysis is based on the presumption that when some bidders do not bid so aggressively on the relevant packages, efficient and core outcomes are unlikely. Stating our results precisely requires some notation. Let N denote the set of bidders, G the set of goods on offer, x j the package of goods assigned to bidder j, x = (x j ) j∈N the goods
3
Even the simultaneous ascending auction (SAA) without explicit package bids can be construed as a standard package auction in our theory if one interprets the bids for any package at any round to be the sum of the bids on the lots included in the package. With this interpretation, however, the SAA imposes severe restrictions on the set of package bids a bidder can make, which alters the way the theorems can be applied. We discuss applications of the theorems to mechanisms in which, like RAD or the CCA, no such bid restrictions apply.
3
assignment, and v j (x j ) bidder j’s value for its goods. The total value of the goods assignment x is
∑
j∈N
(
)
v j (x j ) . The triple G, N ,(v j ) j∈N defines a package allocation problem.
Associated with any package allocation problem is a cooperative game with transferable utility in which the players are the bidders N and the seller. Let x(S ) ∈arg max x ∑ j∈S v j (x j ) . In particular, x(N ) is the goods assignment that maximizes total value over all the bidders. The value of the coalition consisting of the seller and the bidders in set S is w(S ) = ∑ j∈S v j (x j (S )) ; any coalition that excludes the seller has value zero. An allocation consists of a goods assignment x and a vector of payments or transfers τ made by the bidders. Associated with any allocation is a payoff vector or imputation π given by
π 0 = ∑ j∈N τ j and, for j ≠ 0 , π j = v j (x j ) − τ j . A feasible imputation satisfies π 0 + ∑ j∈N π j ≤ w(N ) . A feasible allocation (x,τ ) with corresponding imputation π is a core allocation if, for every set of bidders S, the imputation satisfies the no-blocking inequality
π 0 + ∑ j∈S π j ≥ w(S ) and, in that case, π is a core imputation. We say that a set of bidders S (and the coalition comprising those bidders and the seller) is core-relevant if there is some core imputation π such that π 0 + ∑ i∈S π i = w(S) . For all i ∈S ,
the package xi (S) is bidder i’s core-relevant package. Similarly, the package xi ( N ) is i’s
efficiency-relevant package. By a standard property of systems of linear inequalities, the core imputations are those satisfying π 0 + ∑ i ∈S π i ≥ w(S) for every core-relevant set of bidders S. For any package x j , let β j (x j ) denote the highest price that j bids for that package during the course of the auction, with β j (∅) ≡ 0 . Denote the auction outcome by (x ,τ ) . The
package auction is standard if x ∈arg max x ∑ j ∈N β j (x j ) and each bidder j pays τ j = β j (x j ) . The bidders’ payoffs are π j = v j (x j ) − β j (x j ) and the seller’s revenue is π 0 = ∑ j ∈N β j (x j ) , which is also the seller’s payoff. For a losing bidder j, x j is null and π j = 0 .
4
Theorem 1. In a standard package auction, if for all core-relevant sets of bidders S, for some core-relevant goods assignment x(S ) ∈arg max x ∑ j ∈S v j (x j ) , and for all i ∈ S ,
vi (xi (S)) − β i (xi (S)) ≤ π i , then the allocation (x , β (x )) is a core allocation. Proof. For any relevant set of bidders S,
π 0 + ∑ i∈S π i = ∑ i∈N βi (xi ) + ∑ i∈S π i
≥ ∑ i∈S β i (xi (S)) + ∑ i∈S π i
(1)
≥ ∑ i∈S vi (xi (S)) = w(S)
The first equality and the first inequality are justified by the definition of a standard package auction. The second inequality follows from the hypothesis of the theorem. The final equality follows from the definition of xi (S) . The allocation (x , β (x )) is thus feasible and unblocked by any relevant coalition. QED Theorem 2. In a standard package auction, if for some efficiency-relevant goods assignment x( N ) ∈arg max x ∑ j ∈N v j (x j ) and for all bidders i, vi (xi (N )) − β i (xi (N )) ≤ π i , then the goods assignment x is efficient: π 0 + ∑ j ∈N π j ≥ w(N ) . If the efficient goods assignment is unique, then the auction outcome (x , β (x )) is efficient only if for every bidder i, vi (xi (N )) − β i (xi (N )) ≤ π i . Proof. We calculate as follows.
π 0 + ∑ j ∈N π j = ∑ j ∈N β j (x j ) + ∑ j ∈N π j ≥ ∑ j ∈N β j (x j (N )) + ∑ j ∈N π j
(2)
≥ ∑ j ∈N v j (x j (N )) = w(N ) The first equality and the first inequality are justified by the definition of a standard package auction; the second inequality follows from the hypothesis of the theorem; and the final equality follows from the definition of x j (N ) . That proves the first assertion. For the converse, suppose that x is efficient. Since the efficient goods assignment is assumed to be unique, x = x(N ) , so vi (xi (N )) − β i (xi (N )) = vi (xi ) − β i (xi ) = π i . QED
5
The two theorems apply to individual auction events, taking account of the bidders’ particular values and bids. The conditions of the theorems can be informally described as requiring that bidders bid aggressively for certain core- or efficiency-relevant packages, and the conclusions as saying that if those conditions are satisfied, then the outcome is in the core or is efficient, respectively. A subtlety in applying the theorems is that the conditions depend jointly on the auction rules, the nature of the package assignment problem, and the way that bidders behave. For example, if goods are substitutes and prices for individual items rise by small increments at each round for the goods in excess demand, and if bidders bid at each round for just their most profitable packages, then the result will converge to an approximate competitive equilibrium allocation, which is also an approximate core allocation. Yet, the very same behavior and auction rules can lead to inefficient outcomes in other environments. For example, suppose that there are three identical items for sale and two bidders, each of whom has a value of 100 for any bundle consisting of two or three items. Then, the efficient allocation involves awarding one item to the bidder who has the highest value for a single item and two items to the other bidder. If the bidders’ values for the single items are all less than fifty and if each bidder bids at each round for just its most profitable package, then neither bidder will ever bid for a single item. Consequently, the information needed to identify the efficient outcome will not be revealed in the auction and the actual outcome will be efficient only by chance.4 Other behaviors lead to different results. For example, consider any standard package auction with the property that the minimum bid on every package increases by at most a small amount at every round, until there are no new bids. Suppose that bidders bid at every round for all bundles that are currently profitable. Then, to within one increment, say δ , the last bid made on any bundle satisfies | β i (x) − vi (x) |< δ . So, according to Theorem 1, the outcome will lie near to the core. (With such behavior, however, the winning bidders would earn at most δ , so one would not expect profit-maximizing bidders to behave in this way.)
Blumrosen and Nisan (2004) prove that if bidders bid only for their most preferred bundles, then for any x<100, there are examples in which the efficiency loss is greater than x%. See also Nisan and Segal (2006). 4
6
In problems of realistic scale, bidders cannot place bids on every package at every round, even if the rules permit that. Even in auctions with a limited number of items for sale, it is likely that bidders place bids only on a few packages. In such cases, for good outcomes to emerge from an experiment, the bidders must somehow identify the relevant packages and, in addition, must decide to bid aggressively on those packages.5 There are many ways that bidders might identify the relevant packages in an experiment. For example, in experiments testing some proposed FCC spectrum auction design, a particular bidder might bid for a regional package of spectrum licenses because that package appears to be most profitable at the quoted prices, or because the bidder’s role in the experiment is labeled “regional bidder,” or because the experiment assigns zero values to the bidder for licenses outside the named region, or because the bidder enjoys value synergies only among licenses in that region, etc. If the regional package is, in fact, the only relevant package, any of these experimental features could lead the bidder to identify the relevant package, potentially encouraging efficient or core outcomes. To isolate the likely role of price information in standard package auctions, we simulate auction results by using automated bidders that bid at each round only for the most profitable bundle at the prevailing prices. The performance of these automated bidders will generate testable hypotheses about environments in which a package auction is expected to perform well or poorly when the only information to guide bidders to packages is the current round’s prices. And, by studying problems with just a small number (four or six) of items for sale, if we find that automated bidders cannot identify the relevant packages, we can infer that the problem is even more severe when the number of items is larger. Our theory of bidder behavior and outcome determination entails two central hypotheses: 1. In price-guided package auctions, at each round, bidders bid for many fewer packages than are profitable at the current round prices. When there are many items for sale, it is typically impossible for bidders to bid on even a small fraction of the full set of packages. With fewer items, subjects may be unwilling to spend the effort to bid for many packages. And, it may not serve the bidder’s interest to 5
The permitted message space can affect the difficulty of making many, well-structured package bids, but investigation of that issue is beyond the scope of this paper.
7
bid for multiple packages, because that may drive up prices for other preferred bundles. In our design, bidders with provisionally winning bids may refrain from bidding at higher prices in the hopes of winning at a low price. Without specifying any single reason, our hypothesis here is that bidders bid for only one or a few packages even in small-scale auctions like those in our experiment. 2. Simulations in which automated bidders bid only for the currently most profitable package will lead to (near) core or efficient outcomes in the same environments where experimental outcomes lead to approximate core or efficient outcomes. This hypothesis is based on a radically simple version of the previous hypotheses, namely that each bidder does not do significantly better than it could by bidding on just one package at each round. Either the prices guide the bidders to the relevant packages so that the conditions of the theorems are satisfied, or they do not. Implicit in this hypothesis is that only price information matters, because the simulated bidders use only that sort of information. In the particular package auction that we investigate, bidders are informed when they have a provisionally winning bid. That has turned out to be a consequential decision: the provisionally winning bidder status may become a trap if the bidder, perhaps hoping to get a low price, declines to increase its bid while it remains a provisional winner. By the time its status changes and its bid is no longer a provisional winner, prices may have risen too high to make it profitable to bid again. Cases where this pattern occurs can be identified by a detailed examination of bidding histories and, as shown below, some inefficient outcomes arise in this way. In terms of the theorems, we can describe these situations as failures of bidders to bid sufficiently aggressively for the relevant packages. In addition to statistics for testing these predictions, we also report other aspects of bidder behavior and traditional auction performance measures and compare these to a non-package auction alternative. For bidder behavior, we ask: In our package design, do the provisionally winning bidders stand pat or make new bids? In the non-package design, when there is an exposure problem, how do bidders respond? Do they withdraw, avoiding losses but possibly missing out on potential profits? Or do they continue to bid and risk suffering losses? For
8
traditional performance measures, we analyze auction efficiency, revenue, profits, distance to the core, and number of rounds to completion. Before summarizing our findings, we first describe the details of the experimental design.
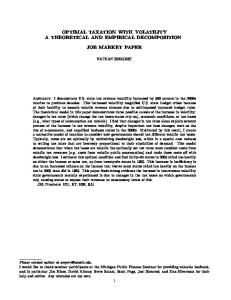
III. Experimental Design and Procedures6 We conducted auctions with either four or six items for sale with similar value structures in both cases. In what follows we focus on the six-item case, illustrated in Figure 1. There were three bidders in each auction. The north regional bidder had a positive value only for items A, B and C, and enjoyed a positive synergy value if it acquired two adjacent items, either A and B (henceforth AB) or B and C (henceforth BC). If the bidder acquired ABC, it enjoyed the sum of both synergy values. The synergy values for the AB pair and the BC pair were equal. Similarly, there was a south regional bidder with positive value for items D, E, and F, with zero value for the other items, and with identical, positive synergies between items D and E and items E and F. Finally, there was a global bidder with positive value for all six items and identical adjacency synergies for pairs AB, BC, DE, EF, AD, BE, and CF. The standalone values for the regional bidders were integers, drawn independently and uniformly across bidders and items from the interval [5, 75] (but values were later selected for trial, as described below). There was a single synergy value for each bidder between any pair of adjacent items, which was an integer drawn uniformly from [5,15] in the low synergy regime or from [25,35] in the high synergy regime. The high or low synergy regime was in place for both regional bidders at the same time and was announced prior to each auction. The standalone values for the global bidder were integer values, initially drawn independently and uniformly from the support [5, 45] and synergy values consisted of a single random draw from [25, 35] in all cases. Thus, in the case of low synergy values for the regional bidders, the global bidder faced relatively weaker competition than when the regional bidders had higher synergy values. Further, the lower standalone values for the global bidder meant that they had to rely more on the synergies for profits as compared to the regional bidders, who relied 6
The full set of instructions, which includes more sample screen shots, is available at www.econ.ohiostate.edu/kagel/KLM_instructions.pdf.
9
Valuations for Six Item Experiment North Regional
Synergies between:
South Regional
A
B
C
- 5 and 15 or
A
B
C
x1
x2
x3
- 25 and 35
0
0
0
D
E
F
D
E
F
0
0
0
y1
y2
y3
Stand alone values between 5 and 75 on A & B & C, or D &E&F
Global A
B
C
z1
z2
z3
D
E
F
z4
z5
z6
Synergies between 25 and 35 Stand alone values between 5 and 45 on all items
Figure 1 more on their higher average standalone values. Roles as a regional or global bidder changed randomly from auction to auction, with bidders’ valuations changing between auctions as well. The four-item auctions were the same as the six-item auctions but with standalone items C and F dropped. After the initial random selection of values, we performed simulations as described below to identify “interesting” cases, which were the cases we ran in the laboratory. Focusing on these special cases allows us to pinpoint features of value profiles that determine the performance of our auction mechanisms. For our statistical analyses below, it is not necessary to suppose that the values are randomly drawn, but only that bidders are randomly assigned to treatments.7
CCA Auctions Our auctions were run using a variant of the CCA rules of Porter et al. (2003). Subjects could bid on one or more packages, such as the package ABC (containing A, B and C). Bids for each bidder were XOR bids, meaning that only one of the bids could be a provisionally winning bid in any given round of the auction. In the CCA, when a bid won, the bidder was assigned all Although we obtained the set of auctions values used based on these random draws, the instructions were clear not to suggest that the valuations were randomly drawn.
7
10
Figure 2 the items in its winning package and only those items. Package bids are particularly valuable when there are synergies between individual items as they eliminate the exposure risk associated with bidding for individual items at prices above their standalone values. The auction proceeded in 25-second rounds during which subjects could submit as many package bids as they wished (see Figure 2). A package bid consisted of a package and a price. The price part of a package bid was the sum of the prices of the items in the package in the round that the bid was placed. Following each round, tentative winning bids were determined by an optimization routine that chose from among all current and past bids to find the combination that
11
maximized seller revenue.8 (Prices associated with past bids were based on prices in the round in which the bids were originally placed.) Prices for all items started at 5 ECUs (experimental currency units), with price increases between rounds determined as follows: from the set of provisionally winning bids in the previous round and the set of new bids in the current round, if two or more bidders had positive demand for an item, then its price increased by a fixed amount (5 ECUs). If some of the packages a subject bid on in the current round overlapped with her provisionally winning bid in the previous round, the prices of the overlapping items also increased. Otherwise the price for an item remained the same.9 Thus, by looking at which items had price increases for the current round, bidders could easily identify items for which bidders were actively competing. Following each round, bidders were privately informed which, if any, of their bids was a provisionally winning bid. 10 Subjects were encouraged to place bids on multiple potentially profitable packages, particularly early on as “… the opportunity to make profitable bids on individual items or packages with low synergies, which may become provisional winners later in the auction, will only be present early in the auction.”11 There were no eligibility rules restricting what items subjects could bid on. An auction ended after two consecutive rounds of no new bids, or what amounts to the same thing, no price increases. Two rounds were used to give everyone a chance to determine if they were satisfied, given current prices, which their provisionally winning allocations.
SAA Auctions Our SAA screen was designed to look the same as the CCA screen, so that differences in comparative performance could not be attributed to differences in presentation. The rules were also designed to be as similar as possible. Like the CCA, the SAA proceeded in a series of 25second rounds. Like the CCA, a subject only had to click “set” next to any set of items to place a 8
Ties for tentative winning bids, which are to be expected early on in the auction, were broken randomly with priority given to tentative winners in the previous round if prices did not change. Ties become less of a concern in later stages of the auction. 9 Thus, prices were weakly increasing from round to round, unlike RAD (Kwasnica et al. (2005)) or the FCC’s Modified Package Bidding. 10 Tentative winning bids were not announced in either the original Porter et al. (2003) experiment or in Brunner et al. (2007). As will be shown, this seemingly small design change had significant implications for auction outcomes. 11 In a mechanism design experiment, the instructions are a very important part of the treatment as bidders are informed of the favorable properties and operation of what will typically be a novel institution.
12
Figure 3 bid on those items (see Figure 3). However, unlike the CCA, an SAA bidder could only make one such bid and that bid was interpreted and processed as a collection of independent item bids rather than as a package bid. Prices of each item were computed separately, with prices increasing by 5 ECUs in each auction round with excess demand. The auction ended once there was no longer excess demand for any item, with each item sold to the high bidder for that item at the current price. Thus, a bidder who bid more than her standalone value for an individual item in order to capture the synergy payoff was exposed to a possible loss because she could win just one item and pay more
13
than its standalone value. With strong complementarities between items, this exposure problem is considered one of the major drawbacks of the SAA auction. Our version of the SAA had a number of special properties not present in the CCA. 1. Activity requirement: Each auction started with bidders eligible to bid on all items – six in this case. However, if in any given round a bidder failed to bid on some items, the total number of items it could bid on in subsequent rounds was reduced to the total number of items bid on in that round. This activity rule was explained as necessary to have the auction close in a timely manner. 2. Default bids: Each round of the auction started with a default bid labeled “currently demanded bid” which was the previous round’s bid (or a bid on all items in the first round of bidding). Any time a new bid was entered that reduced eligibility, the bidder was notified and required to reconfirm the bid.12 3. Minimum bid requirements: Once there was no longer any excess demand for an item, the current high bidder for that item was required to maintain their bid for the item, with this minimum bid requirement in effect unless someone else topped that bid. This minimum bid requirement held regardless of whether there was a positive profit on the item (or set of items) in question. 4. Price rollback rules: Given the indivisibilities inherent in the fixed-price increase rule, near the end of an auction it would not be unusual for two bidders to drop their demand for the same item at the same time, moving from excess demand to zero demand. This would result in unsold items with a potentially large, negative impact on efficiency. A price rollback rule, described in detail in the experimental instructions, was designed to deal with this situation.13 This rule randomly allocated the item in question to one of the bidders demanding the item in the previous round at the previous round’s price, without precluding the opportunity for the losing bidder to buy the item at the higher price if they chose to do so.
12
An earlier set of SAA auctions showed that without these proactive procedures a number of subjects let their eligibility lapse well before it was profitable to do so. See the appendix for a comparison of outcomes in these earlier SAA auctions with the ones reported on here. 13 The minimum bid requirement would not apply in this case, as there would be no current high bidder for the item in question.
14
Computer Interface and Aids for Subjects Auctions with multiple items and synergies among them are quite complicated for subjects. This raises an issue not usually included in theoretical studies, namely, that the nature of the bidder interface and any analytic tools it includes can affect bidder behavior and hence the experimental outcomes. Since we intended the experiment to be representative of high-quality field implementations, we aimed to have as friendly a computer interface as possible, as well as to provide subjects with computational aids that they might expect to have from support staff in a field setting. The same set of bidding aids were provided in both the SAA and CCA auctions. These are shown in the screen layout under “Analytics” and “Previous periods results” in Figures 2 and 3, which provide sample starting screen shots for a south regional bidder in an SAA and CCA auction, respectively. The aids provided to the bidders consisted of a list of all possible bids, with corresponding analytic information, so that subjects could bid on items by simply clicking on the “add” or “set” space next to packages they were interested in. The analytic information was automatically updated at the end of each round. To make it easy for bidders to compare alternative packages, the table could be sorted using any of the criteria listed in the columns – value, current cost, current profit, etc. To allow bidders to compare bids by more than one criterion, a double-criterion sort routine was employed. Packages with a check mark always appeared at the top of the screen, sorted by the criteroni the subject chose. They were followed by the remaining packages, which were sorted by the same criteria. A bidder interested in comparing a particular group of bids with ones that perform well according to another criterion could check the bids of interest before sorting on the preferred criterion. Check marks were applied by default to all packages bid on in previous rounds since those were presumed to be of interest, but bidders could remove the check by a single click. For regional bidders, checks were initially applied to packages containing only those items in the bidder’s region of interest.14
Experimental Procedures Subjects were recruited to participate in a series of three sessions taking place within a two-week period. Each session would last for approximately two hours. The first meeting was a 14
Automatic check marks for regional bidders were only employed in the six-item auctions. These were initiated on account of the increased number of packages available to bid on. In the four-item auctions, bidders could effectively see all the packages on a single screen so the risk of mistakenly choosing dominated packages was not as severe.
15
training session where subjects were introduced to the experimental procedures and computer interface, followed by three dry runs, which were all that could be completed in the initial twohour period. To insure a high return rate, subjects were offered a $30 participation fee, to be paid only after the completion of all three sessions, and half of session two’s profits from the auctions were withheld until the completion of session three. In addition, subjects were paid a flat $10 for participating in the initial training session (paid in cash at the end of the training session) in lieu of any earnings from the dry runs. Given the complicated nature of the auctions, subjects were permitted to take the instructions home. Earnings in sessions 2 and 3 were advertised to range between $10 and $60 or more per person with average earnings of $30-$40 per person. Payoffs were denominated in experimental currency units (ECUs), with a minimum conversion rate of 0.2 ECU = $1.00. Subjects were provided with starting capital balances of 150 ECUs. Any profits earned in an auction were added to these starting capital balances, and losses subtracted from it, with total earnings for a session consisting of a subject’s end-of-session balance, less 130 ECUs. Subjects’ roles as a regional or global bidder were randomly determined prior to each auction, as were the bidders in each auction group. Each experimental session was designed to have five or more auctions (all with the same valuations) running at the same time. In case of an uneven number of subjects, the extras were on standby for that auction, and guaranteed to be active in the next auction. Subjects’ computer screens only reported their own outcome until the end of the auction, when the allocation of units to all bidders in their auction was reported, along with a final analytics screen that they could play with. The latter was designed to give bidders a chance to see what profitable (according to the ending prices) packages they might have missed bidding on. Each auction began with bidders being notified of their valuations and given a couple of minutes to sort packages and to check any items/packages they might be particularly interested in. The six-item auctions started out with each auction round lasting 25 seconds. After round 6 or 7, the round time was reduced to 20 seconds, and it was reduced further to 15 seconds after
16
round 12 or so, to speed things up. Once these shorter round times went into effect, the auctioneer announced “round ending” a second or two prior to the round actually ending.15 Given the enormity of the valuation space, we needed some device for determining which set of valuations to employ. For each set of auctions, we conducted simulations in which simulated participants bid on the package with the highest current-round profits provided (i) they were not already a provisional winner on their highest valued package and (ii) it was still profitable to bid on the highest valued package. For the CCA auctions, this involved bidding on only one package in each round. For the SAA auctions, bidding was myopic, with no account taken of the possible exposure problem. For both the four- and six-item auctions, we conducted 100 simulations with randomly chosen valuations with low synergies for the regional bidders and another 100 simulations with high synergies for the regional bidders, with 1,000 replications of each randomly chosen set of valuations.16 From these we picked a set of “interesting” valuations – several cases where straightforward bidding predicted that the CCA/SAA would achieve 100% efficiency, several cases where the SAA auctions had efficient assignments but some bidders incurred losses, and several cases where straightforward bidding did not achieve 100% efficiency with either the CCA or SAA. In view of the high efficiency reported in earlier experiments, our selections were weighted towards cases with low predicted efficiency, particularly for the CCA auctions. In addition, we included a mix of cases where 100% efficiency required the global bidder to get all of the items or the regional bidders to split the items as well as cases in which 100% efficiency required all bidders to win at least one item. It became immediately apparent in the pilot sessions that subjects did not consistently follow straightforward bidding. Still, the simulations with random valuations and straightforward bidding guided our choice of which auctions to employ given the limited number of auctions we could actually conduct, enabling us to choose some auctions satisfying each of the criteria described above. [Insert Table 1 here]
15
Four-item auctions, which were conducted first, had fixed round times of 25 seconds. The procedure was changed in anticipation of a larger numbers of rounds in the six-item auctions. 16 The simulations do not always yield unique outcomes because early on there are many ties for the high bid on an item or package that are resolved randomly, which in some cases impacts the ultimate outcome.
17
Table 1 lists the auction sessions conducted with the number of subjects in each session, along with the number of auctions in each session.17 Subjects were recruited through e-mail lists of students taking economics classes at Ohio State University in academic year 2006-07. For subjects completing all three sessions, average earnings per subject for the six-item auctions were $174, with minimum earnings of $90 and maximum earnings of $331, including the $30 show-up fee and the $10 payment for session one. Average earnings per subject for the four-item auctions were $125, with minimum earnings of $51 and maximum earnings of $243, including the $30 show-up fee and the $10 payment for session one. Different sets of subjects participated in each series of auctions.
IV. Experimental Results We begin by reporting characteristics of individual bidder behavior that our theory suggests can be consequential for auction outcomes. We follow by reporting on the performance of the two auction mechanisms in terms of efficiency, seller revenues, bidder profits, distance from the core, and rounds to completion.
Patterns of Individual Bidding Subjects’ bidding behavior in the CCA auctions exhibits at least four consistent characteristics related to how they identify relevant packages and how aggressively they bid on those packages. According to our theory, these characteristics are consequential for the performance of package auctions. First, as hypothesized, bidders bid on only a small fraction of the profitable packages they were eligible to bid on. 18 Moreover, most of these bids were directed at the most profitable or second most profitable package available. The number of packages attracting bids can be of independent importance because, in other experiments, bidders could have many core-relevant packages and would need to bid on all of these packages to satisfy the conditions of Theorem 1.
17
There were two sets of pilot experiments, which are not reported for both CCA and SAA auctions. They were used to refine the auction mechanisms so they would run smoothly and quickly, as well as our experimental procedures (e.g., would it really take most of two hours to go over the software and run a handful of auctions?). Indeed we would count designing the details of these two relatively complicated auction mechanisms, and implementing them in the software, as one of the major outputs of this project. 18 The clock did not seem to be a constraint on the number of bids submitted. If anything, subjects complained that we allowed too much time for each round.
18
In our actual experiment, bidders usually had just one core-relevant package: ABCDEF for the global bidder and ABC or DEF for the north and south regional bidders, respectively. So core outcomes should have been easier to achieve than in environments with many core-relevant packages for each bidder. Table 2 summarizes these data. In both sets of CCA auctions, global bidders bid on only a fraction of the profitable packages for which they were eligible, averaging 21-28% in CCA4 and 12-14% in CCA6. They bid on more packages in the CCA6 auctions, but given the large increase in the number of profitable packages available to bid on, the percentage dropped substantially. For regional bidders, there were negligible differences in the percentage of profitable packages bid on between CCA4 and CCA6 auctions, averaging in the neighborhood of 32-37% in both cases. Not surprisingly, the packages attracting the most attention were the most profitable ones, with the most profitable package being bid on around 65% of the time, on average, for both global and regional bidders. These percentages drop substantially for the second most profitable packages, averaging in the neighborhood of 25-30% overall.19 [Insert Table 2 here] Second, most losing bidders in the auction had fully exhausted their profit opportunities by the last bidding round. Both Theorems 1 and 2 require that behavior to guarantee efficient and core allocations, respectively. Table 3 reports the scope for potential profits available at end of auction, distinguishing between losing and winning bidders. The most notable element here is the difference between regional and global bidders in the frequency with which losing bidders could have possibly obtained higher positive profits by continuing to bid, averaging 6.7% for global bidders versus 24.6% for regional bidders. These differences suggest a threshold problem, where one, or both, of the regional bidders bids less aggressively, hoping that the other will cause prices to increase sufficiently to defeat the global bidder. They are statistically significant at the 1% level in a random-effects probit, controlling for repeated measures for the same subject. Nevertheless, for
19
These percentages are independent of each other in that a bid on the second most profitable package is counted independently of whether or not a bid was placed on the most profitable package.
19
regional bidders, the magnitude of the foregone profits was modest, averaging 10.3 and 16.0 ECUs in CCA4 and CCA6 auctions, respectively.20 [Insert Table 3 here] There are no comparable differences between global and regional bidders when they were winning with respect to foregone (potential) profits. This reinforces the notion that what we are seeing for losing bidders represents a threshold problem. Here too, after dropping gross outliers, the magnitude of the potential forgone profits is relatively small. Our third observation is that prices and profits guide bidding more than other factors. Note, however, that the mere fact that bids are usually made on the most profitable package cannot prove that bidders are guided by prices and profits. The same packages might be selected by other criteria. In many cases, particularly early on, the most profitable package and the “named” package (all items for the global bidder and all positively valued items for the regional bidders) coincided. To establish the degree to which prices and profits guide bidding, we focus on those cases where named packages were different from the most profitable ones. Table 4 reports these data for the regional bidders. As shown, when there was a conflict between the named package and the most profitable package, regional bidders clearly favored the more profitable package, typically by a ratio of two to one or more. Table 4 leaves out data for global bidders, as there were very few cases (2 for CCA4; 12 for CCA6) where the named package was not the most profitable package in a given round. Averaging over these few cases, the most profitable package was bid on more often than the named package (64.3% vs. 35.7%), so that global bidders were also guided more by price than the named package in these cases.21 [Insert Table 4 here] Finally, subjects typically did not place bids in rounds in which they were provisional winners. This effect was most pronounced in later rounds when the auction had a greater chance of ending immediately. In auction rounds 11 and above, no new bids were submitted by global (regional) bidders in 94.9% (89.8%) of all rounds in which they were provisional winners in 20
This is after eliminating the handful of gross outliers (minimum foregone profits of 76) noted in Table 3. Foregone profits of this magnitude are most likely driven by something other than the threshold problem. These observations have not been excluded from the percentages reported in Table 3. Average forgone (potential) profits are calculated conditional on having forgone positive profits. 21 14.3% of the bids were for both the most profitable and the named packaged.
20
CCA4 auctions, and in 88.1% (85.4%) for the CCA6 auctions.22 The reasons for these high frequencies are threefold: (i) subjects typically bid on only a fraction of the packages they are eligible to bid on even when they are not provisional winners (see Table 2), (ii) bidding on packages as a provisional winner can extend the auction and/or raise prices on provisionally winning bids, and (iii) given the bid patterns, more often than not provisionally winning bidders were already winning on their highest valued package. On this last point, in rounds 11 and higher, provisionally winning bidders who did not place new bids were already provisional winners on their highest valued package in 68.8% (72.2%) of all cases for global (regional) bidders in the CCA4 auctions and for 69.5% (58.5%) of all cases for global (regional) bidders in the CCA6 auctions. Looking at those cases in which the provisionally winning bidders did not bid and were not winning on their most profitable package, the profit difference between the package they were holding and their best alternative averaged 31.1 (13.2) ECUs for global (regional) bidders in the CC4 auctions, and 54.7 (13.5) ECUs in the CCA6 auctions.
Aside on Reporting Provisionally Winning Bids To maintain consistency between our SAA and CCA designs and the FCC rules, we reported provisionally winning bids to the bidders. Our data indicate at least two significant disadvantages to this policy. First, reporting provisionally winning bids may help bidders to tacitly collude, stopping bidding early on if all bidders are satisfied with their current profits. There was at least one clear case in which this happened. Bidding in one of the CCA4 auctions ended in round 3, with prices at their starting values and profits of 45, 26, and 43 for the two regional bidders and the global bidder, respectively.23 This occurred mid-way through the second full session, so that subjects would have correctly anticipated that they could not do much better by continuing to compete. Second, reporting provisionally winning bids encourages bidders to adopt a wait-and-see policy, hoping that a provisionally winning bid with a large profit margin will eventually become a winner. If item prices rise substantially before the bid is no longer a provisional winner, the bidder can miss opportunities to place higher bids on that same package or other relevant 22
For rounds 1-10, the corresponding percentages are 81.1% and 88.0% for global and regional bidders in CCA4 auctions and 63.6% and 71.1% for global and regional bidders in CCA6 auctions, respectively. 23 In this case no new bids were placed after round 1. There was a second, related incident where an auction ended early (in round 6) in which one of the regional bidders stopped bidding, earning zero profits, well before it made sense to do so as their package values were substantially higher than the package prices, while the other two bidders earned substantial profits.
21
packages, leading to either an inefficient assignment or a non-core (low revenue) outcome. As we have seen, provisionally winning bidders in our experiment typically did wait to bid again, even in cases where there were potentially higher profits on alternative packages. One possible way to control for the implicit collusion identified here is to employ a tiebreaking rule which allocates packages to the smallest possible number of bidders, instead of randomly as in our experimental design. This would maximize the number of bidders without provisionally winning bids in early rounds, thereby generating the competition necessary to eliminate this sort of tacit collusion. Withholding information about provisionally winning bids would eliminate the wait-andsee motive, though it would add other difficult strategic choices and might discourage bidders from bidding down to their values, in accordance with the conditions of Theorems 1 and 2.
Efficiency
(
)(
)
Efficiency is calculated as S actual − Srandom / Smax − Srandom , where Sactual is the actual realized surplus from the auction, Srandom is the mean surplus resulting from a random allocation, and Smax is the maximum possible surplus.24 With this measure, in every environment, the mean efficiency of a random assignment of goods is zero and the efficiency of a surplus-maximizing assignment is one. We report three findings about efficiency for the environments we selected. First, in our experiment, efficiency is higher on average in the CCA compared to the SAA. But, second, the CCA does not perform uniformly well: those CCA auctions where our simulations achieve 100% efficiency yield higher efficiency than the other CCA auctions as well as the corresponding SAA auctions. Further, there are important differences within these “other” CCA auctions. The subset of auctions in which named packages do not correspond to the relevant packages have the lowest CCA efficiencies, which are significantly lower than in the corresponding SAA auctions. In short, bidding is reliably more efficient in the CCA compared to the SAA only when bidders are pointed to the relevant packages either by prices or their named packages. Third, the threshold problem, while identifiable, does not severely detract from the efficiency of the CCA, but the exposure problem seriously reduces the efficiency of the SAA. 24
The value of the random allocation is computed by taking the average of the surplus over all possible allocations – 34 and 36 respectively – assuming all items are sold in each auction.
22
Figures 4 compares average efficiency between auction mechanisms for the four- and sixitem cases. [Insert Figure 4 here] Using average efficiency in each auction period as the unit of observation, efficiency is higher in 11 out of 17 (64.7%) of the CCA4 auctions compared to SAA4 auctions and in 13 out of 19 (68.9%) of the CCA6 auctions compared to SAA6 auctions. Pooling across four- and sixitems auctions, these differences are statistically significant at the .05 level using a (two-tailed) nonparametric sign test. Treating efficiency in each individual auction as a single observation, average efficiency is 93.5% (0.012) for the CCA6 auctions versus 88.2% (0.015) for the SAA6 auctions (standard errors of the mean are in parentheses), and 94.8% (0.013) for the CCA4 auctions versus 87.2% (0.020) for the SAA4 auctions. Nonparametric (two-tailed) MannWhitney tests show these differences to be statistically significant at better than the 1% level in both cases.25 These differences in efficiency are not surprising given the strong complementarities between items in the valuations employed, and the fact that the CCA auction is explicitly designed to mitigate the resulting exposure problem. Comparing these results to others reported in the literature, Porter et al. (2003) report average efficiency of close to 100% in their CCA auctions and Brunner et al. (2007) find an average efficiency of 90% for CCA auctions with high complementarities. Any differences from our results could come either from the selection of environments or from differences among the implementations of the CCA auctions. For example, Brunner et al. employ an activity rule where the number of items a subject can bid on is determined by their largest package bid in the immediately preceding round or by the number of items in that bidder’s conditionally winning bid (whichever is larger). Additionally, provisionally winning bidders were not announced. Since subjects bid on only a limited number of packages and these often included those which were most profitable at the current prices, we expect outcomes to be reliably efficient only when simulated auctions with similar behavior select efficient outcomes Table 5 explores this proposition, classifying auctions as Easy or Hard based on whether the simulations always achieved 100% efficiency (Easy) or did not (Hard). The numbers listed in parentheses under the auction classifications of Easy and Hard are the number of auction profiles falling into each
25
Unless stated otherwise, all statistical tests reported use nonparametric (two-tailed) Mann-Whitney tests.
23
category. These are roughly evenly split for the CCA4 auctions, with a few more Hard than Easy for the CCA6 auctions. All of the auctions classified as Easy have efficient allocations in which the two regional bidders split the items or the global bidder wins all the items. That is, not only are the relevant packages (in terms of Theorem 2) identified in terms of consistently being the most profitable packages, but they are also coincident with being the named packages for the bidders. Hard auctions include both auctions where relevant packages coincide with named packages, as well as auctions in which this is not the case: auctions in which the efficient outcome calls for each bidder to win at least one item or for splitting items between one of the regional bidders and the global bidder (and these packages are not consistently the most profitable ones). Note that simulated bidders are guided solely by prices, and not by the naming of packages. The ability of the simulations to predict experimental auction efficiency suggests that price, and not naming, is the mechanism through which real bidders identify relevant packages. [Insert Table 5 here] Average efficiency is significantly higher for Easy versus Hard auctions (95% versus 9192%) for both CCA4 and 6 (p < 0.01 in both cases).26 More dramatic yet are the differences in the frequency with which Easy auctions achieve 100% efficiency, averaging over 80% versus 40% or less for Hard auctions (p < 0.01 in both cases). Efficiency is substantially higher in Easy CCA auctions compared to the corresponding SAA auctions, with over 10% higher efficiency in both cases (p < 0.01 in both cases). The Easy CCA auctions achieve 100% efficiency substantially more often as well. Hard auctions are another matter, with average efficiency, as well as the frequency with which the auctions achieved 100% percent efficiency, not significantly different between CCA and SAA auctions in either case. As noted, relevant packages in the Hard auctions in Table 5 are not consistently the most profitable packages. However, in a number of cases, the relevant packages correspond to named packages and attract bids, thereby generating greater efficiency than found in the simulations and potentially contradicting any hypothesis that behavior in experiments is guided by price and profits alone. Table 6 looks for this, splitting the Hard auctions of Table 5 into two categories – Hard* and Very Hard – where Hard* consists of those Hard auctions where the relevant 26
Statistical tests comparing between CCA auctions in Tables 5-7 are all one-tailed because they are based on simulated outcomes with clear predictions. Non-parametric Mann-Whitney tests continue to be used for differences in means along with binomial tests for differences in frequencies.
24
packages correspond to named packages (Hard*) and where they do not (Very Hard). Table 6 also repeats the efficiency numbers for Easy auctions from Table 5 for ease of reference. [Insert Table 6] First, notice that average efficiency is substantially lower in the Very Hard CCA auctions compared to either the Easy or the Hard* auctions, as is the frequency with which these auctions achieve 100% efficiency (p < 0.05 in all cases). Further, these Very Hard auctions have lower average efficiency, and substantially lower frequencies of 100% efficiency, than in the corresponding SAA auctions (p < 0.01 in all cases). The Hard* auctions are much more comparable in terms of average efficiency to the Easy auctions than to the Very Hard auctions. They achieve slightly higher average efficiency for CCA4 than the Easy auctions (although this difference is not statistically significant; p > 0.10), and only slightly lower efficiency than Easy for CCA6 (p < 0.10). Hard* auctions achieve 100% efficiency less often than the Easy auctions, with the difference significant at the 5% level for CCA6, and just missing statistical significance (p = 0.102) for CCA4. Auction valuations in which the efficient outcome assigns zero items to the global bidder form another especially interesting group. These environments can suffer from a threshold problem in the CCA.27 At the same time, the SAA auctions pose an exposure problem for the global bidder. We had nine six-item auctions and eight four-item auctions of this sort. The threshold problem, which, as previously noted, was clearly evident in the individual bid data for losing regional bidders, appears to have impacted CCA auction efficiency to some extent as the regional bidders failed to win all the items in 20% (10/49) of the CCA6 and in 6% (3/48) of the CCA4 auctions. Interestingly, these appear to have posed an even bigger problem for the SSA, as regional bidders failed to win all items in 83% (48/58) of the SAA6 and in 52% (25/48) of the CCA4 auctions. This translated into substantially higher efficiencies in these CCA auctions than in the corresponding SAA auctions.28
Seller Revenues For a competitive-revenue standard for package auctions, we follow Milgrom (2007) in using the minimum seller revenue at any core allocation. The core for package allocation 27
In multi-unit, sealed-bid auctions, this is an issue as well, but for somewhat different reasons (see Cantillon and Pesendorfer (2007); also see Chernomaz and Levin (2007) for an experiment investigating this issue). 28 Average efficiency in these CCA6 (CCA4) auctions was 97.8% (99.0%) versus 91.4% (91.0%) in the SAA6 (SAA4) auctions (p < 0.01in both cases).
25
problems has a competitive auction interpretation: an individually rational allocation is in the core if there is no group of bidders who could all do better for themselves and for the seller by raising some of their losing bids. To enhance comparability, we report revenue in each auction as a percentage of the minimum revenue in the core. We report two findings about revenues. First, average revenue is higher in the CCA6 compared to the SAA6 auctions, but these differences are not large enough to be statistically significant at conventional levels. Second, and in stark contrast, average revenue is significantly higher in the SAA4 compared to the CCA4 auctions, averaging just over 100% of the minimum revenue in the core. Figure 5 compares average revenue between the two auction mechanisms for the four- and six-item cases. [Insert Figure 5 here] Using average revenue per auction period as the unit of observation, revenue is higher in 14 out of 17 of the SAA4 auctions compared to the CCA4 auctions (but barely higher in 3 of these auctions) and in 8 out of 19 of the SAA6 auctions compared to the CCA6 auctions. Pooling across the four- and six-item auctions, these differences just miss statistical significance at the 5% level under a two-tailed sign test. However, there appears to be a fundamental difference in revenue raised between the two auction formats as a function of the number of available items, so pooling may not be appropriate here. In 10 out of 17 of the SAA4 auctions, average revenue per period was greater than the minimum revenue in the core, compared to only 2 out of 19 of the SAA6 auctions.29 Part of the reason for this is that bidders, particularly the global bidder, frequently suffered losses in the SAA auctions (46% and 36% of the SAA4 and SAA6 auctions, respectively).30 The potential for an exposure problem is substantially more severe in the SAA6 auctions compared to the SAA4 auctions, particularly for the global bidder. It appears that this led subjects to bid more cautiously in the SAA6 auctions in order to avoid, or minimize, potential losses, resulting in lower revenue in the SAA6 auctions.
29
This rarely happens in the CCA auctions – occurring just twice, once in the four-item auctions and once in the sixitem auctions. 30 Our experimental design did not have any kind of bid withdrawal rule. The FCC’s simultaneous multiple round auctions allow a limited kind of bid withdrawal – a rule that was introduced amid controversy to mitigate the exposure problem. In the FCC, following a withdrawal, if no other bid is made for the license, then the bidder is still obligated to pay the difference between the withdrawn bid and the eventual sale price for the license, so the exposure problem, while possibly mitigated, is not entirely eliminated by this device.
26
Comparing revenue using each individual auction as the unit of observation, revenue is 91.8% (1.2%) of minimum revenue in the core for the CCA6 auctions versus 89.4% (2.4%) in the SAA6 auctions (p > 0.10). But average revenue is significantly higher in the SAA4 auctions than in the CCA4 auctions: 100.3% (2.1%) versus 93.9% (1.5%) (p < 0.01). There are no directly equivalent revenue results from other multi-unit auction experiments for comparison. Porter et al. (2003) do not report revenue comparisons between auction mechanisms. Brunner et al.’s (2007) normalization reports revenue as a percentage of the efficient allocation.31 They find that revenue is significantly higher in their version of the CCA auction than the simultaneous multi-round (SMR) auction employed by the FCC (the closest relative to our SAA auction). This contrasts with our results as revenues are not significantly different in the six-item case and are higher in the SAA in the four-item case. Their auctions involve bidding over more items than ours, include two global bidders competing over the same set of licenses, and, by withholding information about provisionally winning bids, may encourage more bidding. Their revenue results hold for both high- and low-synergy cases. However, this comparison is strained by the fact that they had a relatively large number of items left unsold in their SMR auctions.
Bidder Profits We measure total profits as a percentage of the efficient allocation and report two findings about them. First, average profits were essentially the same or higher in the CCA compared to the SAA. Second, global bidders earned lower profits on average than regional bidders in the SAA auctions, largely as a consequence of the losses they suffered from their greater exposure problem. Total profits were approximately the same between CCA6 and SAA6 auctions: 14.3% (0.014) versus 13.6% (0.025) (p > 0.10). However, total profits were substantially higher in the CCA4 compared to the SAA4 auctions: 20.2% (0.014) versus 10.5% (0.028) (p < 0.01). In both cases, global bidder profits were lower than regional bidder profits in the SAA auctions: 9.46 versus 20.86 ECUs per capita in the SAA6 auctions and -6.6 versus 15.63 ECUs per capita in the
31
Brunner et al. use actual revenue less the revenue from a random allocation in which bidders pay full value in the numerator and revenue from the efficient allocation less the revenue from a random allocation in the denominator, so that the difference lies in taking differences from average revenue resulting from a random allocation in both the numerator and denominator.
27
SAA4 auctions. In the CCA6 auctions, regional and global bidder profits were approximately the same: 15.64 for the global bidder versus 19.13 ECUs per capita for the regional bidders. However, global bidder profits were a little less than half that of regional bidders in the CCA4 auctions: 9.18 for the global bidder versus 18.75 ECUs per capita for the regional bidders. The fact that global bidders’ profits were lower than regional bidders in the SAA auctions is directly related to the greater exposure problem they faced, along with their relatively aggressive pursuit of the profit opportunities inherent in the synergies between items. Evidence for this lies in the fact that in 46.1% of the SAA4 auctions, global bidders earned negative profits compared to only 6.4% of the regional bidders, and 35.8% of the global bidders lost money in the SAA6 auctions compared to only 5.3% of the regional bidders. Our profit results stand in marked contrast to those reported in Brunner et al. (2007), where total bidder profits are lower, sometimes substantially lower, in the CCA compared to the SMR auctions. No doubt part of the reason for these differences has to do with our announcement of provisional winners following each round of bidding. Brunner et al.’s failure to reveal provisional winners should cause bidders to raise their own winning bids at least some of the time. In our design, bidders who do not raise their own provisionally winning bids could still “bid against themselves” by placing a bid that overlaps with their provisionally winning bid.However, this is unlikely to occur in later auction rounds when final prices are set.
Distance from the Core Table 7 reports distances from the core for both experimental outcomes and simulated auction outcomes, using a revised definition of Easy versus Hard. Auctions are categorized as Easy if, in the simulations, they achieve 100% efficiency and the scaled distance from the core is no greater than 15%.32 All other auctions, whether they achieve 100% efficiency or not, are classified as Hard. Raw distance from the core is defined as the maximum violation of one of the inequalities defining the core. The scaled distance is the raw distance divided by the difference between the full efficiency and efficiency resulting from randomly allocating items among bidders.
32
Results are robust to alternative definitions, such as the simulated distances from the core being no greater than 10%. None of the auctions achieving 100% efficiency also achieve zero distance from the core. Employing a criterion of simulated distance from the core being no greater than 5% yields two CCA4 auctions and one CCA6 auction, too small a sample for meaningful results.
28
For the simulated outcomes, the average scaled distance from the core is 5.0% or less for the Easy CCA auctions versus 24% or more for the Hard ones, with corresponding differences in the fraction of simulated outcomes achieving zero distance from the core. The experimental outcomes do not achieve the same magnitude of difference between Easy and Hard as the simulations, but the differences are in the right direction for both the four- and six-item cases. This difference is statistically significant at the 1% level or better in the CCA4 auctions. The difference between Easy and Hard is not as large in the CCA6 auctions, with average distance from the core significant at the 10% level or better, and percent of auctions with zero distance from the core significant at the 5% level or better. [Insert Table 7 here] Although by categorizing into Easy and Hard cases the simulation qualitatively predicts the experimental outcomes very well, it does not predict the levels accurately. Incorporating more details of bidder behavior into the simulation could narrow the discrepancy, but fine-tuning the bidder behavior model is not the main purpose of this paper. Even using the simplest behavioral assumption, the experimental results confirm the second hypothesis mentioned in Section II.
Rounds to Auction Completion The average number of rounds to completion was quite similar across auction mechanisms. CCA6 auctions required an average of 16.8 (0.44) rounds per auction versus 18.3 (0.62) rounds for the SAA6 auctions (with standard errors in parentheses). The CCA4 auctions required an average of 17.5 (0.62) rounds per auction versus an average of 15.3 (0.40) rounds for the SAA4 auctions. The one thing that does stand out in the data is that, not surprisingly, total bidder profits decrease systematically as the number of rounds in a given auction increase, regardless of which auction mechanism is used. For example, average profits of provisionally winning bidders decreased monotonically over rounds 1-5, 6-10, 11-15, 15-20 and 20 or greater in the CCA6 auctions, going from a high of 208.4 ECUs in rounds 1-5 to a low of 17.6 ECUs in rounds greater than 20 for global bidders, and from a high of 113.6 ECUs to a low of 22.9 ECUs for regional bidders.
29
V. Conclusions We have investigated when “standard” package auctions – particularly price-guided standard package auctions – lead to efficient or, more strongly, core outcomes in package allocation problems. Our analysis begins with two theorems asserting that if winning bidders bid most aggressively on their efficiency-relevant or core-relevant packages, and if losing bidders exhaust their profit opportunities, then the result is an efficient or core outcome, respectively. In principle, one way that bidders might bid aggressively enough on relevant packages is to bid equally aggressively on all packages, but that is not what we find. Bidders in our experiment typically bid on just the one or two most profitable packages and those packages often remained unchanged for many rounds during an auction. In our data, consistent with our theory, standard package auctions yield efficient allocations and core-level revenues most frequently when the packages that are selected by this sort of behavior are the relevant ones. This is tested by comparing the outcomes of our experiment to those of simple simulations, in which automated bidders bid only for the single most profitable package at each round. The outcomes from our experiment confirm the two hypotheses we formulated in Section II. Among several aspects of bidder behavior we characterized, subjects bid for many fewer packages than the profitable ones at the current round prices, and simulations based on such bidder behavior qualitatively help predict the experimental outcomes. Our finding that price-guided auctions can fail to direct bidders to relevant packages early enough in the auction suggests possible improvements to the auction design. One possible refinement is to make relevant bids more likely by making it easier to bid on more sets of licenses. That might be accomplished by implementing a richer bidding language than the XOR language of our experiment. Another potential improvement addressing the same issue is to allow bidders to add more bids at lower prices later in the auction when the relevant packages become clearer. The recent spectrum auctions conducted by the British Office of Communications (Ofcom) allowed “supplemental bids” at relatively low prices to be made at the
30
end of the clock stage of the auction, when identifying relevant packages was presumably easier.33 The theory in this paper was inspired by observations made in the course of designing a package auction experiment. Our experiment, in turn, selected auction valuations in an attempt to allow a test of the theory, as well as to explore the performance and limits of the CCA relative to the older SAA design. Our findings suggest reason to be optimistic that simple simulations can be used to predict the performance of alternative auction mechanisms in experimental settings. As emphasized in the introduction, the set of package auction environments is far too large to be convincingly explored with experiments alone. The simulation approach provides a predictive theory that offers the promise of generalizable conclusions. In our experiment, simulations proved valuable for distinguishing environments in which the CCA performs well from others in which it performs poorly. The simulations make specific predictions about outcome efficiency, revenue and the core. To the extent that these predictions are successful, simulations can become a powerful tool for designing practical auction mechanisms.
References Ausubel, Lawrence, Peter Cramton, and Paul Milgrom. 2005. "The Clock-Proxy Auction: A Practical Combinatorial Auction Design," in Combinatorial Auctions. Peter Cramton, Yoav Shoham and Richard Steinberg eds. Cambridge, MA: MIT Press. Ausubel, Lawrence and Paul Milgrom. 2002. "Ascending Auctions with Package Bidding." Frontiers of Theoretical Economics, 1:1, pp. Article 1. Bernheim, B. Douglas and Michael Whinston. 1986. "Menu Auctions, Resource Allocation and Economic Influence." Quarterly Journal of Economics, 101, pp. 1-31. Blumrosen, Liad and Noam Nisan. 2004. "On the Computational Power of Ascending Auctions." Brunner, Christoph, Jacob Goeree, Charles Jr. Holt, and John Ledyard. 2007. "An Experimental Test of Flexible Combinatorial Spectrum Auction Formats." Working paper. Caltech.
33
The Ofcom auction rules, which were proposed largely by Peter Cramton, combine the clock-proxy auction design of Ausubel, Cramton, and Milgrom (2005) with the minimum-revenue core-selecting auction of Day and Milgrom (2007).
31
Cantillon, Estelle and Martin Pesendorfer. 2007. "Combination Bidding in Multi-Unit Auctions." CEPR Discussion Paper 6083. Chernomaz, Kirill and Dan Levin. 2007. "Efficiency and Synergy in Multi-Unit Auction with Package Bidding: an Experimental Study." Day, Robert W. and Paul Milgrom. 2007. "Core-Selecting Package Auctions." International Journal of Game Theory, pp. 393-407. Goeree, Jacob, Charles Holt Jr., and John Ledyard. 2007. "An Experimental Comparison of Flexible and Tiered Package Bidding." Report to the FCC Wireless Telecommunications Bureau. Gul, Faruk and Ennio Stacchetti. 1999. "Walrasian Equilibrium with Gross Substitutes." Journal of Economic Theory, 87:1, pp. 95-124. Hayek, Friedrich. 1945. "The Use of Knowledge in Society." American Economic Review, 35, pp. 519-30. Hurwicz, Leonid. 1977. "On the Dimensional Requirements of Informationally Decentralized ParetoSatisfactory Processes," in Studies in Resource Allocation Processes. Kenneth Arrow and Leonid Hurwicz eds. New York: Cambridge University Press, pp. 413-24. Kwasnica, Anthony, John O. Ledyard, David P. Porter, and Christine DeMartini. 2005. "A New and Improved Design for Multi-Object Iterative Auctions." Management Science, 51:3, pp. 419-34. Milgrom, Paul. 2000. "Putting Auctions Theory to Work: The Simultaneous Ascending Auction." Journal of Political Economy, 108:2, pp. 245-72. Milgrom, Paul. 2007. "Package Auctions and Exchanges." Econometrica, 75:4, pp. 935-66. Nisan, Noam and Ilya Segal. 2006. "The Communication Requirements of Efficient Allocations and Supporting Prices." Journal of Economic Theory, 129:1, pp. 192-224. Porter, David, Stephen Rassenti, Anil Roopnarine, and Vernon Smith. 2003. "Combinatorial Auction Design." Proceedings of the National Academy of Sciences, 100, pp. 11153-57.
32
Appendix SAA Auction Defaults: Our initial set of SAA4 auctions required that bidders be proactive in each round to maintain their eligibility. That is, if no bid was made, the default bid was zero demand for all items. The result of the default bid was to drop that bidder from the auction. In looking at the data, we identified a number of cases where bidders reduced their eligibility, or dropped out of the auction completely, well before prices reached their standalone values. To the extent that such behavior is confined to bidders with low potential profits, it would be predicted to reduce revenues but have little effect on efficiency. To the extent that it extends even to bidders with high potential profits, it could also reduce efficiency. We conjectured that this pattern of bidding might be attributed to the complexity of the auction and the relatively short time bidders had to place a bid, combined with the default rule for maintaining eligibility. To test this and possibly correct the problem, we modified the auction procedures by changing the default. In the revised auction, the initial default bid was a bid for all items and the default bid in any round after the first was the bid placed in the previous period. In addition, bidders were notified when a new bid would reduce their eligibility and were required to confirm such a bid. These results are summarized below, with SAA40 denoting the auctions with the original default rule and SAA41 denoting the auctions with the revised default rule. 1. The change in the default bid had minimal impact on efficiency, with no significant differences in average efficiency between the SAA4 auctions where the default bid was zero on all items (SAA40) and the SAA4 auctions where the default bid was the bid in the previous round (SAA41). Efficiency was 86.2% (2.0%) for the SAA40 auctions versus 87.2% (2.0%) for the SAA41 auctions (p > 0.10) (with standard errors of the mean in parentheses). 2. Average auction revenue was substantially lower in the SAA40 auctions compared to the SAA41 auctions: 86.2% (1.5%) of minimum revenue in the core compared to 100.3% (2.1%) (p < 0.01). 3. Total profits were substantially higher in the SAA40 autions, averaging 21.3% (2.2%) of total value at the efficient allocation versus 10.5% (2.8%) for the SAA41 auctions (p < 0.01).
33
Table 1 Experimental Treatments Number of Subjectsa Session Session Session Session 1 2 3 Combinatorial Clock Auction (CCA) 4 items 22 20 18 (3) (9) (8) 6 items 19 18 16 (3) (9) (10) Simultaneous Ascending Auction (SAA) 4 items
21 (3) 21 (3)
6 items a
20 (9) 21 (9)
19 (8) 19 (10)
Number of auctions each subject participated in in parentheses.
Table 2 Percentage of Profitable Packages Bid on in CCA Auctionsa Global Bidders Regional Biddersb CCA 4 Overallc Most 2nd Most Overallc Most 2nd Most Auctions Profitable Profitable Profitable Profitable Rounds 1-5 22.3% 37.1% (3.0) 66.5% 35.0% (1.1) 66.5% 32.0% Rounds 6-10 20.9% 32.7% (1.5) 74.0% 21.5% (0.7) 58.0% 23.0% Rounds 11-15 19.8% 35.7% (0.5) 68.0% 23.0% (0.6) 61.0% 20.5% Rounds >15 27.9% 37.7% (0.2) 72.5% 10.0% (0.4) 64.0% 17.0% CCA 6 Auctions Rounds 1-5 Rounds 6-10 Rounds 11-15 Rounds >15 a
13.1% (7.8) 11.7% (4.1) 12.7% (1.0) 14.0% (0.3)
62.5%
38.5%
58.5%
30.0%
67.0%
30.5%
72.0%
19.0%
36.3% (2.4) 31.8% (1.7) 34.5% (1.0) 33.9% (0.6)
68.0%
45.5%
64.5%
43.0%
67.5%
39.5%
65.5%
32.5%
Rounds in which a bidder is a provisional winner and no bid is submitted are dropped from calculations. Otherwise bids of provisional winners are included. Data from last auction round are excluded as by definition there are no bids. b Only includes packages where all items had positive value for regional bidders. c Average number of bids in parenthesis.
Table 3 Scope for Profits at End of Auctions Bidder Type
Frequency Higher Profits were Availablea
Average Foregone (Potential) Profits in ECUsb
Global
4.5% (3/66)
12.0 (7.6)
Regional
24.4% (11/45) 11.8% (4/34)
10.3 (2.8) 15.0 (6.0)
Regional
5.2% (8/155)
5.4 (1.7)
Global
9.4% (5/53)
4.5 (1.3)
Regional
24.7% (19/77) 9.8% (5/51)
16.0 (3.4) 26.3 (6.9)
9.9% (13/131)
17.5 (5.0)
CCA4 Auctions Losing Bidders
Global Winning Bidders CCA6 Auctions Losing Bidders
Global Winning Bidders a b
Regional
Raw data in parentheses Standard error of the mean in parentheses. Eight outliers have been dropped from average foregone profit calculations, with minimum forgone profits of 76 and average forgone profits of 115.
Table 4 Package Bids in CCA Auctions when Named Package No Longer the Most Profitable Bida Regional Bidders CCA 4 Auctions
(number cases)
Named Package
Most Profitable
Both
Rounds 1-5
(16)
31.3%
68.8%
25.0%
Rounds 6-10
(126)
25.4%
51.7%
14.3%
Rounds 11-15
(98)
19.4%
60.2%
10.2%
Rounds 16-20
(35)
17.1%
51.4%
5.7%
Rounds > 20
(12)
16.7%
41.7%
0.0%
CCA 6 Auctions Rounds 1-5
(7)
28.6%
85.7%
28.6%
Rounds 6-10
(105)
57.1%
74.3%
40.0%
Rounds 11-15
(92)
37.0%
63.0%
25.0%
Rounds 16-20
(12)
33.3%
83.3%
25.0%
Rounds > 20
(9)
33.3%
44.4%
11.1%
a
Observations for which named package is not profitable are dropped. When a provisional winner does not bid, or the auction is in the last round, observations are dropped.
4-item auctions
6-item auctions a
Table 5 Outcomes in Easy vs. Hard Package Auction Outcomes (standard error of the mean in parentheses) CCA Efficiency SAA Efficiency Average Percent Auctions Average Percent Auctions Achieving 100% Achieving 100% Efficiency Efficiency Easy 95.4% 88.9% 81.9% 50.0% (9)a (2.1) (3.1) Hard (8)a
91.4% (1.6)
35.4%
92.8% (1.6)
50.0%
Easy (7)a
95.2% (1.8)
82.1%
83.5% (2.0)
28.3%
Hard (12)a
92.4% (1.2)
40.0%
90.7% (1.1)
32.5%
Number of CCA auction profiles
Table 6 Outcomes in Hard* vs. Very Hard Package Auctions (standard error of the mean in parentheses) CCA Efficiency SAA Efficiency Average Percent Auctions Average Percent Auctions Achieving 100% Achieving 100% Efficiency Efficiency Very Hard 89.7% 22.2% 92.9% 58.3% a (6) (1.9) (2.0) 4-item auctions
6-item auctions
a
Hard* (2)a
96.3% (2.3)
75.0%
92.3% (2.2)
25.0%
Easy (9)
95.4% (2.1)
88.9%
81.9% (3.1)
50.0%
Very Hard (6)a
90.8% (1.7)
21.2%
93.7% (1.6)
48.7%
Hard* (6)a
94.2% (1.6)
59.4%
87.7% (1.3)
15.8%
Easy (7)
95.2% (1.8)
82.1%
83.5% (2.0)
28.3%
Number of CCA auction profiles
Table 7 Simulated Outcomes versus Experimental Outcomes: Distance from the Core
Easy (8)a 4-item auctions
6-item auctions a
Auction Outcomesb Average Percent Auctions Distance Achieving Zero Distance 14.0% 18.8% (3.3)
Hard (9)a
21.9% (2.4)
3.7%
29.7% (20.4)
5.3%
Easy (5)a
18.6% (4.9)
10.7%
5.0% (5.1)
39.7%
Hard (14)a
20.5% (2.2)
2.6%
24.9% (14.9)
1.8%
Number of CCA auction profiles Standard error of the mean in parentheses c Standard error in parentheses b
Simulation Outcomesc Average Percent Auctions Distance Achieving Zero Distance 4.6% 44.3% (5.0)
Figure 4: Average Efficiency 4 items 100% 95% 90% 85% 80% 75% 70% 65% 1
2
3
4
5
6
7
8
9
10
11
12
13
14
15
16
17
18
19
6 items 100% 95% 90% 85% 80% 75% 70% 65% 1
2
3
4
5
6
7
8
9
10
11
Auction CCA
SAA
12
13
14
15
16
17
Figure 5: Average Revenue as a Percentage of Minimum Revenue in the Core 4 items 120% 110% 100% 90% 80% 70% 60% 1
2
3
4
5
6
7
8
9
10
11
12
13
14
15
16
17
6 items 120% 110% 100% 90% 80% 70% 60% 1
2
3
4
5
6
7
8
9
10
11
Auction CCA
SAA
12
13
14
15
16
17
18
19