QUEENSLAND’S VULNERABILITY TO RISING OIL PRICES
TASKFORCE REPORT
PREFACE In May 2005 the Honourable Peter Beattie MP, Premier and Minister for Trade established the Queensland Oil Vulnerability Taskforce (the Taskforce). The terms of reference and membership of the Taskforce are set out in Attachment 1. The Taskforce was asked to report on Queensland’s vulnerability to rising world oil prices driven by supply constraints including, but not limited to, the potential peaking of world oil supplies caused by natural field decline (peak oil). The Taskforce was chaired by Andrew McNamara MP, Member for Hervey Bay, assisted by Ms Rachel Nolan MP, Member for Ipswich. The Taskforce’s report methodology included desk-top review of published papers on world oil supply issues, consideration of detailed Australian data on proven and anticipated reserves of conventional and non-conventional energy sources, and an overview of current and emerging energy technologies. The primary focus of the Taskforce was to present the most likely time frame for peak oil, to assess its impact on the mining, transport and primary industry sectors and then recommend options to minimise the impact on Queensland of peak oil. The recommendations in the report of the Taskforce are preliminary and more detailed analysis including detailed modelling of the downstream impacts and substitution effects of the various proven and evolving alternative energy technologies will be a necessary next step.
Page 2 of 158
TABLE OF CONTENTS
EXECUTIVE SUMMARY................................................................................................................4 CHAPTER 1 - WHEN IS THE PEAK?...........................................................................................6 CHAPTER 2 - QUEENSLAND’S OIL VULNERABILITY .........................................................9 CHAPTER 3 – IMPACT ON VARIOUS QUEENSLAND SECTORS ......................................26 3.1
SECTORAL IMPACT ANALYSIS - TRANSPORT........................................................27
3.2
POTENTIAL IMPACT OF OIL SUPPLIES ON THE MINING INDUSTRY .............91
3.3
QUEENSLAND’S FOSSIL FUEL RESOURCES..........................................................97
3.4 SHORT, MEDIUM AND LONG TERM IMPACTS OF RISING OIL PRICES ON QUEENSLAND PRIMARY INDUSTRIES...............................................................................121 CHAPTER 4 – QUEENSLAND’S ALTERNATIVE ENERGY OPTIONS ............................139 CONCLUSION AND RECOMMENDATIONS .........................................................................154 1.
Reduce consumption of liquid fossil fuels .....................................................................155
2.
Encourage development and use of alternative fuels, technologies and strategies......155
3.
Prepare For Demographic and Regional Changes .......................................................155
TERMS OF REFERENCE ...........................................................................................................157
Page 3 of 158
EXECUTIVE SUMMARY This Queensland Oil Vulnerability Taskforce (the Taskforce) was assembled to address concerns that future world supplies of oil for energy may diminish, to the detriment of Queensland’s sustainable future, and that “peak oil” may be a world-wide phenomenon. Peak oil refers to the point when production in any oil well, field or region begins to decline. Typically, this point is reached when between one-third and one-half of the oil in a reserve has been extracted. The decline is the inevitable result of the loss of pressure in the oil reserve and despite the advanced drilling and extraction techniques now in use, is irreversible once passed. The Taskforce considered the issue of peak oil from a Queensland perspective. The Taskforce considered the question of whether and when world production of oil will peak. The range of creditable predictions for a world peak oil situation run from 2005 to 2040, with the mean and standard deviations of all academic and industry predictions being 2013, ± 7. The Taskforce concludes that the overwhelming evidence is that world oil production will peak within the next 10 years. It is noted that Australian oil production (but not necessarily, natural gas) has already peaked, as has that of the rest of the world, excluding the former Soviet Union and some Middle East OPEC members. The Taskforce also notes that the world oil market is becoming increasingly supplied from politically and/or socially unstable areas, such as from many OPEC and Middle East nations. This means that, regardless of the global peak oil issue, the risks of supply disruptions are rising. These two factors mean that oil prices could rise substantially at some point(s) in the future, especially given the continuing growth in world demand for oil and its products. The Taskforce considers this to be a major risk, with impacts arising not only for transport but for many key parts of Queensland industry and the community. In addition, it is clear from developments internationally that energy security is a key emerging issue. The European Union, United States of America and China have all been moving in the past 2 years to invest in new domestic and external sources of energy supply. The Taskforce considered Queensland’s and Australia’s reserves of crude oil, as well as supplies of alternative sources of liquid fuels including natural gas, coal seam methane, coal and oil shale. It noted the very substantial environmental and infrastructure costs inherent in seeking to rely on these resources to address Australia’s growing shortfall in liquid fuels. The Taskforce concludes that Queensland’s vulnerability to peaking of world oil supplies, and to world supply disruptions, is particularly acute given our oil supply and demand trends, as well as our regionally distributed population and industrial base. The potential impacts of low, medium and high price paths for oil on the mining, transport (including some industry, community and regional issues) and primary industry sectors are considered in the sectoral papers in this report. A number of significant vulnerabilities to any future high oil price conditions are identified.
Page 4 of 158
The Taskforce concludes that the alternative energy sources currently available have a combination of problems including volume constraints, substitution impacts, infrastructure costs and substantially higher costs than existing oil-based liquid fuel supplies. However it is also noted that some of these difficulties could be eased in the future as development proceeds and technologies improve – leading to possibly strong cost economies for some sources with increasing scale of operations. Accordingly, the Taskforce recommends that a prudent risk mitigation approach requires a mix of initiatives such as reduction in consumption of liquid fossil fuels, encouraging the development and use of alternative fuels, technologies and strategies, and preparation for demographic and regional changes, as Queenslanders change travel, work and living habits in response to rising fuel prices. In preparing this report, the Taskforce notes that there is no area of government that currently develops comprehensive policy for long term liquid fuel security. Responsibility falls between the legislative role of the Department of Mines and Energy in an emergency, pursuant to the Liquid Fuel Supply Act 1984 (Qld) and the regulatory and policy roles of various government departments including Premier and Cabinet, Treasury, State Development and Infrastructure, Transport, Mines and Energy, Primary Industries and Fisheries, Local Government and Planning, and Natural Resources and Water. The Taskforce recommends that a high level, whole of Government committee be established to develop a Queensland Oil Vulnerability Mitigation Strategy and Action Plan.
__________________________ Andrew McNamara MP Member for Hervey Bay Chair Oil Vulnerability Taskforce 5 April 2007
Page 5 of 158
CHAPTER 1 - WHEN IS THE PEAK? The construction of a curve showing the peak of oil production requires two separate components: (1) the size of the available resource (discovered and yet to be discovered), and (2) the demand. Resource Size A number of studies over the years have attempted to estimate the ultimate recovery of crude oil. The ultimate recoverable resource comprises historic production, remaining reserves and undiscovered resources. There is a wide range of estimates and this range has remained consistent over time. There are a number of reasons for the range of estimates. The historic production is the only part of the equation with a low level of uncertainty, although experts can not even agree on Saudi Arabia’s historic production. The initial estimates were for crude oil alone, some of the more recent estimates include gas liquids, so not all figures are direct comparisons. One major problem with the correct estimation of the ultimate resource is uncertainty over known reserves, particularly for the Middle East where the bulk of the reserves are found. By definition, reserves are imprecise as shown by the definition from the Society of Petroleum Engineers which is the most widely used. Reserves are those quantities of petroleum which are anticipated to be commercially recovered from known accumulations from a given date forward. All reserve estimates involve some degree of uncertainty. The uncertainty depends chiefly on the amount of reliable geologic and engineering data available at the time of the estimate and the interpretation of these data. Estimation of reserves is done under conditions of uncertainty. The method of estimation is called deterministic if a single best estimate of reserves is made based on known geological, engineering, and economic data. The method of estimation is called probabilistic when the known geological, engineering, and economic data are used to generate a range of estimates and their associated probabilities. Identifying reserves as proved, probable, and possible has been the most frequent classification method and gives an indication of the probability of recovery. Because of potential differences in uncertainty, caution should be exercised when aggregating reserves of different classifications. The problem with reserve estimates in the Middle East and some other countries is that there are no means of independently auditing the reserve figures. The level of uncertainty is increased when estimating the undiscovered resources. There are two main methods used: empirical and probabilistic. Both methods need quality data which unfortunately are not available for all areas. The empirical method (e.g. Campbell) uses the observation that, in any particular basin, the largest fields are found first with fields discovered becoming progressively smaller. This provides an estimate for the total resource from fields of that type in the basin. Other types of fields will have their own particular size distribution curve. The method works well in established basins, but not as well in frontier areas. The same methodology is applied to historic data to predict future discoveries. It is an inherently conservative methodology. The continual reassessment of the oil peak predictions made using this method is not a result of the method but of the quality of the data available.
Page 6 of 158
The best known of the probabilistic methods is that used by the United States Geological Survey. The USGS apply a probabilistic method to a geological model of petroleum generation and entrapment (the Petroleum System) to determine the undiscovered oil and gas. The figure they have arrived at is at the upper scale of estimates of ultimate recoverable resource (Figure 1). The methodology used is valid, but the results are only as good as the data used and the assumptions made. Both Campbell and the USGS used reserve and production data from Petroconsultants. The main differences are the concept of reserves growth used by the USGS and the way undiscovered resources are calculated. The growth multiplier used for reserve growth by the USGS is based on US historical experience, but can not be applied to newer fields or other regions of the world.
Figure 1 - Note that the USGS 95% probability figure is close to other estimates. When you allow for differences in what liquids are included, the Campbell figures and the USGS figures are very close (Graph from US Energy Information Administration). Although the USGS report was released in 2000 the assessment is from 1995. In the first 10 year period after the assessment, discoveries and reserve growth are consistent with the 95% probability data, not with the mean data. There has been reserve growth in some fields, but there have also been reserve reductions (e.g. Shell). The evidence suggests the 95% probability figures of the USGS should be used in assessing the peak (this, after all is the outcome with the most certainty). This moves the peak much closer to today. Depending on production increase and production decline values applied, the peak could be as early as 2010. Overall, in terms of the remaining resource availability, the data are not reliable for the reserves and the extent to which further discoveries will be made is uncertain. No prediction method offers a clear answer. New discoveries will not be easy to make or they would have already been found. Production costs are likely to be higher although there is still a large gap between production costs and crude oil prices. Page 7 of 158
Demand Demand will determine the rate at which the resource is used and this is controlled by many factors beyond the scope of this discussion. The Peak When will production peak? It will happen. The range of predicted peak years is from 2005 to 2040 (excluding low probability discoveries). It may plateau rather than peak as demand adjusts to supply. The consensus is that we will only actually know when it happens after the event. Whose assessment do we accept? They all have inherent uncertainties. If you take the published predictions made since 2000, the majority indicate between 2005 and 2010. The mean and standard deviation of all predictions gives 2013 ± 7. This, of course, ignores the economist view that the market will ensure a smooth transition to other fuels and that there will be no crisis. The empirical methods, because of their innate conservatism and data uncertainties, are being continually adjusted. This has resulted in some scepticism towards their predictions. The key to these methods, and to all predictions, is the Middle East and the assumptions made to estimate the total resource therein. The “Trust me/us” approach by Saudi Arabia invites scepticism also – their reserves may be political rather than real. The probability method gives figures that are overly optimistic at the mean and 5% probability level. Reserves growth may have been significant in the past in the American context, but modern technology has resulted in better initial reserve evaluations. Exploration in frontier basins will be the key, but to date most “new” exploration areas have failed to provide the level of discovery required. Given the time lag between exploration starting in new areas and significant production occurring, frontier areas are not going to contribute in the short term. It is also worth remembering that reserves have a vague commercial caveat in their definition, but a resource has no commercial aspect to its definition. It is not clear as to why there is such a focus on a peak year which we will only “see in the rear vision mirror”. It is a bit like waiting for a flood to peak or the cyclone to strike before taking protective action, or not planning for a hundred year flood. Demand will exceed supply, probably in the next 10 years. Why gamble on a date? The world is moving towards climate policies based on consensus views despite there being scientists that do not accept the consensus view. One way to deal with the oil situation is to accept the consensus that the peak will be reached within the next ten years and plan accordingly. If the peak is later, the transition will be easier. It is going to happen any way so why not start now and develop the policy frameworks needed. This is critical for Australia as we will progressively have to import more oil, or quickly and effectively move to different energy sources. Summary Given the inherent uncertainties in the data and the assumptions made in preparing the curves, the year of the peak can not be predicted. The overwhelming evidence is that world production will peak within 10 years. Australian production has peaked.
Page 8 of 158
CHAPTER 2 - QUEENSLAND’S OIL VULNERABILITY In 1856, whaling produced 20 million barrels of oil a year, driving the industrial revolution with illumination and therefore longer working hours. In 1857 the kerosene lamp was invented, using kerosene distilled from coal. In 1859 an oil well was drilled in Pennsylvania – and the modern world dependency on oil was born. 1 In 2005, world oil production averaged 83.6 million barrels of oil per day. 2 Crude oil literally greases the wheels of our economy. Its impact in every aspect of our lives is unparalleled by any other commodity in our society. By the time we notice the rising cost of fuel at the service-station bowser as we fill our vehicles, the ripples from the rising cost of a barrel of oil are already moving through our food chains, agricultural industries, medicine, clothing, housing and transportation. If it can be synthetically produced commercially (rubber, chemicals, plastics, dyes, inks, fibres, adhesives, paints) it will today, probably derive from the oil and gas industry. Crude oil is a society universal – an energy carrier, a lubricator, a chemical feedstock – our society depends on every part of the oil refractory column. THE FRACTIONAL USES of the fraction - mainly depends on its physical DISTILLATION OF CRUDE OIL properties methane gas fuel, C3-4 easily liquefied, portable energy source bottled gas for cooking (butane), higher pressure cylinders (propane) Fuel Gas, LPG, Refinery Gas easily vaporised, highly flammable, easily ignited, car fuel Gasoline, Petrol no good as a fuel, but valuable source of organic molecules to make other things, cracked to make more petrol and alkenes Naptha less flammable than petrol, domestic heater fuel, jet fuel Paraffin, Kerosene car and larger vehicle fuel Diesel oil, Gas oil not so easily evaporated, not as flammable, safe to store for central heating oil, quite viscous (sticky) and can also be used for lubricating oils, clear waxes and polishes Fuel and lubricating oils and waxes forms a thick, black, tough and resistant adhesive on cooling, used as waterproofing material and to sticks rock chips on roofs or road surfaces Bitumen
1 2
The Politics of Oil – Complete Idiot’s Guide To, Pg 51. World Energy Outlook 2006, Chapter 3, Table 3.2.
Page 9 of 158
Unchecked, a continuing dependence on crude oil has the potential to render our society vulnerable when supply is constricted – that is, when demand exceeds supply. The underlying issue of oil vulnerability is the reliance on a depleting, non-replaceable resource. Most geologists are agreed that crude oil is a non-replaceable resource. 3 To understand Queensland’s vulnerability in a constrained oil environment, we need to first understand where the most critical vulnerabilities lay. Oil as a transport fuel Oil is the single most important transport fuel. Two thirds (2/3) of all oil produced (and increasing) is used in the transport sector. As a result, oil remains the dominant fuel in both primary energy supply and energy mix, although its share in each has declined (this is a reflection of developed countries increasingly diversifying their energy mix as their energy demand grows, most commonly through gas and nuclear uptake). 4 The oil shocks of 1973-1974 and 1979 interrupted steady growth in energy demand in all IEA 5 countries resulting in significant oil substitution, generally away from stationary energy use of oil (electricity generation and heating). Consequently from 1973-1998 a significant reduction in energy to GDP ratio occurred. However, most of this decline is attributed to an overall decline in end use intensities, as a result of energy price hikes, and subsequent energy efficiency measures. After 1990, the rate of energy per GDP decline slowed in most IEA countries. Energy per GDP ratio: Energy per Gross Domestic Product (GDP) is a significant ratio used to assess the internal efficiency of energy consumption by a nation. Hence where the energy to GDP ratio is high, internal use of energy is not considered efficient, and conversely, where energy to GDP ratio is low, greater efficiency is per average unit of energy consumed. This measure is only one of a range of economic indicators considered in energy assessments, but the relationship tends to hold true for developed nations. Note that for developing nations this indicator has limited usefulness, as energy services and GDP are relatively decoupled, mostly driven by high energy inefficiencies. (Note it has been a policy aspiration at various times in Queensland and Federal Government to decouple emissions, particularly energy from our GDP, but on the basis of dramatic improvement in energy efficiency.)
There are two key messages here. The decline in use of oil by stationary energy industries (electricity generation, manufacturing, service and households), as a result of the oil shocks of the seventies, has offset growth in transportation oil use. Consequently, the primary oil supply returned to 1973 levels by 2000. This means that: •
all future growth in oil use in transport, unchecked, will result in high energy to GDP ratios, with growth in oil unlikely to offset any gains in energy efficiency by the stationary energy sector; and
3
The Energy Bulletin – 25 September 2006 30 Year of Energy Use in IEA Countries, International Institute of Energy, 2005 5 IEA countries – countries that are members of International Energy Agency – who are therefore required to maintain energy inventories, and annually report on their energy profile. IEA tends to only include developed nations as members – hence China’s absence of membership to date. Australia is a member. 4
Page 10 of 158
•
unlike the oil shocks of the seventies, where the stationary energy sector substituted out of oil, there are no immediate fuel substitutions for some key transport modes when additional oil shocks occur. All major transport fuel measures require a lead time of several years.
Passenger Transport Growth in passenger transport is undisputedly the biggest contributor to an increase in oil demand. Cars and aeroplanes account for most of the increase in IEA countries, with air travel the fastest increasing mode of travel from 1973-1998, almost tripling. Additionally, car ownership has more than doubled in many countries, although annual average travel per vehicle remained stable in most countries. 6 Hence although overall fuel intensities for all transport modes declined, thanks to a range of vehicle and fuel standards initiated by the oil shocks of the seventies, and fuel substitution for larger passenger vehicles, the decline isn’t nearly enough to offset growth in travel activity and a shift towards more energy intensive modes (cars and aeroplanes). Higher vehicle ownership in any one household with the average annual travel per vehicle remaining stable means that people are travelling the same distance as previously, but alone. Freight The rate of decline in average fuel intensity has slowed in the 1990s compared with the 1970s. That is to say that the impact of successive vehicle and fuel quality standard changes has had a decreasing effectiveness over time. This isn’t particularly surprising or unusual for any form of regulatory improvement based on successive standards. Any form of iterative improvement will eventually reach a point where the benefit is marginal and high cost. 7 However, since average car fuel intensity has declined (modestly) in most countries the real cost per kilometre of driving has also fallen since 1973, and particularly since early 1980s. Trucks Australia: Energy Intensity MJ-FFC / Tonne Kilometre (Source: Australian Transport Facts 2006) 5
Articulated Trucks Rigid Trucks
Energy Intensity: MJ-FFC / T Km
4.5 4 3.5 3 2.5 2 1.5 1 0.5 0
20
20
20
19
19
19
19
19
03
02
00
97
94
90
87
84
-0
-0
-0
-9
-9
-9
-8
-8
4
3
1
8
5
1
8
5
6
30 Year of Energy use in IEA countries, International Institute of Energy, 2005 30 Year of Energy use in IEA countries, International Institute of Energy, 2005
7
Page 11 of 158
Freight, however, is an end use sector with strongest relative growth in energy demand since 1973. In IEA countries, the freight sector’s share of total oil demand rose from 15% (1973) to 26% (1998). This increase in freight fuel demand is a direct result of demand shift towards trucking over rail and shipping. Trucking meets a societal demand for rapid transport. In summary, although fuel intensity per individual truck (truck/km) is likely to have decreased from 1973 there are more trucks on the road, generally operating with a decreased cargo in truck shipment. And, as the graph below shows, the total road freight task has been rising substantially – in terms of Australia’s tonne-kilometres. Trucks Australia: b Tonne Km 180
160
140
b Tonne Km
120
100
80
60
40
20
0
198485
198788
199091
199495
199798
200001
2002- 200303 04
Trucks 69.74
85.35
96.24
115
135
144.5
159.4 170.1
Australia, and more particularly Queensland parallel the international profile of shift in oil use. Queensland is the most regionally distributed population and industries base of all Australian States and Territories. Hence constrained access to liquid fuels significantly impacts on Queensland’s mobility and supply chains. We rely on the freighting of supplies between our regional centres, and regional centres to our cities. As a population base we are highly dependant on our vehicles. Oil vulnerability isn’t a new issue. The oil shocks of the seventies profoundly reshaped our stationary energy and manufacturing industries, with a rapid substitution away from oil, and improved efficiencies across all sectors using oil. “Peak oil” isn’t a new concept either. The Club of Rome propagated during the 1960s the world was running out of oil, followed by the publishing of M. King Hubbert’s first predictive model on future world oil production in 1969. The following facts are tended, as provided by oil industry publications: •
8
Light sweet crude oil production began declining in non OPEC countries in 2000, and declining in OPEC countries in 2005 8. This is a necessary component for heavy crude refining in most refineries throughout the world, to maximise the range of products available through refining; August 2005 OPEC Monthly Oil Report; Energy Bulletin, OPEC reveal global light sweet crude peaked.
Page 12 of 158
•
Ghawar, the world’s largest oil field, currently produces between 6-8% of the world’s total oil supply, from a region estimated to hold 60% of the world’s recoverable oil. Saudi Arabia has confirmed the use of horizontal wells (with water injection) in each of its oil fields 9. This type of oil drilling is usually only employed when free oil becomes sparse – i.e. when oil wells have peaked; and
•
Only three new oilfield discoveries in the last 30 years produce in excess of 200,000 barrels per day. 10
International Policies Are government decision makers around the world considering this issue? The following analysis examines the major users of oil and energy (both current and projected), and the significantly varied strategies for managing their oil vulnerability. United States (US) The policy status of the US in relation to oil vulnerability is remarkably deceptive. There are a number of stated policies, accompanied by mass media releases, with very little outcome or evidence of implementation. In direct contradiction, there are a range of unstated policies that are increasingly interpreted by the rest of the world as strategies to ensure US oil security. Both the stated and unstated policy influences of the US are important in assessing Australia’s position for two reasons: •
The US is the most influential body on international oil security (this includes OPEC); and
•
Australia’s oil and energy demand profile most closely resembles that of the US (of nations profiled in this section.)
Public Policy In the first instance, US public policy has dealt with oil in terms of transportation only – reflecting the automotive culture of the nation. The greatest focus on oil alternatives through public policy in this decade by the US (at a Federal level) has been hydrogen. In 2004, President George Bush launched the National Hydrogen Energy Roadmap – Towards a More Secure and Cleaner Energy Future for America (the Hydrogen Roadmap), on the premise that “…a child born today will drive a hydrogen car tomorrow” and “hydrogen will mean no more dependence on foreign oil”11.
9
Matthew Simmons, Twilight in the Desert, Pg 90. Matthew Simmons, The World’s Giant Oil Fields (paper). 11 State of the Union Address – George Bush, 2004. 10
Page 13 of 158
This policy is relatively unimplemented, with most progress through the work of private industry and progressive US State governments. Although significant government funding is provided for hydrogen work in the US (commensurate with investment in clean coal technology), most investment is focused on delivering a commercial hydrogen vehicle. In principle this is a reasonable, pragmatic approach – except that it ignores the greatest potential for hydrogen failure as an alternate energy system already identified by the Hydrogen Roadmap. The lack of parallel technology development for storage and distribution of hydrogen is a fundamental major obstacle for a hydrogen economy development. It’s worth noting that while the Hydrogen Roadmap identified resolving this issue as critical to the success of hydrogen, it provided no policy solutions or substantial initiatives to address the problem. Hence although committed to in principle, hydrogen is unlikely to shift demand away from oil in the US at anytime in the near future. The other major US oil countermeasure to date has been the continuation of farmer subsidy for ethanol production. Most subsidies are provided to corn farmers, and until the recent fuel crisis in the US, generally not promoted, and considered very much an “alternative fuel”. Although opposition to ethanol, as led by major petroleum companies, effectively stymied the broader uptake of ethanol, the markets are nevertheless well developed. Note that the recent fuel crisis in the US had led to one fifth of all corn supplies being redirected to ethanol production. 12 In stark contrast, the current United States Energy Strategy is silent on oil dependency. There are no measures discussed for reducing oil consumption, strategies to address cultural change or exploration of oil substitution/alternatives. Separate papers released on downstream oil focus on competition incentives – juxta positioning increased oil consumption. However, the US Department of Energy (DOE) funds a significant number of research activities associated with peak oil – including many world leading articles on the issue. These publications do not appear on the DOE website, and are explicitly written with no responsibility attributed to DOE. James Howard Kunstler, an energy futures journalist, suggests the connection between a large number of politicians and the oil industry appears to suppress any real public analysis of US oil policy in terms of security. 13 There is nevertheless a significant number of progressive States within the US, mostly driven by necessity (air quality, fuel shortage, energy blackouts, etc). California is perhaps the most notable, as it has •
introduced a range of vehicle based measures;
•
openness to a range of technologies/concepts, including promotion of renewable fuels;
•
stringent emissions standards;
•
synthetic diesel (from natural gas), Hythane; and
•
promoted efficiency driving practices, etc.
This approach of diversified options has been adopted by a number of progressive US States – most of which have also signed up to climate change action. 12 13
September 2006 Energy Bulletin The Long Emergency - Kunstler
Page 14 of 158
Since the writing of this section, President Bush announced during his State of the Union address on 25 January 2007, an initiative to reduce gasoline consumption by 20% over the next decade, by tightening fuel economy standards and producing over 35 million gallons of renewable fuels. However, the likelihood of implementing this measure in the current hostile environment between the US administration and US Congress is questionable. Unstated policies However the unstated policies perhaps give the greatest insight as to how vulnerable the US is to an extended oil crisis. Oil is traditionally priced in US dollars, providing tremendous advantage to the US economy. William Clarke, a California attorney suggests: “According to research by Dr David Spiro in 1974 the Nixon administration negotiated assurances from Saudi Arabia to price oil in dollars only, and invest their surplus oil in dollars only, and invest their surplus oil proceeds in US Treasury Bills. In return the US would protect the Saudi regime….These agreements created phenomenon known as “petrodollar recycling”. In effect, global oil consumption via OPEC provides a healthy subsidy to the US economy….Obviously the EU would also like oil priced in euros as well, as this would reduce or eliminate their currency risk for oil purchases.” 14 In this context, the motivations behind some of the international tensions between the US and various nations come into question, for example; •
Prior to the invasion of Iraq in 2002, the Iraqi Government converted all of its oil pricing from US dollars to euros. Iran shortly followed suit, converting half of its Central Bank assets to euros; 15 and
•
President Chavez stated Venezuela’s intention to convert oil settlement currency to either euros or a combination of euros and US dollars (2004/2005). In this time relations have become increasing strained between the US and Venezuela, as highlighted by the extraordinary speech by Chavez at the UN General Assembly on 20 September 2006, accusing the US President of “being a devil” and openly blocking the ascension of Venezuela onto the Security Council through vociferous attack. (Note President Chavez has made several statements attacking the US “oil addiction” and the lack of attention to its import problem).
The US bond and securities markets are currently trading at a national deficit of $450 billion per year, and a national debt of over $7 trillion. Should other oil producing nations switch to euros as standard oil currency, the value of the US dollar will crash on world markets (estimated at between 20-40%), with a resultant significant inflation. A consequent run on the markets and rush of bond and security holders out of the US dollar and into other currencies would also ensue. 16 17 It is not clear if, since gaining control of the Iraq oil industry, the US has insisted that countries buy Iraqi oil with the US dollar. It is also noteworthy that the countries that took a strong stance against the US war with Iraq also appear to have shifted their purchasing currency for oil from US dollars to euros, including France and Russia. 18
14
Peak Oil Paradigm Shift, Bilaal Abdullah. Peak Oil Paradigm Shift, Bilaal Abdullah. 16 Peak Oil Paradigm Shift, Bilaal Abdullah. 17 Politics of the Global oil industry, Toyin Galola and Ann Genova 18 The Complete Idiots Guide to the Politics of Oil, Pg 188-189 15
Page 15 of 158
The US is the world’s largest oil consumer, and is projected to require an additional 7.7 million barrels of oil per day by 2020 than it did in 2000. This is the equivalent of the oil currently consumed by China and India combined today – a total population of 2.5 billion people 19. Most consumers believe that OPEC controls the price of oil. However, as recently demonstrated by the latest oil discovery in Mexico, when the US feels secure the price of oil drops. Of the major oil companies, most are US owned. 20 The other point of interest here is the influence exercised by the oil lobby in the US Congress. Through substantive campaign donations ($150 million over the last 10 years), oil lobbyists have direct contact with congressional members and their staff, and have, in the past, provided draft legislation ranging from amendments to a complete bill21. When the US government makes decisions on oil and gas, the stakes are particularly high. European Union (EU) The EU has a significant history in attempting to address oil vulnerability – generally within environmental frameworks. However, past actions include: •
stringent fuel quality standards, that subsequently set the standard for the rest of the world;
•
vehicle emission standards (and the consequent international reputation for engine performance and standard);
•
push towards diesel over petroleum;
•
heavy promotion of biofuels; and
•
world leading for energy efficiency technologies (including transport)
The EU has publicly acknowledged its own energy vulnerability, particularly over the last five years. Limited endogenous energy supply (all forms of energy), and consequent high cost of imports underpin the principal drivers for energy efficiency – and this focus is reflected in European culture. In contrast to Australia and the US, high performance vehicles based around low emissions and efficient fuel consumption, and generally smaller packages are standard. The average age of the vehicle fleet for most of the EU (recognising that some of the more recent countries to join the EU are not as technologically developed as existing members) is younger than that of Australia or of the US, and vehicles are significantly more efficient. 22 (Note that even vehicles of comparable age with those of Australian or US cars are significantly more efficient because of the stringent fuel quality and vehicle standards). Energy efficiency in industry, business, and housing is (in many parts of the EU) well ahead of that of the rest of the world.
19
Peak Oil Paradigm Shift, Bilaal Abdullah. Energy bulletin 2006 – Peak Oil 21 The Complete Idiots Guide to the Politics of Oil, Pg 186 22 2005 World Energy Outlook, International Energy Agency 20
Page 16 of 158
Renewable energy policy The EU has instigated a range of renewable energy programs over the last 15-20 years, and while prescribed actions have been successful, voluntary uptake has only been “moderately successful”. Most of the policies are voluntary. 23 Policies for solar, wind, hydro, geothermal, biomass, biofuels, hydrogen and combustible waste are intended to assist meeting a 12% renewable energy target by 2010, and a 5.75% bio-fuel substitution target, also by 2010. Both voluntary targets are unlikely to be met. However, during March 2007, the EU agreed to a 20% mandatory renewable energy target, to be met by 2020. Developing relationships with producer countries One of the real strengths of the EU is its risk management approach to all aspects of its economy. As a super economy, the EU pools resources particularly, finance, research, and liberalised energy markets, enabling greater diversity in approaches to bring member countries up to comparable living standards. Although this slows the progression of energy innovation, the diversity of options appears to be strengthening the economic position of the EU. The high focus on sharing intellectual property (IP) and technology between member countries, while maintaining energy targets in both transport and renewable energy is progressing modernisation of living standards in the less-developed member countries quite rapidly. 24 The EU approach to oil vulnerability is not limited to alternative energy targets. High importance is placed on developing relations with producer countries, both established and emerging, including separate “understandings” with OPEC and Russia and support of countries on the Caspian Sea through the INOGATE program. For example, the EU has developed “an understanding” with OPEC, resulting in the EU-OPEC Energy Dialogue. At its third meeting in June 2006, specific actions agreed to included: •
further development of the proposal to establish an EU-OPEC energy technology centre, to launch joint cooperation and research on such issues as market stability, investment, workforce management and the environment;
•
a joint conference on carbon capture and storage to take place in Riyadh on 21 September 2006;
•
a round table on energy policies to take place in Brussels on 24 November 2006, focusing on the policies adopted or envisaged by the two groups relating to energy and the environment and energy transportation matters, and on how these may affect primarily the oil market;
•
a joint EU-OPEC study on investment needs in the refining sector and the role of the oil refining industry in oil markets, to be launched in the coming months; and
•
a joint event to take place in the first week of December 2006 on the impact of financial speculative markets on oil prices, involving representatives of the stock market and financial institutions, as well as the oil industry. 25
23
EU Risk Management Document 2005 EU Risk Management Document 2005 25 www.opec.org/opecna/Press%20Releases/2006/3OPECEU.htm 24
Page 17 of 158
Both the EU and OPEC face similar and growing challenges stemming from the need for security of supply and demand, large investments both upstream and downstream, and stable and predictable markets with reasonable oil price levels that are not damaging to either exporting or importing countries. While the actions mentioned above are all positive and important, the real influence of these dialogues includes the ability of the EU to negotiate for guaranteed security of supply at reasonable prices, as demonstrated during the first dialogue. 26 Strategies to minimise oil dependency However the EU is also employing a range of strategies to further reduce its dependency on oil, including: •
upward harmonisation on tax rates between member states;
•
balancing modes of transport, that is encouraging an overall shift away from Oil by revitalising railways (especially public) including competition; development of short sea shipping, port to port coast line movement, to reduce trends of last 20 years towards road haulage (freight accounts for over 80% oil use) greater infrastructure investment, particularly at European rail network bottlenecks, potentially funded by tolls on competing road routes; potential rationalising of private cars in city centres; reducing tax advantages for air transport to encourage greater demand for rail; greater substitution for oil – how has not been discussed to date, (although a green paper is expected shortly); and increasing strategic oil stocks to further limit price volatility (the understanding with OPEC being part of this option).
As previously stated, the EU maintains a focus on risk management, and appears to be spreading this risk with a highly diversified range of options. This approach, while not liberalising the economic growth rates of the US or more particularly China, does however indicate strong economic growth, and less exposure to a crashing market. The EU economy is considered remarkably stable, despite the fact that it is heavily dependant on exogenous energy supplies, and not just oil. China China is a difficult country to accurately represent in today’s market. While the country is industrialising at a rapid rate, all that the rest of the world knows on its energy profile is through educated guesswork, often based on media announcements through external investors. Given the rapid rate of energy infrastructure development (one coal fired power station built every two to three weeks), it is not clear that China can accurately map its energy profile. China is acquiring a highly diversified energy technology profile to match its rapid industrialisation. Very little information about China’s energy profile is published other than through international print media. The public accountability mechanisms for the Chinese government vary significantly from Western Governments.
26
http://www.euractiv.com/en/energy/eu-opec-try-talk-oil-prices/article-140786
Page 18 of 158
However, there are a few things that we can discuss with some certainty. There is a growing consensus that China’s economic growth must slow soon, or the bust following the boom will destabilise global economies – particularly oil dependant economies. 27 As part of riding economic growth, China has heavily invested in every form of energy, including relocation of Australia’s foremost renewable energy companies. Investment in coal and coal contracts, petroleum and gas are comparably high, with nuclear energy featuring particularly high on China’s agenda. This has naturally led to a strong interest in hydrogen technologies with a number of Australian experts indicting informal or indirect approaches on various hydrogen projects. In a word, China is hungry, and is actively exploiting every opportunity to move the nation from “developing” to “developed”. As the second largest consumer of oil as of 2005, the lack of an energy profile for China is a major cause for concern. There is no system for comprehensive data collection on energy use and inventories. Energy inventories are critical for managing bottlenecks in supply. Hence without them, there is no indication of where oil is needed most, or if there are adequate reserves. A lack of planning or full disclosure by China can quickly constrain international oil supplies, particularly as China is believed to now import one third of its total oil supply. (Note that China caused some particular discomfort to the US when it bought an oil supply that the US accesses 1% of its own supply from). Teapot Refineries Part of the mystery surrounding China’s energy profile is the distortion of demand by Chinese “teapot” refineries. These independent refineries (i.e. outside control of the Chinese oil majors), are approximately one tenth the size of a full scale refinery and have no access to endogenous crude supplies. Consequently, these refineries import straight fuel oil – a cheaper, unblended, sour crude to produce low specification diesel, bitumen and residual. Refinery capacity is usually around 10,000 barrels per day, with an estimated total figure of 700,000 barrels of product produced per day throughout China, although this figure is considered to more likely represent a lower limit, as there is currently no means to confirm. In contrast, Australia’s total refinery output is between 500,000 and 700,000 barrels per day. Teapot refineries are officially considered a significant threat to the country’s energy security, but continue to operate, as they are essential to farmers, fishermen and private companies (dependant on electric generators for summertime air-conditioning) during peak demand. These independent refineries are embedded in their local economies, providing employment for the community and revenue for local governments. However liberalisation of China’s downstream petroleum market is considered the most likely driver to remove these refineries, as competition increases for greater efficiencies. 28 Spikes in China’s imports of fuel oil are likely the result of increased production at teapot refineries.
27 28
Energy Bulletin - 2006 11 October 2006 Oil Market Report, International Energy Agency, 2006, Pg 12
Page 19 of 158
Political unrest In the middle of unchecked energy growth is a potential crisis, skimming close to the surface. China is highly unstable, brought on by the widening gulf between the rural poor, and the modernised (energy based) urban middle class – the widest since the forming of the communist state. Rural unrest has grown from 13,000 protests a year to 87,000 protests in 2005 – and is recognised by economic experts the world over as the most likely cause to rip the Chinese economy asunder, particularly as 136% of China’s GDP is based on loans. This prospect is considered to increase global oil vulnerability. However, ABARE reports 29 that in the first nine months of 2006, China was estimated to have increased its crude oil consumption to 7.0 million barrels a day, an increase of 7.2%. There is also some market speculation that the Chinese government will move towards a market-based pricing scheme for oil, sending substantial price signals to the Chinese market. Given that the current price of oil is lagging behind international price volatility, harmonising with international pricing is expected to lead to slower demand growth. Supply and Demand Management In addition, the Chinese Government is implementing internal measures to constrain oil usage in the middle class, by introducing a tax of 27% on the price of domestic vehicles with large engines, most notably sport cars and sports utility vehicles (SUVs). This single measure is of far wider reaching consequence than any measure implemented in the Western World to date. (Note that the US taxes light duty trucks, but exempts SUVs, pickup trucks and minivans – directly correlating with the shift away from cars to these types of vehicles). China evidently does recognise its oil vulnerability, and is consequently considering all avenues of risk minimisation – including synthetic fuel production. The fifth largest coal producer in the world, Shenhua, has signed an agreement with Royal Dutch Shell and Ningxia Coal Industry to build a coal liquefaction plant, with an output of 3 million tonnes of synthetic oil in its first phase of production. Note that the recent release of World Energy Outlook 2006, published by the International Energy Agency, highlight’s China’s energy supply, demand, and emissions have grown substantially faster than in previous projections, bringing forward projections for decreased availability of resources. In effect, China’s unchecked growth is creating some considerable urgency about future access to resources. For Australia, this will mean oil. India India is also a difficult country to profile, as it is not a member of the International Energy Agency. More critically, until China’s recent economic surge, India was considered the developing nation most likely to destabilise the global energy economy as it transitions from “developing” nation to “developed” nation. However, unlike China, India’s economic and energy development, while still strong, has developed at a more moderate, considered pace, and possibly with a greater awareness of the potential to work with international bodies to transition into a stable, secure energy-based economy.
29
ABARE, Australian Commodities, Volume 13 No 3, September Quarter 2006, Pg 506
Page 20 of 158
India meets over 70% of its oil consumption through imports, providing greater transparency in oil use (compared with China). However, growth in oil consumption is currently outpacing GDP growth. As India’s rate of increase in total energy consumption is substantially lower than its GDP growth (2.3% compared with 4.7%, as at 2004) 30, it is possible that oil consumption may distort the total energy profile. However, it is evident that unmitigated growth in India’s oil consumption in parallel with China, will inevitably cause interruptions in the crude oil supply chain in the future, and significant price spikes as a result. In addition, India’s endogenous oil supply appears to be stagnating, with imports projected to increase to 85% by 2010, and to 92% by 2020 31, and vehicle penetration (i.e. personal cars) is expected to double between the period of 2002 and 2030. In view of these figures, India has indicated some desire to develop oil security planning, with considerable intervention by the International Energy Agency. Energy penetration There is also a range of positive energy trends emerging from India at this time. The uptake of natural gas is higher than for any other fuel uptake, and predominately in the electricity sector. India also has substantial coal reserves. Latest IEA projections 32 suggest that of the 55% increase in global emissions projections between 2004 and 2030, half of the increase will derive from new power stations, mostly using coal, and mainly located in China and India. The other notable development in India’s energy portfolio is the potential development of thorium for nuclear energy. India has substantial thorium reserves, and as thorium lacks potential as nuclear weaponry fuels, there appears to be international support for this approach. 33 It isn’t clear how this new development will affect India’s projected rate of growth for energy consumption, but early indications suggest positive technology spin offs, including hydrogen vehicles. The domestic Scene - Australian Policy According to the Australian Institute of Petroleum (API) 34, Australia has sufficient endogenous oil resources to meet Australia’s domestic demand, and supply some export. Only 40% of Australia’s oil supply is met from endogenous resources. Australia produces a light (sweet) crude oil, the most volatile and useful component of crude for petroleum production. However, Australia’s refineries are set up to refine a heavier form of crude – essentially a blend of sweet and heavy, to produce a wider range of products to service all of Australia’s oil based needs. Hence Australia’s crude is exported as a high value product, in a market of constrained international sweet crude supply. In addition, imported heavy crude is considerably cheaper than Australian sweet crude oil. It is also worth noting that the peak petroleum and exploration body for Australia has reported Australia’s oil production as peaking in 2000. This means Australia’s supply to the world market is decreasing. 35
30
World Energy Outlook 2004, International Energy Agency, 2004. World Energy Outlook 2004, International Energy Agency, 2004. 32 World Energy Outlook 2006, International Energy Agency, 2006. 33 Article – Media Statement, International Energy Agency, 2006. 34 Crude Oil Pricing – www.aip.com.au/pricing/crude.htm 35 Key Statistics 2005, Australian Petroleum Production and Exploration Association Ltd. 31
Page 21 of 158
National ownership Unlike most countries with oil resources, Australia does not have its own national oil company. All oil export and import is through multinationals. Although multinationals may have Australian divisions, these are not Australian companies. The significance of this critical difference remains to be seen. However, there are some key implications: •
Australia’s high value oil product is exported off-shore, with modest revenue returned to the country;
•
the presence of multinationals in Australia gives the appearance of oil security only, as the principal focus of multinational presence in Australia is refining and distribution of imported supply (where multinational representatives have regularly informally recognised that they don’t need to refine in Australia);
•
Australia is highly dependant on the oil relationships effected by multinationals to ensure ongoing security of supply; and
•
any attempt by Australia to regain control of its oil resources would result in Australia considered to be high sovereign risk – and relatively ineffective, given that production has peaked.
The International Energy Agency, in its recently released World Energy Outlook 2006 highlighted that access to much of the world’s remaining oil reserves is highly restricted – with dominant access through national oil companies.
Access to oil reserves
Concession 30%
Iraq 9%
Production sharing 11%
National companies only 37%
Limited access, national companies dominant 13%
Adapted from World Energy Outlook 2006, International Energy Agency, November 2006. Government influence Government influence on crude oil is exercised through: •
a modest Royalty paid at the time of extraction (to either a state or federal government agency, depending on the jurisdiction of extraction);
Page 22 of 158
•
fuel quality through the National Fuel Quality Standards Act 2000;
•
excise through the Excise Act 1901 and the Excise Tariff Act 1921;
•
(in Queensland) mandatory Reid Vapour Pressure (RVP) regulation through the Environment Protection Act 1994
•
(in Queensland) the Liquid Fuel Supply Act 1984; and
•
formal and informal advocacy with multinational Australian division CEOs (such as the Downstream Petroleum Agenda, and the ethanol meeting of 2006).
Government influence is restricted to tinkering at the edges of the downstream product. It is also worth noting that there is less jurisdictional power exercised when post-refinery fuel is imported. The Australian Government appears only to negotiate for the exploration of oil and gas resources – there is no evidence to suggest that negotiations occur with oil-producing nations to stabilise Australian fuel security. Arguably, if we have sufficient petroleum resources to meet our domestic needs, there is no need to negotiate abroad – and even if we can, there is no reason for oil majors or independent fuel importers to import based on Australian Government negotiated contracts. As Australia produces sweet crude, in an internationally constrained sweet crude market, there is potential for greater extraction rates to be required on Australian resources. Note that Australia is reported internationally as managing its oil risk “by supporting competitive pricing and cooperation with the oil majors.” 36 No other oil-producing nation appears to rely on this approach. In fact Australia’s refinery industry is currently at risk from competition with neighbouring Asian countries such as Indonesia, which operate larger and cheaper refineries. Losing refineries from Australian shores further diminishes fuel security – and quality. Hence Australia’s diplomatic relations around the world are increasingly important to fuel security. Vietnam at 12% was Australia’s largest supplier of imported crude in 2000-2001, with 18% supplied by Middle Eastern countries 37. The Federal Government’s view on oil security is ambiguous. In 2005, the Federal Government released the paper Is Oil Running Out, examining oil-availability. The paper’s final position suggested Australia’s oil future was secure. During peak oil prices of 2006, Minister McFarlane (Minister for Industry, Tourism and Resources) conceded that oil resources world wide are increasingly constrained. There is a general sense that the Federal Government is moving towards a position of concern, but little indication of action beyond this.
36 37
Oil Supply Security – The Emergency Response Potential of IEA Countries in 2000, IEA. Crude Oil Pricing – www.aip.com.au/pricing/crude.htm
Page 23 of 158
Senate Inquiry However, the Senate Inquiry into Australia’s Future Oil Supply and Alternative Transport Fuels, tabled 7 February 2007 recognises “Peak Oil” as a fundamental risk management issue, where Australian Governments clearly require better information to “decide a prudent response to the risk”. 38 The Senate Inquiry lists a range of recommendations, including demand-side management, public transport support, increased supply of biofuels, review of official estimates of oil supply and review of tax incentives (salary sacrificing) on vehicles. The Federal Government response to this report has not been tabled at the time of writing this report. Queensland’s Policy Environment Although oil constraint places pressure on a range of sectors, transport is undisputedly the most vulnerable sector in Australia, with Queensland more vulnerable than most states to constrained oil supplies. With approximately a third of Queensland’s population regionally dispersed, reliance on oil translates to: •
a high dependency on personal vehicles, road freight and air travel to cover the significant distances between townships and economic centres;
•
a disproportionately high (compared with other States) dependence on diesel generation to meet remote area power needs, directly attributable to the size and extensive industry development of the State;
•
a fuel intensive tourism sector, directly attributable to the size of the state, and distance between critical tourism attractions;
•
substantial inefficiencies in transport-dependent supply chains (e.g. centralising of produce in Brisbane before returning products to retail outlets in North Queensland);
•
disproportionate transport infrastructure costs required to maintain connection between townships and economic centres; and
•
substantially increased multiplier effects on local economies as the cost of oil rises.
In addition, Queensland cities are characterised by urban sprawl, often with less sophisticated public transport networks than in some other States. Housing affordability increasingly forces lower-income Queenslanders to the outer edges of the urban sprawl, which conversely has least access to public transport options. Hence the potential for these areas of population to be stranded as a result of an oil crisis is significantly high. Although Queensland has legislative powers (Liquid Fuel Supply Act 1984) to assume control of the two Brisbane refineries in the event of an oil crisis, emergency planning (including fuel rationing) is based on short-term constraints. Implicitly, there is an expectation that any long term emergency fuel crisis will be seen in advance, and planned for appropriately. However, no amount of legal ownership of refineries can produce products if there is no oil to refine. Even strategic reserves would only provide a short term fix – and this option has been resisted at a State and National level because of management implications.
38
Senate Inquiry into Australia’s Future Oil Supply and Alternative Transport Fuels, tabled 7 February 2007, Executive Summary
Page 24 of 158
Queensland is the third largest State-consumer of oil in Australia – with an elastic correlation between population and oil consumption. Given Queensland’s continued economic growth and population expansion is expected to place Queensland as having the second largest population of the States, and being potentially the second largest oil user, Queensland’s vulnerability to oil constraint is sharply apparent, and likely to become more significant in Government planning.
Page 25 of 158
CHAPTER 3 – IMPACT ON VARIOUS QUEENSLAND SECTORS Papers contained in this Chapter were prepared by the following Departments. 3.1 – Sectoral Impact Analysis – Transport (Department of Transport) 3.2 – Potential Impact of Oil Supplies on the Mining Industry (Department of Mines and Energy) 3.3 – Queensland’s Fossil Fuel Resources (Department of Mines and Energy) 3.4 – Short, Medium and Long Term Impacts of Rising Oil Prices on Queensland Primary Industries (Department of Primary Industries and Fisheries)
Page 26 of 158
3.1
SECTORAL IMPACT ANALYSIS - TRANSPORT
Introduction This report has been prepared for the Queensland Oil Vulnerability Taskforce, established by the State Government and reporting to Cabinet through the Minister for Natural Resources and Mines. The report provides basic facts about the transport sector in Queensland. It sets out key impacts of possible oil market changes on the transport sector in Queensland, and also on those involved in or depending on transport to any extent. It then concentrates on areas of potential vulnerability – for the industry, its users etc; and then on flow-on impacts. It also touches on potential opportunities for those involved and some key policy issues. The report has been prepared by Mr John Chapman, the nominee by Queensland Transport to the Taskforce, reporting directly to the Taskforce, as requested by the Taskforce Chair. •
Accordingly, it does not necessarily represent the views or position of Queensland Transport or its senior executives, or of the Queensland Government.
Every care has been taken to ensure that the report is as professionally and factually based as possible. And references are provided wherever possible to set out the basis of the points advanced. Energy futures, scenarios & risk assessments It is not the purpose of this paper to present forecasts or projections of the world oil market in the future. Historically, forecasting of this market price has been hazardous for many participants in the sector and for many major forecasting firms and agencies. There are many reasons for that, e.g.: •
One is that it is a market subject to strong interest and interventions from time to time by governments.
•
Another is that the quality of data for oil reserves is poor, and impaired to an extent by commercial and/or sovereign secrecy issues.
•
Also, and especially for many developed countries, key petroleum products have come to be viewed as 'necessities', which has meant that demand has become more 'inelastic', and which increases the possibility of strong swings in prices over short to medium term time periods.
One illustration of the hazards of forecasting is the recent record of the US Energy Department, Energy Information Administration (EIA). The EIA is the major energy forecasting agency for the US Government.
Page 27 of 158
The change over one year recently in the EIA's projections is depicted below, in $US terms. Figure 1 - US Projections of the World Oil Price
http://www.eia.doe.gov/oiaf/aeo/index.html Source: Energy Information Agency (2006), '2006 Annual Energy Outlook', Energy Information Agency (EIA - an independent statistical and analytical agency within the U.S. Energy Department).
The change in the projected level of prices in the future in the EIA's most recent report is major – approximately 60%. In this report, scenarios are used to illustrate possible future price paths for oil, in 'real' or 'inflationremoved' terms, in the future. The 3 scenarios are Low Oil Price, Central, and High. These scenarios are not to be interpreted as forecasts or as projections. They have been developed merely to illustrate the consequences of several possible market circumstances in the future. And note also that the 3 scenarios do not represent the full range of possible future price paths and supply instabilities. •
For instance, it is possible that higher prices than those set out in the High Oil Price scenario may occur, either on a long term basis, or more especially for shorter periods (for example in times of continuing strong world demand growth, or severe supply difficulties).
Page 28 of 158
•
Also, it is possible that lower prices than those of the Low Oil Price scenario may occur, especially in any times of international recession.
•
In addition, it is quite possible in the near term (~1 to 3 years), that there may be high prices, perhaps higher than the recent peak of $US75 / barrel; and perhaps followed by some weakness as economies and energy supply systems adjust i. However these possibilities are not addressed further in this paper.
Nevertheless, the 3 scenarios have been chosen following careful inspection of the past record of world prices and of a range of external forecasts and projections by various firms and agencies round the world. Consequently they may all be regarded as potential, possible scenarios for the future, and as such carry a range of risks and implications which need consideration. Table 1 Assumed Scenarios for Future World Oil Prices (Light Crude) Scenario Item
World Average Oil Prices, $US / Barrel (a)
World Oil Market Volatility
Low Oil Price
Central Oil Price
High Oil Price
Prices ease from an average $US54 / brl in 2005, to:
Prices average $US58-60 / brl, from 2005 to 2015.
Prices rise from an average $US54 / brl in 2005, to:
~$US35/40 by 2050 (*).
Prices rise after 2015, to ~$US70-80 by 2050 (*).
~$US110-115 by 2050 (*).
Market volatility lower than in Central case.
Market volatility higher than in the past decade.
Market volatility much higher in future.
But still present, due to the locations of export supplies & political changes.
Some periods of political instability disrupt export supplies.
OPEC dependence is high. Supply & political instabilities are occasionally very severe.
(*) Note: price instabilities around this scenario are described under: World Oil Market Volatility. (a) Composite crude oil costs to US refiners; source US Energy Information Administration. Prices are in real terms – real 2005 prices, $US. i
For instance, the executive director of the International Energy Agency has stated that crude oil prices (already over $US70 a barrel) would remain high until the end of the decade, as investments to increase supply of oil and refining capacity would not kick in until 2010 at the earliest. But he was not forecasting the prices would reach any specific level, certainly not $US100 a barrel; and the price of oil would be determined by how much demand was controlled in the short term ahead of the benefits of investments in supplies. The Australian (2006), 'Price fuels energy debate', 9 May. See also: Australian Financial Review (2006), 'Crude price may hit $100, says insider', 8 May.
Page 29 of 158
Figure 2 - Three Scenarios for World Oil Prices World Oil Prices - 3 Scenarios $120.00
Real Price $14.12 $13.97 LOW
Real Oil Price ($US2005, USA)
$100.00
CENTRAL HIGH
$80.00
$60.00
$40.00
$20.00
45 20
30 20
15 20
00 20
85 19
19
70
$0.00
Basic Facts – Transport in Queensland Size and Value Transport is a major system supporting the Queensland economy and community.
Page 30 of 158
It ensures that people can access basic goods and services, communities can function, industries can operate, and internal and overseas economic activities can progress. •
Most industries, sectors and communities in Queensland depend on some part(s) of the transport system for their continued operation. The benefits of efficient transport are widespread, enabling our modern economy to function efficiently and providing the mobility and access that people need. Queensland’s transport system contributes to quality of life and supports economic growth. The transport sector supports industry and stimulates employment throughout the state. The sector also directly supports employment in regional Queensland, with road construction and other transport activities making a key contribution to local economies and community life. Transport supports the economic, trade and regional development performance of Queensland. Manufacturing, resource industries and the service sectors rely on an efficient transport system to remain competitive nationally and internationally. For exports and industry: -
an effective and integrated transport network of roads, railways, ports and airports is critical to their costcompetitiveness; the transport network enables Queensland to market its natural assets (including tourism-based assets), based on their ease of access; an effective and efficient transport network widens the sphere of employment opportunities within, across and between regional areas.
People in Queensland rely on access to a good transport system to maintain their quality of life: -
the transport network provides links to the wider community and increases access to services such as health and community services, education and employment; Queensland’s transport system offers choices, such as walking and cycling, that provide flexibility as well as significant health and environmental benefits; public transport reduces traffic congestion, crashes and pollution and enables people who would otherwise have limited mobility to participate more fully in community life.
Source: Queensland Transport and Main Roads (2005), 'Connecting Queensland. Transport Coordination Plan for Queensland. 2005-2025'.
Transport is also a major sector in financial terms. The value of transport consumption (private final consumption expenditure) in Queensland in 2004-05 was $11.2b; or 9.1% of total private consumption. Total factor income for the Queensland transport and storage industry sectors was $7.0b in 2004-05, 4.9% of the all-industries total. ABS, 'Australian National Accounts: State Accounts, 2004-05', 5220.0.
Total State government level investment in transport in 2004-05 was $5.8b, including: •
$2.8b in capital expenditure, and $3.0b in operating expenses.
Queensland Transport and Main Roads (2005), 'State Budget 05-06. Budget Highlights'.
There are other assessments of the value of transport in the Australian economy.
Page 31 of 158
For instance, Allen Consulting Group has stated that the resources consumed in using the road transport system, alone, were some $A135b pa, or ~19% of GDP. And use of sea, rail and air (including overseas activity) was some one third of that for road transport as well. The Allen Consulting Group (2003), 'Benefits of Public Investment in the Nation's Road Infrastructure'; prepared for the Australian Automobile Association.
The value of the real net capital stock for transport and storage in Australia in June 2005 was $195.8b. •
$A41.2b in machinery and equipment; and $A152.3b in construction (infrastructure, nondwelling).
ABS, 'end-year net capital stock' (Table 88, Industry by type of asset), 5204088.
ABS does not supply the state / territory components of this data. However, assuming that Queensland has a share of 22% of that figure, the Queensland value might be ~$A43b. •
The replacement value of the State controlled road asset, alone, is some $25b.
Source: Queensland Transport and Main Roads (2005), 'Connecting Queensland. Transport Coordination Plan for Queensland. 2005-2025'.
•
And substantial capital has been invested in rail lines and facilities; plus sea ports; airports; and rolling stock and storage systems (by both governments and private firms).
•
Data from the Queensland Transport and QR annual reports for 2004-05 indicates that the depreciated value of infrastructure assets other than roads owned by those agencies was some $7.9m (including bridges, busways, public transport and maritime facilities).
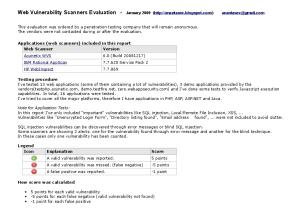
There are many parties directly involved in parts of the transport system. The State and Local Governments are major investors in it – especially in infrastructure systems and in ongoing management. And many industries have their own private investments – in vehicles especially, but also in storage / warehousing systems, and major infrastructure systems in such areas as mining, parts of agriculture, and in ports. Families and individuals are major investors too – with most having a car (and bicycles) and with many families having 3 or more cars. The figure below shows the number of motor vehicles by state per 1000 of population. Queensland had 701 vehicles / 1000 in 2005. •
That was 2% higher than the Australian average rate;
•
And the growth rate / 1000 over the 4 years to 2005 for Queensland was 7.5%, showing that the population continued to make substantial investments in that area.
Page 32 of 158
Figure 3 - Motor vehicles by state, per 1000 of population
A summary of the basic factors that the transport system serves, and some major transport activity measures, is below. Box 1 Queensland Indicators
Queensland – Basic Economic & Social Factors: •
Population o growth
3.972 m +2%
June 2005 2005-06 (e)
•
Households
1.587 m
2006 (f)
•
Gross State Product, current $ o real growth
$125.6 b +4.25%
2003-04 2005-06 (f)
•
State Budget Expenses
$25.67 b
2005-06
•
Exports
$26.203 b
2004-05
Some Transport Factors: •
Drivers Licensed
2.639 m
June 2005
•
Vehicles Registered
3.527 m
June 2005
•
Road Passenger P-Km
75.3 b
2002-03
•
Domestic Freight T-Km
126 b
2002-03
Page 33 of 158
Some of the key transport infrastructure systems supporting these activities are: •
181,000 km of road network; 9,600 km of rail corridor;
•
6,400 km of pipelines; over 130 airports; and 20 ports.
There are also over: •
193,000 recreational vessels; 5,700 commercial vessels
•
7,000 ship visits to ports each year
•
5,000 accredited transport operators
•
44,000 drivers of public transport; and 1,328 school bus contracts.
There are major production and service industries involved. These include: •
fuel supply and distribution;
•
new and used car sellers;
•
automobile service and repair, panel beating, towing etc;
•
rail, bicycle, ship and aeroplane service / repair;
•
vehicles and infrastructure systems construction, contractors etc;
•
driver trainers, traffic management and technology; and
•
finance and insurance.
The total size of transport, including all these closely related activities, in State factor income and product per year, is likely to be well above the $7.0b in 2004-05 (4.9% of the all-industries total) quoted above. Major Trends Many parts of the transport system have been growing in recent years; some of them at faster rates than the population. The following figures illustrate this.
Page 34 of 158
Figure 4 - Queensland Domestic Passenger Task
Figure 5 - Queensland Domestic Freight Task
Page 35 of 158
Figure 6 - Queensland Overseas Freight Task
Figure 7 - Queensland Vehicle Travel and Fuels Use Queensland - Transport Fuel Use & Vehicle Travel (Queensland Transport Facts 2005)
50
350
45
Fuel Use - PJ (full fuel cycle)
40 250
35 30
200
25 Fuel Use Within Qld
150
20
Road Vehicles - Total Distance Linear (Road Vehicles - Total Distance )
100
15
Linear (Fuel Use Within Qld )
10
Vehicle Kilometres Travelled (b VKT)
300
50 5 0
0 1988
1991
1995
1998
2001
2003
Page 36 of 158
Figure 8 - Queensland Vehicle Kilometres Travelled per head Queensland - Vehicle Kilometres Travelled (VKT) - per head 14000
VKT per head - Kilometres
12000
10000
8000
6000
4000
2000
0 1988
1991
1995
1998
2001
2003
Box 2 - Queensland Transport Task Growth Rates
Freight, Passenger and Vehicle Travel Growth - 1994-95 to 2002-03 Freight (tonne-kilometre basis, excluding pipelines): • • •
Total - overseas & domestic +59.9% Overseas - Sea +60.4% Total - domestic +53.0% o Road +73.7% o Rail +54.0% o Sea +27.4% Passenger (passenger-kilometre basis):
( 6.9% pa avg ) ( 7.0% pa avg) ( 6.3% pa avg ) ( 8.2% pa avg ) ( 6.4% pa avg ) ( 3.5% pa avg )
•
( 3.2% pa avg )
Total - domestic
+24.9%
Road vehicle travel (vehicle-kilometre basis): •
Total - domestic
+30.0%
( 3.8% pa avg )
+29.4%
( 3.7% pa avg )
Road Vehicle Numbers: •
Total
Most of these rates are above population growth; and some, such as freight, are above state economic growth (GSP, Gross State Product). This means that the state has been becoming more dependent on transport, and notably on freight and motor vehicle travel. The following box shows the rate of increase in fuel and energy use by transport in Queensland, plus Greenhouse emissions.
Page 37 of 158
Box 3 Queensland Fuel Use and Emissions Growth Rates
Transport - Energy & Fuel Use & Greenhouse Emissions Growth – 1994-95 to 2002-03 Energy Use (in peta-joules, excluding pipelines): • •
Total (overseas & domestic) Total (domestic)
Fuel Use (by road vehicles, ML)
+17.7% +25.6%
(+2.4% pa avg ) (+3.3% pa avg )
+27.8%
( 3.6% pa avg )
Greenhouse Emissions (in Gg, full fuel cycle basis): • •
Total (overseas & domestic) Total (domestic) o Road o Rail
+18.3% +26.7% +29.7% +26.5%
( 2.4% pa avg ) ( 3.4% pa avg ) ( 3.8% pa avg ) ( 3.4% pa avg )
Total energy use (domestic, excluding international movements) rose by 26% over the 8 years to 2002-03. This was a 3.3% average rise each year. Fuel use by road vehicles rose by 28%; and domestic Greenhouse Gas emissions rose by 27%. Energy and Fuel Sources Domestic Transport Energy sources used for domestic transport in Queensland in 2002-03 are shown below (in petajoules, full fuel cycle - PJ FFC). Figure 9 - Energy Use Shares for Transport in Queensland All Domestic Modes - Energy Sources
Electricity 3% Aviation Turbine Fuel 8% Road - Gaseous 4%
Petrol 51%
Diesel 32%
Petrol Diesel Road - Gaseous Aviation Turbine Fuel AvGas Black Coal Industrial Diesel Fuel Oil Natural Gas Electricity
Apelbaum Consulting Group Pty Ltd (2005), 'Queensland Transport Facts 2005'.
Page 38 of 158
Table 2 - Energy Use for Transport in Queensland (based on PJ FFC) Domestic Transport - Fuel Sources 2002-03
Petrol Modes / Fuels
Diesel Gaseous Turbine Fuel AvGas Black Diesel Fuel Oil Natural Electricity Road Aviation Coal Industrial Gas
Road Rail Air Sea Pipes
60.0% 35.4% 35.3%
Total All
49.9% 32.1%
4.5% 64.7% 96.7%
3.3%
15.1% 52.9%
70.0%
3.8%
8.3%
0.3% 1.7%
2.3% 7.9%
12.7%
0.1%
0.3%
39.2% 0.4%
3.3%
Source: 'Queensland Transport Facts 2005', draft report to Queensland Transport and Main Roads.
Total energy used by domestic transport in Queensland in 2002-03 was 332.3 PJ FFC (petajoules, full fuel cycle basis; includes use for pipelines). Of the total, electricity (mainly coal sourced) accounts for 3%. This is mainly used for rail, with a small share for the operation of pipelines. There is a small quantity of black coal used; for coastal shipping operations. The majority – over 97%, and likely over 99%, is from fossil fuel sources. Some 95% of the total is from petroleum based sources – that is petrol, diesels, LPG, aviation fuels and fuel oils. Petrols and diesels total 82%. Of the transport modes, road use accounts for 83% of the domestic total. Rail was 5% and aviation 9%. Road transport consumed 6,366.7 ML (megalitres) of fuel in 2002-03. Road transport energy sources are almost entirely petroleum based (except for small amounts of CNG in buses, about 0.1% of the total). Of the 3 major petroleum-based sources: •
LPG (liquid petroleum gas) accounted for 6% by ML;
•
Diesels for 32%; and
•
Petrols for 62%.
The figure below shows the levels of petroleum fuels consumption and total motor vehicle numbers in Queensland over the past 15 years.
Page 39 of 158
There have been strong rises in both of these factors, and the changes are quite highly correlated over time. Figure 10 - Road Fuel Use and Vehicle Numbers Queensland - Road Fuel Use & Vehicle Numbers 260
2.8
Fuel Use Within Qld - Road - PJ-FFC
240
2.6
Road Vehicles m Linear (Road Vehicles m)
2.4
200
2.2
180
2
160
1.8
140
1.6
120
Vehicles (m)
Fuel Use PJ (FFC)
220
1.4 1988
1991
1995
1998
2001
2003
The figure below shows the relative rates of fuel consumption per 100 kilometres per vehicle type, and over time. Figure 11 - Fuel Use Rates and Change over time by Vehicle Group Fuel Use Rates, Queensland - by Vehicle Type 70
Fuel Use Rate (L / 100 km)
60
50 Cars (PVs) LCVs
40
Rigid Trucks Artic. Trucks
30
20
10
0 1988
1991
1995
1998
2001
2003
Heavy freight vehicles – articulated and rigid trucks, have the highest rates; but those vehicles carry heavy loads, sometimes up to 60 T or 70 T, with multi-trailer combinations. The rates of fuel use for articulated trucks have shown some improvement over the years, as the figure indicates. •
The average rate per year was 1.1% pa over 1988 to 2003.
However the improvements in rates of fuel use for other vehicle types has been slower.
Page 40 of 158
For rigid trucks on average, the rate has actually deteriorated. For cars, the improvement averaged only 0.6% per year. •
Part of the reason for these slow improvements is likely to have been the trends in the market over time towards heavier and more powerful vehicles, and also towards heavier loads per freight vehicle.
The figures below show the average rates of energy intensity for modes / vehicles involved in passenger movement, and in freight. The data are for Australia as a whole. •
Note: energy intensity is more or less the inverse of the fuel use rate measure considered above.
•
A high energy intensity means that that mode is less energy efficient, although it may have efficiencies for some other social or economic measures.
Figure 12 - Energy Intensity – Passenger Task, Australia
Page 41 of 158
Figure 13 - Energy Intensity – Freight Task, Australia
Apelbaum Consulting Group Pty Ltd (2005), 'Australian Transport Facts 2005'.
The data shows that: passenger vehicles, mainly cars, are less energy intensive (are more fuel efficient) than are modes such as ferries and light rail, under average operating conditions. •
However cars are more energy intensive (on average) than buses and heavy rail.
For freight there are major differences. •
Light Commercial Vehicles (LCVs) are very energy intensive compared to the other freight modes (but note that LCVs are used mainly for lighter loads over shorter distances within urban areas).
•
Heavy rail and shipping are much more energy efficient than rigid and articulated trucks.
The figure below compares Queensland's road transport activities in 2003-04 with those of other States. Distance travelled per head (passenger km) is comparable with that in Victoria, SA and WA. However the notable feature is that Queensland's road freight T Km is well above that of any other state, and far above that in NSW and Victoria.
Page 42 of 158
Figure 14 - Interstate Comparisons – Transport by State Interstate Comparison 2003-04 - Road Passenger Km, VKT, & Freight
Vehicle Km / Passenger Km / Tonne Km - all per head
14000
12000
10000
8000
6000
VKT / hd
4000
Pass. Km / hd T Km/ hd
2000
0 NSW
Vic
Qld
SA
WA
Tas
Source: Apelbaum Consulting Group Pty Ltd (2006), personal communication.
Overseas Transport For Queensland's overseas transport operations, the total energy used by transport in 2002-03 was 124.9 PJ FFC. This was comprised mainly of fuel oils for shipping (57%); and also •
Aviation turbine fuel (32%), and
•
Industrial diesel fuels (5%) and diesel oils (7%) for shipping.
Virtually 100% of this energy is petroleum based. Projected Trends in Transport General Most available projections point to continuing growth in the transport task in Queensland. The key factors causing this likely growth are expected rises in population levels and in Gross State Product (GSP) and income per head. •
Other contributing factors include the likelihood of some continuing urban sprawl (which tends to favour car and LCV travel, and higher average distances travelled), an expanding overseas trade task (eg coal and mining exports), rising tourism etc.
Page 43 of 158
•
Note that many of the available projections are based on explicit assumptions, often that of 'business as usual'. This restricts the scope of some of those projections to represent the real future, as many policy conditions can be changed in real life, as history shows. - Nevertheless these projections can provide a realistic view of the future if 'business as usual' does continue.
Projections are available for state population – out to 2050; and for shorter time frames for some industry sectors; and for transport, including for regional planning work such as that for the South East Queensland Regional Plan. •
Most available projections at present are similar in that they indicate continuing strong growth rates in population, GSP and transport demands.
Australia For transport, there are several major sources of projections, although most of these are for Australia as a whole. One is the Bureau of Transport and Regional Economics (BTRE). Recent reports by BTRE including projections for Queensland include: •
BTRE (2003), 'FREIGHT between Australian CITIES, 1972 to 2001.'
•
This projects strong growth, about a doubling, between the year 2000 and 2020, in non-bulk freight between Brisbane and southern capital cities
•
Other BTRE work is included in the reports below.
The Australian Greenhouse Office issues projections for all major sectors in Australia biennially as part of Australia's National Communications to the United Nations Framework Convention on Climate Change. The report below will be included in the next communication: •
AGO (2005), 'Tracking to the Kyoto Target 2005. Australia's Greenhouse Emissions Trends 1990 to 2008-2012 and 2020.'
This was based in part on the following detailed assessment: •
AGO (2005), 'Transport Sector Greenhouse Gas Emissions Projections, 2005'.
•
The report was based on modelling work by both BTRE and ACG (Apelbaum Consulting Group Pty Ltd).
These reports project substantial increases in transport activity through to 2020. The graph below provides an indication (note: fuel use and Greenhouse Gas Emissions are very closely correlated).
Page 44 of 158
Figure 15 - Some Transport Emissions Projections – Australia
The National Transport Commission (NTC) has recently considered future national freight activities, and the result is at: •
NTC (2006), ' "Twice the Task". A review of Australia's freight transport tasks.', report prepared by Meyrick and Associates, and Sinclair Knight Merz.
•
Input studies again included modelling work by BTRE and ACG (Apelbaum Consulting Group Pty Ltd). - BTRE (forthcoming), 'Freight Measurement and Modelling: Road Rail Air and Sea'. - Apelbaum Consulting Group Pty Ltd (2005), 'Australian Transport Facts 2005'.
Domestic freight is projected in this report to rise by 80% between 2000 and 2020. See figure below. Figure 16 - A Projection of National Freight
Page 45 of 158
NTC (2006), ' "Twice the Task". A review of Australia's freight transport tasks.', report prepared by Meyrick and Associates, and Sinclair Knight Merz.
Finally, work by Abare (Australian Bureau of Agricultural and Resource Economics) is presented below. Figure 17 - A Projection of National Transport Energy Consumption Transport Energy Consumption - Queensland & Australia, 2003-04 to 2029-30 Source: ABARE Energy Projections, 2005 2500
700
Qld - PJ
600
2000
Aust - PJ
1500
400
300
1000
Australia - PJ
Queensland - PJ
500
200 500 100
0
0 1
2
3
4
5
6
7
8
9
10
11
12
13
14
15
16
17
18
19
20
21
22
23
24
25
26
27
Abare (2005), 'Australian Energy. National and State Projections to 2029-30'.
This indicates that further growth in transport energy use is probable. However it masks the extent of the different rates between Australia and Queensland. •
Queensland's use is projected to grow by 93% over 2005 to 2030 – an average annual rate of 2.8%; while Australia's is projected to be 61%.
•
Queensland's share of the national total was 22.7% in 2005, but could be 27.3% by 2030 under these projections.
Queensland The projections below are to 2013, and are from 'Queensland Transport Facts 2005'. They are based on detailed modal models and methodology (refer pages 27-53). The data below show measures of growth in the State economy, and in transport activity and major emissions, projected on a 'business-as-usual' basis for the decade to 2012-13. •
'Business-as-usual' assumes that existing or already approved changes in policy and programs will apply for the projection period; other future changes are excluded.
The rates of growth projected are slightly below those over the past decade.
Page 46 of 158
Box 4 Some Projections of Queensland Economy and Population Economic & Social Factors – 10-year projections to 2012-13: • • • • •
Gross State Product, real Population Population under 60 Households Vehicle Drivers
+43.5% +17.6% +10.7% +26.5% +22.1%
( 4.1% pa avg ) ( 1.8% pa avg ) ( 1.2% pa avg ) ( 2.7% pa avg ) ( 2.2% pa avg )
Some key factors behind this are slower rates of growth projected for population, household numbers, and state product (economic) growth. There are other factors which have been taken into account in the modal activity models and projections. •
More detailed projection tables are in Appendix A and pp 178 to 203 of the report.
An area of anticipated strong growth in the coming decade is road vehicle travel. This is projected to rise by ~46% over 2002-03 to 2012-13, an average of 4.3% a year. •
That is slightly higher than the projected rate of state GDP growth, of 4.1%.
Freight growth is also projected to remain strong. Road freight growth is projected to be ~41% over 2002-03 to 2012-13, or an average 3.9% per year. Sea freight (domestic) could rise by ~5.7% pa, higher than its rate in recent past years. And rail freight growth of some 3.1% pa is projected. The growth in energy and fuel use and in greenhouse emissions is projected to continue at noticeable rates. •
For example, domestic Greenhouse Emissions growth is projected to rise by ~39% over the decade to 2012-03, or at an average of 3.7% pa.
Fuel use growth was not included in that report, but it would be expected to be very close to the projected rate above for Greenhouse Emissions – ~39% over the decade (an average of 3.7% pa).
Page 47 of 158
Box 5 Some Projections for Transport in Queensland Transport and Energy Measures - Projected to 2012-13: Passenger growth (passenger-kilometre basis): • •
Rail Road (a)
+27.1% +45%
( 2.7% pa avg ) ( 4.3% pa avg )
+45.7%
( 4.3% pa avg )
Road vehicles (vehicle-kilometre basis): •
Road
Freight growth (tonne-kilometre basis, excluding pipelines): • • • •
Road Rail (b) Sea, domestic Sea, overseas
+40.7% +31.0% +64.0% +67.5%
( 3.9% pa avg ) ( 3.1% pa avg ) ( 5.7% pa avg ) ( 5.9% pa avg )
Greenhouse emissions growth (in '000 tonnes (or Gg), full fuel cycle basis): • • •
Total (domestic)(c) Of which - road Of which – rail
+38.7% +38.6% +29.5%
( 3.7% pa avg ) ( 3.7% pa avg ) ( 2.9% pa avg )
(a) Approximate. (b) Hire and reward. (c) Excludes pipelines.
Figure 18 - A Projection of Queensland Fuel Use and Emissions Queensland - Energy Use & Road Vehicle CO2 eq Emissions 30
450
400 25 350
20
250 15 200
M T CO2 eq
PJ-FFC
300
10
150
Fuel Use Within Qld - PJ-FFC 100
CO2-eq Emissions - Road Transport - MT
5
Linear (Fuel Use Within Qld - PJ-FFC)
50
Linear (CO2-eq Emissions - Road Transport - MT) 20 13
20 10
20 08
20 05
20 03
20 01
19 98
19 95
0 19 91
19 88
0
Some Recent Shifts – Transport Systems This section provides information on how parts of the transport system have been responding to the recent increased petroleum prices. Petrol Prices Prices for petrol are shown below, and more information is at Appendix B.
Page 48 of 158
Figure 19 - Brisbane Petrol Prices, 1999 to 2006 Unleaded Petrol Prices, Brisbane - Actual & Deflated Prices 120
0.80 0.75
110
Actual Price c / l
100 0.65 90
0.60 0.55
80
Real / Deflated Price
0.70
0.50 70
Price - Brisbane Real Price - Brisbane
0.40
Ju nSe 99 pD 99 ec M 99 ar -0 Ju 0 nSe 00 pD 00 ec M 00 ar -0 Ju 1 nSe 01 pD 01 ec M 01 ar -0 Ju 2 nSe 02 pD 02 ec M 02 ar -0 Ju 3 nSe 03 pD 03 ec M 03 ar -0 Ju 4 nSe 04 pD 04 ec M 04 ar -0 Ju 5 nSe 05 pD 05 ec M 05 ar -0 6
60
0.45
Real (CPI deflated) petrol prices in Brisbane rose by 9.7% in 2004-05 (fiscal year average). From there they rose an additional 15.8% by the September quarter 2005, before easing slightly in the December quarter. They rose once again in the early months of 2006 to April, as world oil prices rose to new highs in current $ terms. Public Transport Use Recent shifts in public transport use in South East Queensland are shown in the figures below. Over the 6 years to 2004-05 there were various rises in patronage, with an average annual rate of ~3.7% pa. There was a strong rise of almost 7% in 2004-05, reflecting perhaps especially a range of improvements in services.
Page 49 of 158
Figure 20 - SE Queensland – Patronage Changes, Public Transport Public Transport Use - South East Queensland, 1999-00 to 2004-05 110000
1.08
1.07 000 trips (LH scale)
105000
1.06
% pa (RH scale)
1.05
1.04 95000 1.03
90000
Change % pa
'000 Trips
100000
1.02
1.01 85000 1
80000
0.99 1999-00
2000-01
2001-02
2002-03
2003-04
2004-05
2005-06
Source: Annual Reports for Queensland Transport, QR, and BCC.
More recent data for 2005 and 2006 by month does not indicate that that strong rise continued during 2005-06, despite the higher level of oil prices. Very recent shifts in public transport use in South East Queensland are shown below. Figure 21 - SE Queensland – Recent Patronage Changes, Public Transport Public Transport Patronage, Total SE Queensland, 2004-05 to 2005-06, Monthly 16000000 2004-05
14000000
2005-06 12000000
Trips
10000000
8000000
6000000
4000000
2000000
0 July
Aug
Sep
Oct
Nov
Dec
Jan
Feb
Mar
Apr
May
June
Source: TransLink.
This shows that public transport patronage growth actually slowed in 2005-06, to ~1.3% (year on year, for the first 9 months). Bus use declined, while train and ferry use rose. The slowdown in growth overall in 2005-06 is somewhat unexpected given the higher levels of petroleum prices and their effects on the costs of car use. •
Further information is needed, but it might be that the majority of the response has been in terms of reduced passenger car travel or more careful car driving practices.
Page 50 of 158
•
The section below indicates several substantial changes in new car markets.
New Car Markets The information on new vehicle sales below shows some notable recent changes in vehicles acquired. Box 7 Recent Changes in Australian New Vehicle Sales Patterns New Vehicle Sales - Australia -
Australian motor vehicle sales have eased slightly since early 2005.
-
There was a dip in October 2005, but overall the trend has been only slightly down over the past 15 months (FCAI – Vfacts, ABS 9314.0).
-
But in the March Quarter 2006, compared to a year ago, there were some sharp changes in sales trends across vehicle types: o
Light passenger vehicle sales rose by 22%.
o
Large passenger vehicle sales fell 17%.
o
Sports Utility / 4WD sales fell, especially in the case of the large group (-35%).
http:/www.autoindustries.com.au/sales.php/2006/03/segmentation.html
In Queensland, another notable trend from registration data for new vehicles is a strong upward growth in motorcycles. •
The number of new motorcycle registrations rose by 29% in 2005, to 13,346.
•
This was 78% above the level 3 years earlier, in 2002. - In comparison, the growth in new car registrations in Queensland over that period was 24%.
Airline Trade There have been indications of strong cost pressures in the world airline trade. Some airlines have lost share market value; some have moved to establish market hedge positions as a form of insurance against further price rises; and many have established fuel surcharges / levies as a new part of their fare systems. •
And some of those surcharges have been raised several times over the past year.
Page 51 of 158
Box 8 Qantas Qantas Airline -
Qantas has been making changes and restructures in order to cope with the new cost pressures and continuing international competition.
-
Its Chief Executive has stated: 'Qantas could no longer afford to work on the assumption of a $US60 a barrel oil price over the medium term. "We think it will be higher than that and things will have to be run … on a much higher oil price, which will mean further and quite a substantial restructure of Qantas,"'.
-
It has announced that it will cease the Australian Airlines brand from July and concentrate on Qantas and Jetstar. It has had talks with Air New Zealand and local land transport operators.
-
It has announced a 'sustainable future' program, including a cut of $3b from its cost base by 2008, when some more fuel efficient aircraft will be received.
-
Its fuel surcharges were raised again on 5 May 2006 – to $31 for Qantas flights within Australia (up $5), and to $98 for international flights (up $23).
Impact Assessment Summary – for 3 Scenarios As stated earlier in this report, the following scenarios are explored in this section.
Page 52 of 158
Table 1 - Assumed Scenarios for Future World Oil Prices (Light Crude) Scenario Item
World Average Oil Prices, $US / Barrel (a)
World Market Volatility
Low Oil Price
Central Price
Prices ease from an average $US54 / brl in 2005, to: ~$US35/40 by 2050 (*).
Prices average $US58-60 / brl, from 2005 to 2015. Prices rise after 2015, to ~$US70-80 by 2050 (*).
Prices rise from an average $US54 / brl in 2005, to: ~$US110-115 by 2050 (*).
volatility lower than in Central case.
Market volatility higher than in the past decade.
Market volatility much higher in future.
But still present, due to the locations of export supplies & political changes.
Some periods of political instability disrupt export supplies.
OPEC dependence is high.
Oil Market
Oil High Oil Price
Supply & political instabilities are occasionally very severe.
(*) Note: price instabilities around this scenario are described under: World Oil Market Volatility. (a) Composite crude oil costs to US refiners; source US Energy Information Administration. Prices are in real terms – real 2005 prices, $US. The figure below shows these price scenarios over time, together with past real prices from 1970.
Page 53 of 158
Figure 2 - Three Scenarios for World Oil Prices World Oil Prices - 3 Scenarios $120.00
Real Price $14.12 $13.97 LOW
Real Oil Price ($US2005, USA)
$100.00
CENTRAL HIGH
$80.00
$60.00
$40.00
$20.00
45 20
30 20
15 20
00 20
19
19
85
70
$0.00
Central Oil Price Scenario Table 3 - Assumed Scenario for Central Scenario for Future World Petroleum Prices Item
Central Oil Prices
World Oil Prices, $US / brl
Prices average $US58-60 / brl, 2005 – 2015 (light crude). Prices rise slowly after 2015 – to $US70-80 / brl by 2050
World Oil Market Market volatility substantially higher than in past decade. Volatility
Some periods of political instability disrupt export supplies and prices
Key Impacts and Risks The major impacts of this scenario would be in the following areas: •
Transport Sector and Users
•
Community and Industry
•
State Government
These are addressed in summary form below.
Page 54 of 158
Transport Sector and Users Fuel Prices and Supplies: Real oil prices average around recent (2005 average) levels over the next decade – but with some periods of price and supply disruption given political and financial conditions. From 2015 to 2050, prices rise to around $US70-80 / brl, ~38% above the 2005 level. •
But there are also some periods of pronounced price and supply disruption given political, security and financial conditions.
•
Prices of major petroleum products – diesel and petrol, are assumed to rise in accord with those changes, as also the prices of LPG, natural gases etc.
Road: Road freight, trucks. Accredited transport operators. Public road transport, buses. Driver trainers. Cars. Automobile service / repair, panel beating. Vehicle towing. Fuel supply and distribution. Cycling.
•
Under this scenario, impacts are expected to be similar to those observed over the past 9 months; but with some intensification over time and past 2015.
•
The main direct impacts are expected to be on: - Fuel pricing; costs of motoring; and costs of road freight.
•
Prices of fuel, diesel and gases may be similar to, or slightly higher than those current, over the next 10 years.
•
However some substantial fluctuations would be expected over the decade as well, reflecting supply disruptions, stockpiling / investment decisions, and various political, security and financial factors. - These could interrupt the local market and industry on occasions, resulting in reduced service and performance records. - The petroleum storage policies of the fuel supply sector, governments, and industries may come under review.
•
During 2005, there were clear indications of concern among many parts of the community as to the impacts of higher local petrol prices. - For instance, a Sensis survey indicated that 'petrol has forced its way to the top of the list of consumer worries (replacing terrorism, the health system and the environment)', and - The Commonwealth Bank stated that its 'petrol stress indicator showed petrol prices had moved well above the "critical value" that would cause economic stress'.
'critical value … $1.17 a litre, with petrol prices now about $1.30, the bank says we have now "passed the point where some damage to consumer spending - that is, a period of below-trend growth - is unavoidable"'.
Sydney Morning Herald (2005), 'Petrol tops consumer worry list', September 14, 2005.
Page 55 of 158
•
And there have already been some adjustments evident in parts of the road sector, in response to the recent high levels of oil and petroleum prices. These have included: - A clear upturn in the share of new vehicles purchased in Australia with lower size and power capacity and higher fuel efficiency; - A rise in the number of world automotive manufacturers including more fuel efficient models in their sales line ups; and - Concerns expressed by the state road freight sector about the effects of fuels' prices on their operating costs.
•
Under this scenario, some of these directions would be expected to strengthen slightly over the next decade. However no radical strengthening would be expected, unless there was some major oil market instabilities. - Some past responses to oil market pressures in road transport worldwide and in Australia have been short term, lasting from 1 to 3 years. - However it should be noted that oil prices fell and remained lower after those events, which would have reduced the impetus for sustained change. - In this scenario no major sustained fallback in oil prices is projected. And, while petroleum costs as a share of GDP have eased in the past 2 decades (tending to reduce demand responses to oil prices), there would be more incentive for the sector to keep a focus on the issue and to maintain some efforts to reduce exposure to higher costs. - In addition, over 2005 to 2015, a higher level of oil market instability is projected. These changes and disruptions are likely to help maintain some momentum towards more energy efficient power sources.
•
During the period 2015 to 2050, further movement in those directions would be likely, and the shape of the state's road transport system would evolve. - Further moderate rises in real oil prices, further market instabilities, accelerating changes in power technologies, and wider concerns mounting with climate change, would result in substantial changes in the sector. - By 2050 the sector would have undergone substantial change towards a more fuel / energy efficient future.
Rail: •
Under this scenario, the effects are expected to slightly favour rail use for both passengers and freight. But impacts on rail's competitive position are not likely to be major over 2005 to 2015.
•
While heavy rail clearly has an advantage in terms of fuel efficiency / intensity compared with road freight, there are some operational constraints in parts of the rail network at present. Additional investments in track and rolling stock may well be considered but there are other investments competing for public and private funds. - Overall some moderate upturn in rail use is likely over the next decade under this scenario. - However part of this may result from separate strategic and investment decisions made by national and state based authorities, and firms.
•
Over the period 2015 to 2050, with further rises in real oil prices, and some additional supply instabilities, further movement in the direction of rail freight and passenger movements would be likely. - The extent will depend partly on the rate of technological advance in rail freight systems (compared to road especially); and
Page 56 of 158
- The extent of clarity provided in national policies and programs for a 'policy neutral' playing field between road and rail. Sea: Recreational vessels. Commercial vessels. 7,000 ship visits to ports pa. Ports.
•
For sea, a somewhat similar situation to rail is expected under this scenario.
•
Existing projections suggest some upturn in sea freight over the years to 2013 and a healthy annual rate of growth.
•
And under this scenario a slightly faster rate of increase would be likely in domestic sea freight. There would be some incentives for freight forwarders for example to use a mode with lower energy costs (which may also be able to bypass some land transport bottlenecks).
Air: Air passengers. Aeroplane service & repair.
•
For air, the trends may be somewhat divergent.
•
Existing projections suggest further continuing strong growth in air passenger transport over 2005 to 2013.
•
Under this scenario a slightly slower rate of increase would be likely.
•
There are already indications of some fuel sourced cost pressures in domestic Australian air activities, and in parts of international air travel as well. - Explicit fuel loadings to fares have been applied in some areas, and some overseas airlines are reporting some additional financial difficulties.
•
In the longer term, over 2015 to 2050, there will be further strong pressures (positive and negative) on both air travel demand and on operating margins.
•
To date aeroplanes have relied mainly on high energy content petroleum based fuels for the power to payload ratios required. And air travel has been one of the fastest growing sectors worldwide.
•
Demand pressures are likely to continue strong, and there seems to be some strong potential still for technological gain in air transport, but the additional petroleum costs would be likely to provide some counter weight through the raising of costs and fares.
•
Other policy actions may be sources of pressure on this sector in the long term. Climate change policies may be a key source of policy uncertainty.
Page 57 of 158
Cycling and Walking: •
There have been some divergent trends in these methods of travel over the past 15 years. Results from the 2004 Household Travel Survey for South East Queensland indicate that the share of all trips held by these modes has fallen since 1992, with a halving in the case of cycling. - Some other indicators, such as traffic on some commuter bikeways, suggest more positive trends in recent years.
•
For the future, under this scenario, some improvement in the rates of cycling especially, and walking may be seen (viewed in isolation from other urban and social trends influencing their use). - But a very strong response is not anticipated. - The major influence on activity through these modes is likely to be the rate of urban planning and design changes introduced (favouring liveable communities, walkways, bikeways and allied facilities), general behavioural and lifestyle changes, plus the extent of public health / obesity concerns (for individuals, and by governments).
Allied Industries: Finance and insurance. New and used vehicle sellers. Vehicles and infrastructure systems design & construction, contractors etc. Traffic management / technology.
•
For the future, under this scenario, the major shifts may occur in the sectors: new vehicles design and manufacture, and traffic management and allied technology.
•
There are already some significant pressures towards greater fuel and carbon fuel efficiency in the world automobile and truck markets. With a higher fuel price level continuing pressures would be likely. - Competitive pressures in the trucking sector would favour firms with a more fuel efficient fleet, and costs of motoring are sensitive to fuel price levels for many in the population.
•
There are a series of areas where enhanced traffic management, and the use of 'intelligent transport systems' more generally, could improve traffic flows, leading to reduced fuel use and risks exposures. - And some approaches to road use charging more aligned with user and polluter pays principles, could also assist in that direction.
Community and Industry •
Under this central scenario, the main factors relevant to communities and industries would arise from: - Fuel prices, fuel supply disruptions; and - The costs of motoring and road freight.
•
For households in outer urban areas, or in adjoining semi-rural areas, costs of work commuting and other types of trips will be higher. - This may impact on land values to some extent; and also - Place some financial pressures on sections of the community such as 'young families' and those with incomes lower than average.
Page 58 of 158
•
Most industries depend on cars or other forms of light transport – for basic employee commuting, some supplies, marketing purposes etc. - Costs of these activities would be higher under this scenario, on average; and this factor will heighten the attention paid by firms to their location. - For instance firms servicing retail outlets and commercial centres will pay closer heed to location decisions, so as to minimise the transport costs of servicing customers and the costs of their own supplies, and also of their commuting workforce. - Fuel price peaks and/or supply disruptions would have an influence on firms/employees in terms of more closely examining public transport options.
•
And many industries depend on trucks or other forms of heavy transport – for basic input supplies or for products delivery.
•
In urban areas, costs of these activities would be higher, and this again will heighten the attention paid by firms to their location. There are already significant competitive pressures involved in industrial locations. - These rising pressures may be affected also by urban planning decisions. And the efficiency of ports and the ease of access to them will be of greater importance also.
•
In rural and mining areas, many industries are heavily dependent on transport, road transport especially. - The costs of their delivered inputs and the costs of deliveries of outputs of the many rural and mining industries will be higher under this scenario; and with gradual rises in the years through to 2050. - For export industries, the effects of this on sales may be reduced, as other competitor industries overseas will mostly face similar cost rises. - However those industries well inland, and without efficient freight rail access, may face disproportionate cost rises and some loss of competitiveness as well. - This may exacerbate the position of communities in some inland areas; while raising the risks of both: community de-population, and declining standards of grazing land management. (refer also to paper from QDPI).
State Government The issues above imply the following key impacts and risks for the state government to consider, under this scenario: •
2005-2015: Fuel supply disruptions, with interruptions to commerce and industry - Petroleum storage policies may need review.
•
2005-2015: Slightly higher plane of fuel prices than prior to 2005; higher commuting and general access costs - Some financial pressures on outer urban sections of the community (eg 'young families', those with low incomes). - Increased demands for effective public transport systems, and for local / regional employment (as distinct from CBD jobs). - More demands for user pays road pricing.
Page 59 of 158
- Increased competitive and community problems in some outlying regions and allied agricultural and mining sectors. •
2015-2050: Further (moderate) rises in oil prices; supply disruptions - Moderate inflation consequences from some oil market disruptions. - Petroleum storage policies and petroleum dependence strategies need review. - Attention required to alternative fuels to ensure viable systems, and to address issues of energy supply continuity / risks; other States address alternative fuel and power systems, seeking energy security, a reduced carbon signature, and a competitive edge. - Rising financial pressures on outer urban sections of the community ('young families', those with low incomes). - Considerable increases in community demands for effective public transport, and for local / regional employment (as distinct from CBD jobs). - Rising competitive and community problems in outlying / inland regions and allied agricultural and mining sectors. pressures rising for breakthroughs in rail access and in road transport and fuels technologies.
High Oil Price Scenario Table 4 - Assumed Scenario for High Future World Petroleum Prices Item
High Oil Price
World Oil Prices, $US / brl
Prices rise from $US54 / brl, 2005 – to $110-115 by 2050
World Oil Market Market volatility much higher in future. Volatility OPEC dependence is high.
Supply & political instabilities occasionally very severe
Key Impacts and Risks The major impacts of this scenario would be more severe than in the Central case. Transport Sector and Users Fuel Prices and Supplies: Real oil prices would rise above recent ($US54 / brl, 2005 average) average levels over the next decade – to ~$US70 or more by 2015. •
And there would be periods of substantial price and supply disruption in the coming decade as well, given political and/or financial problems.
From 2015 to 2050, prices are assumed to rise further overall, to around $US110-115 / brl, about double the 2005 average level. Page 60 of 158
•
Also, periods of pronounced price and supply disruption occur due to political, security and financial conditions, and concerns as to the levels of real oil reserves.
•
Domestic wholesale and retail prices of major petroleum products – diesel and petrol, are assumed to rise in accord with those changes, but at a slightly lower rate, due to the effect of the national taxation structures (which are assumed to be stable) on the prices of these products. - As also the prices of LPG, natural gases, ethanol, hydrogen etc.
The Figure below provides a guide to past oil prices and local petrol prices. Figure 22 - World Oil Prices & Australian Petrol Prices World Oil & Australian Petrol Prices (current prices) - 1982 to 2005 120
80 US - Oil $US - LHS 31.87 28.99 28.63
100
US Oil - $A - LHS 31.51 32.19 32.64 Aust Petrol - A c / L - RHS 38.8 45 48.1
60
80 50
60
40
30 40
A ustralian P etrol P rices, c / L
O il P rices (U S prices) - $U S & $A per B rl
70
20 20 10
0
0 1985
1990
1995
2000
2005
This Scenario would also involve some significant macroeconomic effects in Australia. Key factors such as inflation rates, sectoral income distributions, consumer confidence, savings and investment rates, income growth rates etc could be impacted. And these might influence transport – by lowering demand for travel / freight. •
These broader issues are mentioned here, but they are not quantified.
Road: •
Impacts are expected to be stronger than observed over the past year, and stronger than under the Central scenario. Impacts would gradually increase over time, and would be substantial by about the years 2020 / 2030. - Again the main direct impacts are expected to be on: fuel pricing, costs of motoring and road freight.
Page 61 of 158
•
Real retail prices of petrol, diesel and gases would be roughly 18-22% higher than in 2005 by around 2015.
•
And also some substantial fluctuations in prices would be expected over the decade, reflecting supply disruptions, stockpiling / investment decisions, and various political, security and financial factors. - These could interrupt the local market and industry on occasions, resulting in reduced service and performance records.
•
Under this scenario, the following trends would be likely: - The recent trend towards smaller, cleaner new motor vehicles purchased in Australia would strengthen; - Pressures on the state road freight sector (from fuel price effects on operating margins) would intensify; - Travel demands would be affected, with clearer signs of diminished road traffic growth in urban areas and increased use of public transport.
•
Over the period 2015 to 2050, further movement in those directions would be likely, - Real retail prices of petrol, diesel and gases might be roughly 70% higher than in 2005 by around 2050.
•
This Scenario would enforce a more rapid transformation of the state's road transport system. - The strong rises in oil prices, major market instabilities, accelerating changes in power technologies, and concerns mounting as to climate change, would result in substantial changes. - The sector would have undergone substantial change towards a more fuel / energy efficient future well before 2050.
•
Likewise, the Scenario would enforce substantial changes in urban and industrial planning and development approaches.
Rail: •
This scenario would substantially favour rail use for both passengers and freight.
•
Although, the impact on rail's competitive position might not be very major until around 2015/2020. - Heavy rail has an advantage in energy efficiency compared to road freight but rail network operational constraints would need to be overcome (investments in track and rolling stock would be needed in this scenario, but there are other investments competing for funds).
•
Overall an upturn in rail use is likely over the next decade under this scenario, especially after 2010.
•
Over the period 2015 to 2050, with further rises in petroleum prices and substantial oil supply instabilities, further increases in rail's share of the freight and passenger market would be likely. - Again, the extent will be affected by the rates of technological advance in rail and road, and the level of clarity in national policies and programs for investment and a 'policy neutral' playing field between road and rail.
Page 62 of 158
Sea: •
For sea, a similar situation to rail is expected. Existing projections suggest an upturn in sea freight over the years to 2013 and a healthy annual rate of growth.
•
Under this scenario a faster rate of increase would be likely in domestic sea freight.
Air: •
This scenario would not favour airflight. Existing projections (under 'business as usual' conditions) suggest further strong growth in air transport to 2013 (and beyond), but under this scenario a slower rate of increase would be likely. - There are already indications of fuel sourced cost pressures in domestic Australian air activities and in parts of international air travel.
•
Over 2015 to 2050, there will be further strong pressures (positive and negative) on both air travel demand and on operating margins.
•
Basic demand is likely to continue strong, but the rising plane of petroleum / avgas prices would provide a strong counter weight to that, through higher costs and fares.
•
Under this scenario inbound tourism is likely to be adversely affected; prospective visitors from the northern hemisphere choosing locations closer to hand.
Cycling and Walking: •
Under this scenario, an improvement in the rates of cycling especially, and walking are likely to be seen. - Although the major influence on these areas of activity is likely to remain the rate of urban planning and design changes introduced, behavioural and lifestyle changes, and the extent of public health / obesity concerns.
Allied Industries: •
For the future, under this scenario, major shifts may occur in new vehicles design and manufacture, and traffic management and allied technology. Faster advances in some other energy technologies would be probable also.
•
Enhanced traffic management and 'intelligent transport' systems would be introduced more rapidly to improve traffic flows and logistics – leading to reduced fuel use and risks exposures. Road use charging linked with user and polluter pays could be introduced.
•
There would be very significant pressures towards greater fuel efficiency in the world's new automobile and truck markets. - More efficient vehicle technologies such as diesel, hybrid drive, and fuel cells would be introduced more quickly; - And 'non-fuel' approaches, such as electric vehicles, would become more widely used in urban areas and for other 'local' uses.
Page 63 of 158
•
This scenario would also greatly encourage the development of alternative energy sources for transport purposes. Such sources may include: - Electricity (or hydrogen) produced using power from geothermal sources, or from wind, tidal or solar; - Other carbon based fossil fuels such as natural and coal seam gases (gas and liquid forms), syn-fuels from coal etc; - Non-fossil fuels such as ethanol.
•
A full consideration of these areas and the associated costs and transition points etc is out of the scope of this paper.
(refer also to the Taskforce paper from the Department of Energy).
•
However, the costs of establishing any new energy distribution systems, conversion of vehicles, and any changes in the costs of new vehicles are all matters which need consideration when addressing this scenario in more detail. - Eg distribution systems for compressed natural gas would require some substantial investments if that avenue was to be pursued.
•
A further issue which would need to be considered would be the overall energy yield from various alternative energy sources. It is possible that some energy sources may actually require more energy to produce them than they yield. - Full fuel cycle and whole of lifecycle analyses should be conducted to ensure that a specific energy source is efficient in this sense. - And similar analyses for greenhouse gas emissions would be required in addition, given the severe global risks and vulnerabilities of climate change.
Community and Industry •
The main factors impacting communities and industries would be from: fuel prices, fuel supply disruptions, and the costs of motoring and road freight.
•
For households in outer urban areas, or in adjoining semi-rural areas, costs of work commuting and other types of trips by motorised transport will be much higher. - This may impact on land values to an extent; and also place financial pressures on sections of the community (eg 'young families', and those with low incomes).
•
A broad illustration of the possible vulnerabilities in a major city, of a high oil price scenario, has been provided by Dodson and Snipe.
•
They noted that transport costs in Australia's capital cities averaged 15% of weekly household income in 2003-04 (Brisbane was 16.2%), and that the vulnerability could be approximated at the sub-suburban level by using census data for: - Socio-economic indices (including income) and levels of motor vehicle ownership and car use for work commuting.
Page 64 of 158
•
Using this approach they developed a broad 'Vulnerability Index for petrol expense rises'. The mapping for Brisbane shows locations with a relative vulnerability. This indicates that suburbs with greater vulnerability are mainly in the outer areas: - Southern corridor, Logan towards Beenleigh; western corridor, towards Ipswich; and northern corridor, towards Redcliffe / Caboolture.
•
However a majority of the Brisbane region population have some noticeable level of vulnerability.
•
This study did not provide a detailed assessment of the absolute level of economic vulnerability of various types of households to levels of oil price and did not allow for some relevant issues, such as localised public transport accessibility measures. - However it has provided a useful initial guide in the area, and could be built on in future more detailed studies.
Dodson J, and Snipe N (2005), 'Oil Vulnerability in the Australian City', Research Paper 6, Urban Research Program, Griffith University.
•
At industry level, there remains a high dependence on cars, light commercial vehicles etc, for basic employee commuting, supplies, marketing etc. - Costs of these activities would rise significantly under this scenario, re-doubling the attention paid by firms to their location. Fuel price peaks and supply disruptions would further influence firms /employees in examining public transport.
•
Many industries depend on trucks or other forms of heavy transport, and in urban areas, costs of these activities would be significantly higher. This will further heighten attention paid by firms to their location. - These rising pressures will likely directly have a major impact on urban planning and investment processes.
•
For rural and mining areas, costs of delivered inputs and outputs would be substantially higher under this scenario, especially for relatively low value goods per tonne or per cubic metre. - For export industries, the effects of this on sales may be reduced as most competitor industries overseas would face similar cost rises. - But those industries well inland and without efficient freight rail access would face substantial cost rises and some losses of competitiveness. - This would exacerbate the position of communities in some inland areas; and raise the risk of both: community de-population, and declining standards of grazing land management.
(refer also to the Taskforce paper from QDPI).
State Government The issues outlined above imply the following key impacts and risks for the state government to consider, under this scenario: •
2005-2015: Fuel prices remain high, with some fluctuations, and also some supply disruptions, adversely affecting commerce and industry - State petroleum storage policies may need review. Page 65 of 158
- Strategies for liquid fuel supply and demand management, and for electricity supply, may need to be more highly developed. - Strategies for community progression in inland areas may need review. •
2015-2050: Fuel prices rising to high levels over time, and with some severe fluctuations as well - much higher commuting and general access costs; also some severe supply disruptions, adversely affecting commerce / industry.
•
Some major problems: - Substantial inflationary pressures from some of the oil market disruptions. Economic management challenges; tighter monetary policies leading to higher interest rates and some investment restraints. - Strong financial pressures on outer urban sections of the community (eg 'young families', those with low incomes). - Considerable increases in community demands for effective public transport, and for local / regional employment. - Rising competitive and community problems in outlying / inland regions and allied agricultural and mining sectors. community de-population, and declining standards of grazing land management, pressures rising for breakthroughs in rail access and in road transport and fuels technologies. - Petroleum storage policies and petroleum dependence generally become increasingly questioned.
•
State Government implications: - Inflation pressures and attendant economic management challenges; tighter national monetary policies, higher interest rates, some investment restraints. stronger budget pressures (part offset from tax revenue from coal and gas trade), stronger pressures to help maintain the competitiveness of various industries and to boost investment in key enabling sectors. - Strong financial pressures on outer urban sections of the community (eg 'young families', those with low incomes). Financial and social assistance needs increase. - Considerable increases in community demands for effective public transport, and for local / regional employment (as distinct from CBD jobs). rising demands for public transport investments in outlying urban areas; and for more effective locality based planning (social, employment), stronger acceptance of user and polluter pays forms of road pricing. - Rising competitive and community problems in some outlying (especially western) regions and allied agricultural and mining sectors. rising demands for social and community assistance, pressures rising for enhanced rail access and allied state investments in regional rail, and also for breakthroughs in road transport and fuels technologies. - Petroleum storage policies and energy strategies more widely, need review.
Page 66 of 158
- Attention required to alternative fuels to ensure viable systems, and to address issues of energy supply continuity / risks; other states address alternative fuel and power systems, seeking energy security, a reduced carbon signature, and a competitive edge. Low Oil Price Scenario Table 5 - Assumed Scenario for Low World Petroleum Prices Item
Low Price
World Oil Prices, $US / brl
Prices ease from $US54 / brl, 2005 – to $US35-40 by 2050
World Oil Market Volatility
Market volatility lower than in central case. But still present, due to the locations of exportable supplies, & political changes.
Key Impacts and Risks The impacts and risks of this scenario are notionally relatively minor compared to the High and Central scenarios. Costs of transport for many modes would gradually ease under this scenario compared to recent levels. And pressures on allied parts of industry and community would slowly ease. •
However, note that real oil prices for the first 3 decades would still remain higher than their previous long run average levels.
There are still at least 2 areas of risk to be considered however. Will this Scenario Hold? Consideration of this scenario does not mean that it will actually occur. If a body of sentiment arises that regards such a scenario as probable, then the rate of movement to more energy efficient forms of transport and allied locations, would be likely to ease. This may raise the risks of adjustment difficulties later on, if world oil market conditions change unexpectedly and a new and tighter market outlook emerges. •
Under these circumstances, costs of adjustment incurred may be higher, than under other conditions (where steady, systematic changes to transport systems and to operating or household locations are made).
Page 67 of 158
Climate Change Even if this scenario does hold, there is still a major risk related to climate change and the potential global decisions to abate that threat. Should international policy decisions on greenhouse emissions create new tax structures on oil / petroleum products, or tradeable emissions markets, or if consumption limits on those products are introduced, a similar set of adjustment difficulties to those described above may occur. Flow-on Issues This section provides a summary of the main vulnerabilities to the central and the high oil price scenarios, of some opportunities, and some consequent policy issues. Main Vulnerabilities Major areas of transport-related vulnerability for Queensland, to the central scenario and in particular to the high oil price scenario, are summarised below. Community The main transport factors with impacts on communities would be: disruptions, and the costs of motoring and freight.
fuel prices, fuel supply
Households in outer urban areas, and adjoining semi-rural areas •
Financial vulnerabilities, due to (potentially) substantial increases in the costs of work commuting and other types of trips by motorised transport. - This factor would reduce discretionary incomes, and there may also be falls in wealth in some areas due to reduced property values; some financial distress is possible, especially under the High scenario. - Vulnerabilities may be greatest for some sections of the community, eg 'young families' with income earners at an early career stage, those with low incomes, and those without efficient public transport systems. - In some cases, this financial vulnerability may be lessened – by reducing some transport activities; but that approach might raise other vulnerabilities – eg through slower progress in education, training, health, sports etc.
People in urban areas, with substantial access needs •
Those people with strong needs for education, training, health services etc, and those with limited incomes. - Vulnerabilities are similar to the above.
Regional communities •
As for 'households in outer urban areas and adjoining semi-rural areas', but potentially more severe, especially for those areas well removed from major fuel supply origin points. - Costs of fuels in most regional areas are already higher than in Brisbane. This difference could increase slightly under these scenarios.
Page 68 of 158
- Cost of many household supplies would also be raised, especially under the high oil price scenario. Industry Urban •
Competitive disadvantages / vulnerabilities – especially for industries / commerce with a strong trip content and high dependence on cars and light vehicles for employee commuting, supplies and marketing etc (eg marketing firms, small goods distribution). - The cost structure of such firms would rise relative to others; fuel price peaks and supply disruptions would further disadvantage. Some financial stresses are possible, especially under the High scenario. - However, much of the final impacts would be absorbed by consumers, through the price mechanisms.
•
Competitive disadvantages / vulnerabilities – for industries focussed on volume goods / commodities, and dependent on trucks or other forms of heavy transport. - The cost structure of such firms would rise relative to others; fuel price peaks and supply disruptions would further disadvantage. Some financial stresses are possible, especially under the High scenario. - However, much of the final impacts would be absorbed by client firms, and by consumers, through price mechanisms.
Regional, rural and mining For general industries and commerce in regional cities / towns: •
Similar to above.
•
And tourism would be likely to be adversely affected, especially inward overseas tourism and some internal driving-based tourism, under the High scenario.
Rural and mining industries: •
Competitive disadvantages / vulnerabilities, especially for industries focussed on volume goods / commodities / materials and dependent on trucks / heavy transport. - Broadly speaking, the size of the disadvantage would increase with the distance involved – from the industry centre to – fuel supply origin points and to port(s), and to one of the major state / regional centres (such as Brisbane and port, Townsville / port, Gladstone / port). - For export industries, the effects on sales may be reduced somewhat as (or assuming that) most competitor industries overseas would face similar cost rises. - But industries well inland, and without efficient freight rail access, would face substantial cost rises and losses of competitiveness. Some financial stresses are possible, especially under the High scenario. - This would reduce regional income flows and exacerbate the position of communities in some inland areas; in turn, raising the probability of: Regional de-population, and declining standards of grazing or crop land management (Note: refer also to the Taskforce paper from QDPI).
Page 69 of 158
Transport Transport is an intermediate service, and the vulnerabilities above for communities and industries are more fundamental in terms of social and economic wellbeing. •
Note: Changes in transport costs are usually passed through to client firms and consumers through market mechanisms. And pricing in Queensland for petroleum products is mainly driven by world markets: - Final retail prices are determined by world prices for crude and refined products, by national tax levels and by the state fuel subsidy, and then are influenced to an extent by local petroleum marketing variables (eg short term competitive factors, distance and regional cost factors). - Local prices therefore are mainly linked with the world market and any major shift in world petroleum prices will be quite directly reflected here. - In addition, the existing tax structure for petroleum products in Australia means that, if world prices rise to higher levels in the future, local prices will rise more directly with overseas price rises than in the past (as fuel excises would not be likely to rise at the same rate as the world oil price). and it is doubtful that Australian governments have the financial capacity or the will to provide major consumption subsidies to users of petroleum fuels for an extended length of time.
But transport is also an essential service in many situations, and it underpins many economic and social processes. Therefore any vulnerabilities in transport itself are relevant. The main areas of vulnerability identified for transport under the Central and the High oil price scenarios are summarised below. Air transport •
A major, rapidly growing part of the transport system; quite fuel intensive.
•
There have been periods of short supply of aviation fuels in the past, and parts of the industry are showing some signs of economic stress under current economic and oil market conditions.
•
Under the High scenario, high avgas / turbine fuel prices would lead to higher costs and fares, reduced demand, and to substantial pressures on profitability. - Operators without strong financial backing would find those conditions difficult, and some airline closures and service disruptions would be likely.
•
This might prejudice services in some areas at times, and could be a serious risk for some otherwise isolated communities.
•
Many airline services would remain vulnerable to fuel supply shortages, and to other risks to service quality, such as terrorism.
Road transport •
This is a major, rapidly growing part of the system; it accounts for the majority of passenger transport in Queensland, and for important parts of the freight task. Page 70 of 158
•
It is almost entirely dependent on petroleum products for its energy. - Its energy sources are petroleum based, except for small amounts of CNG in buses (~0.1% of the total), and minute amounts of ethanol. LPG accounts for 4.5% and petrol and diesel fuel for the rest.
•
This dependence translates to obvious vulnerabilities. The sector can be subject to supply shortfalls or interruptions, globally or for domestic market reasons.
•
Under the High scenario, such interruptions to world supplies are assumed to occur with some frequency and severity.
•
Further, most of the available projections of the world oil market indicate that exportable supplies will become even more highly centred in the OPEC cartel. - This means that export supplies will be increasingly subject to decisions made by governments - with a range of aspirations which may differ from ours both in the shorter and longer terms. - Export supplies, being more concentrated in locale, may also become more highly subject to terrorist attack (as has been happening with increasing frequency in recent years in the Middle East, West Africa, and Latin America), or to wars. -
Note: additional information on fuel supply risk issues is below, under: 'National Petroleum Supply Security'.
•
Within the road transport fleet itself, the major types of vehicles which would be more vulnerable to fuel price increases, in terms of running costs, are those with high levels of fuel use within their broad vehicle type.
•
The main examples are: - Cars and other passenger vehicles with high rates of fuel use / 100 km. The figure below reveals that for new models, there are major differences between them in terms of fuel use efficiency. The ratings vary some five-fold – from under 5 L / 100 km, to over 20 L / 100 km.
Page 71 of 158
Figure 23 - Australian Vehicle Models – by Cylinders and Fuel Use Current Light Vehicle Models, Australia - Cylinder Number vs Fuel Use 25
Fuel Use L / 100 Km
20
15
10
5
0 1
2
3
4
5
6
7
8
9
10
11
12
Cylinders
- Trucks and Light Commercial Vehicles (LCVs) – with higher rates of fuel use / 100 km and/or high rates of fuel use per tonne – km within that class and regional use pattern. That is, for LCVs, those vehicles with higher fuel consumption compared to others; and For trucks, those with higher fuel use compared to others; examples might be some rigid trucks (versus semis etc), and semi-trailers (versus B-Doubles and some road trains). National Petroleum Supply Security There are a number of arrangements nationally which aim to address some of the risks of petroleum supply shortages. •
See: 'Appendix C – National Fuel Security System' for more information on institutional arrangements.
There is a National Liquid Fuel Emergency Operational Response Plan; and in emergencies, there are national government powers to control industry stocks of oil and fuels, and to control bulk and retail sales of fuel. The Department of Industry, Tourism and Resources has indicated that Australia’s dependence on transport to sustain its economic and social activities makes it vulnerable to oil supply disruptions. •
And, stocks of crude and petroleum products held by industry throughout the supply chain recently have amounted to 47 days of consumption cover.
This stock level would be useful in addressing some possible market supply disruptions, especially those of moderate scale and duration. However it is questionable whether it offers any substantial supply security in the event of major or prolonged periods of world market disruption.
Page 72 of 158
Under those circumstances, nationally, some significant controls over petroleum distribution would be likely to be introduced. These would be likely to be managed to ensure that 'essential or priority services', such as health services, emergency vehicles etc, and some parts of industry, could continue. The most vulnerable sectors under those circumstances would include: •
Ordinary motorists;
•
Those dependent on cars for commuting; and
•
Those dependent on cars for carrying out basic activities such as shopping, health and education activities etc.
The regional impact of this situation might be influenced by any government arrangements made to ensure access was maintained to distant communities. Fuel Pricing and Exchange Rate Vulnerability Appendix Figure 2 - World Oil Prices (current prices) in $US & $A, and the Exchange Rate - shows world oil prices in both $US and $A terms. It is evident that prices for oil in Australian $ terms rose strongly during the late 1990s and 2000, influenced heavily by the decline in our exchange rate with the $US. This highlights an additional area of potential vulnerability in the future: •
Higher world prices if accompanied by weakness in the Australian currency.
For example: •
If a high world oil price scenario in $US terms were to emerge (or shorter periods of high oil prices), accompanied by exchange rate weakness in the $A, then the effects on local petroleum product prices would be even more severe. - Conversely, high world oil prices in $US terms would be mitigated to an extent if accompanied by a stronger $A.
Opportunities This section provides a short summary of a number of opportunities that could be presented, especially by either of the Central or the High Oil Price scenarios. •
It is not an exhaustive list.
Opportunities could be considered both in terms of the existing stakeholders / participants – communities, industries, parts of the transport and energy complex; and in terms of future participants and new approaches.
Page 73 of 158
Existing stakeholders / participants For existing stakeholders / participants, opportunities arise for some from the relative changes in purchasing power resulting from higher fuel prices. Those with the lowest impacts from this would be able to invest relatively more, and build wealth more quickly. In broad terms, those parts of the community, industry and the transport system least affected by fuel prices (and often the least vulnerable – see the previous section on vulnerability) would benefit most from this factor. Examples are below. •
Communities in urban areas – with relatively efficient design in terms of travel / trip needs, and public transport (or cycling) access. - Scope for advantage (relative to others) – more income for future income producing investments; and follow-up opportunities also from those investments; greater scope for sustained economic and social growth. - The scale of the advantages in the case of the High Oil Price Scenario would be considerable.
•
General industry – in regions / areas not highly vulnerable to high oil prices (eg in urban areas with efficient design as above). - Scope for advantage (relative to others) – eg more income for investments in income producing assets; follow-up growth opportunities through those investments.
•
Freight & passenger transport providers, and transport / vehicle manufacturers – with low energy / oil requirements - Eg 'hybrid vehicles', diesel vehicles, electric vehicles, fuel-cell manufacturers / distributors, rail systems / providers, efficient bus operations, motorcycles and scooters, some pipelines, sea freight operators. - Scope for advantage – commercial benefits, rises in market share, enhanced income for investments and for sustained growth. - The scale of the advantages here in the case of the High Oil Price Scenario would be considerable.
•
'Clean or cleaner fuel / energy' suppliers – whether petroleum or carbon based, electrically provided, or other. - Eg cleaner diesel fuels, CNG, bio-fuels and/or hydrogen and/or syn-fuels (assuming a positive net energy yield and a greenhouse gas emissions advantage, both on a whole of life cycle basis); cleaner electricity supply and its energy input sources. - Scope for advantage – commercial benefits, rises in market share, enhanced income for investments and for sustained growth. - The scale of the advantages here in the case of the High Oil Price Scenario would be very major. - Under that scenario there would be scope for the development of very significant new national energy sources and allied industries.
Note: See also paper from Department of Mines and Energy:
This is a major area, and is subject to much research and development currently, within Australia and overseas. Options range from geothermal, solar and other primary energy sources, to coal transformations and a range of biofuels.
Page 74 of 158
Flow-on Opportunities, Future Participants etc The summary above is at a fairly broad level – there would be underlying opportunities as well – for many industries, communities and individuals. Some examples: •
Communities – opportunities to establish their credentials as liveable and sustainable communities, towns or cities, capable of attracting intelligent workers / designers and viable modern industries. - And to help ensure that through the encouragement of support industries and personnel for those outcomes, support research and innovation centres, and provision of training in the new skills required.
•
Transport and energy supply sectors – many opportunities are implied in the section above and under the lists below.
•
And under the High Oil Price Scenario, there would be a likelihood of a major transformation in many of the transport systems in wide use in the future (with major changes needed in skill sets, training needs etc). - Eg 'hybrid vehicles', diesel vehicles, electric vehicles, fuel-cell manufacturers / distributors, rail systems / providers, efficient bus operations, motorcycles and scooters, some pipelines, sea freight operators. - Eg cleaner diesel fuels, CNG, bio-fuels and/or hydrogen and/or synfuels (assuming a positive net energy yield and a greenhouse gas emissions advantage – both on a whole of life cycle basis); cleaner electricity supply and its energy input sources. With wider application of these systems and sources, new opportunities for their supply, service and maintenance sectors would abound. And some revised approaches in freight, logistics and public transport might also need to be considered.
Policy Issues This report has raised many issues, including many for governments and for their policy consideration. It is acknowledged that this report has not fully quantified some of the effects of potential higher oil prices and supply instabilities. But the report has attempted to provide an overview of the situation and of the possible effects. •
And more detailed quantification and impact assessment may be warranted, given the issues raised here.
The following is a short summary of some of the more important issues for state government consideration and policy. It allows for both of the Central and High Oil Price scenarios, or combinations of the two.
Page 75 of 158
Short to medium term (2005-2015) Fuel prices within Queensland could remain high, with some fluctuations and also some supply disruptions, adversely affecting commerce and industry, and raising commuting and general access costs. •
These problems would be more pronounced under the High Oil Price scenario.
Other Problems: •
Inflationary pressures from oil prices and oil market disruptions. - Economic management challenges; tighter monetary policies nationally leading to higher interest rates and some investment restraints. - Stronger budget pressures (part offset from tax revenue from coal and gas trade). - Stronger pressures to help maintain the competitiveness of various industries and to boost investment in key enabling sectors.
•
Rising financial pressures on outer urban sections of the community (eg 'young families', those with low incomes).
•
Considerable increases in community demands for effective public transport, and for local / regional employment.
•
Rising competitive and community problems in outlying / inland regions and allied agricultural and mining sectors. - Community de-population, and declining grazing land quality. - Pressures rising for breakthroughs in rail access and in road transport and fuels technologies.
•
Petroleum storage policies and dependence increasingly questioned.
Implications for Governments: •
State petroleum storage and energy supply policies may need review. Strategies for liquid fuel supply and demand management, and for electricity supply, may need to be more highly developed, to allow for potential supply disruptions.
•
Attention may be needed to alternative fuels to ensure viable fuel systems and to address issues of energy supply continuity / risks; - Other states may be addressing alternative fuel and power systems, seeking energy security, a reduced carbon signature, and a competitive edge for their industries.
•
Financial and social assistance needs increase in outer urban parts of the community (eg 'young families', those with low incomes).
•
Demand rises for public transport investments in outlying urban areas; and for more effective locality based planning (eg to provide employment). - However there is a stronger acceptance of user and polluter pays forms of road pricing, which may offer a revenue solution to address those needs.
Page 76 of 158
•
Access cost problems rise in outlying / inland regions and allied agricultural and mining sectors. Community progression strategies for these areas may need review. - Further attention may be needed to social / community assistance. - And further attention to improved rail or sea freight access and to better technologies in road transport and energy.
•
State economic policies may come under some pressure due to higher interest rates, a more difficult investment climate, and the above demands for change (especially under the High Oil Price scenario).
•
There may be budget problems and pressures for more assistance for affected industries / regions.
Longer term (2015-2050) Fuel prices within Queensland could remain high and rise further. •
Under the High Oil Price scenario (or with $A depreciation) prices rise considerably, and oil market supply instabilities are occasionally very severe.
The implications of the Central Oil Price scenario would be broadly similar to the summary above for 2005-2015. •
Under this scenario however there would be some time for adjustments to be made in a smooth, relatively efficient manner.
The implications of the High Oil Price scenario however would be more severe. There would be stronger pressures for assistance and change in all the areas mentioned in the summary above for 2005-2015. •
And action would be required to manage and/or to reduce the existing rates of growth in transport fuels demand.
•
In addition, and if there are any major disruptions on the world oil market, there might not be time for some needed adjustments to be made in a smooth and efficient manner.
Page 77 of 158
Conclusions This report provides basic facts about transport and sets out the broad impacts of some possible oil market changes on transport in Queensland and on those depending on it. It has summarised areas of potential vulnerability, and some key policy issues. The report demonstrates that transport is a major sector in the State's economy and for the community. Almost everyone in the state uses some mode of transport or depends on it for basic supplies and services. Use of transport has been growing faster than the State economy, especially for freight; and the total energy consumption by domestic transport rose on average 3.3% per year over the 8 years to 2002-03. • And transport and fuel use are projected to continue growing strongly, by most modelling organisations, under anticipated population levels and basic economic and policy conditions. The state transport sector is highly dependent on petroleum products for its energy needs. Some 95% of the total for domestic transport is from petroleum sources – petrol, diesels, LPG, aviation fuels and fuel oils. •
And virtually 100% of the energy for Queensland's overseas transport (sea freight, airlines) is petroleum based.
The effects locally of possible futures for the world oil and petroleum markets were explored through use of 3 hypothetical scenarios, over the next 10 years, and, from 2015 to 2050: •
Low Oil Price;
•
Central Oil Price; and
•
High Oil Price.
Of these, the Central and the High scenarios are those which pose the main risks for Queensland, especially the High scenario. •
Central Oil Price – Prices average $US58-60 / brl in 2005 – 2015 (light crude); then rise slowly after 2015 – to $US70-80 / brl by 2050; moderate supply instabilities.
•
High Oil Price – Prices rise from an average $US54 / brl in 2005 – to $110-115 by 2050; supply instabilities occasionally very severe.
The main impacts and vulnerabilities under the Central scenario would be: •
2005-2015: Some fuel supply disruptions; with interruptions to commerce and industry. A higher plane of fuel prices; higher commuting and general access costs - Some financial pressures on outer urban sections of the community (eg 'young families', those with low incomes); increased demands for effective public transport systems. - Increased competitive and community problems in some outlying regions and allied agricultural and mining sectors.
Page 78 of 158
•
2015-2050: Further (moderate) rises in oil prices; supply disruptions - Moderate inflation consequences from some oil market disruptions. - Attention required to alternative fuels to ensure viable systems, and to address issues of energy supply continuity / risks; - Rising financial pressures on outer urban parts of the community; stronger community demands for effective public transport and for local or regional employment. - Rising competitive and community problems in outlying / inland regions and allied agricultural and mining sectors. Calls for breakthroughs in rail access and in road transport and fuels technologies.
Under the High Oil Price scenario, the above impacts / vulnerabilities would intensify. • 2005-2015: Real oil prices rise above recent ($US54 / brl, 2005 average) levels – to around $US70 by 2015. 2015 to 2050 – prices rise further to around $US110-115 / brl, over double the 2005 level; some severe price fluctuations as well. •
Much higher commuting and general access costs; also some severe supply disruptions, adversely affecting commerce / industry.
Some major problems: •
Some substantial inflationary pressures from oil market disruptions. - Economic management challenges; tighter monetary policies leading to higher interest rates and some investment restraints. - National macroeconomic effects – inflation, sectoral income redistributions, changes in confidence, savings, investment and income growth rates.
•
Stronger financial pressures on outer urban parts of the community; strong rises in community demands for effective public transport and local / regional employment.
•
Stronger competitive and community problems in outlying / inland regions, and allied agricultural and mining sectors, for example: - Community de-population, and declining standards of grazing land management; - Pressures rising for breakthroughs in rail access and in road transport and fuels technologies; and - Some reductions in overseas tourism in the state, and some disruptions to export trade.
These two scenarios, and especially the High Oil Price scenario, would pose a number of challenges for many parts of the community, industry and governments. For the State Government, some of the key issues to address would be: •
petroleum storage policies and energy strategies more widely; attention to alternative fuels and energy sources to ensure viable systems and to address issues of supply continuity;
•
strong pressures to help maintain competitiveness of various industries, and to boost investment in key enabling sectors – including for overseas tourism and exports;
•
action to manage the growth in transport fuels demand;
•
greater demands for public transport, and for local / regional employment creation;
Page 79 of 158
•
rising competitive and community problems in some outlying (especially western) regions and allied agricultural and mining sectors;
•
rising demands for social and community assistance – financial and social assistance needs rise;
•
pressures for enhanced rail investments regionally, and for other advances in transport and fuels technologies; and
•
stronger budget pressures (part offset from tax revenue from coal and gas trade).
Some further issues, challenges and opportunities for other parts of the community and the transport industry are set out within the report.
Page 80 of 158
Appendix A – References Australian Bureau of Statistics (ABS), 'Australian National Accounts: State Accounts, 2004-05', 5220.0. ABS, 'End-year net capital stock' (Table 88. Net Capital Stock, Industry by type of asset), 5204088. Australian Greenhouse Office (AGO, 2005), 'Tracking to the Kyoto Target 2005. Australia's Greenhouse Emissions Trends - 1990 to 2008-2012 and 2020.' AGO (2005), 'Transport Sector Greenhouse Gas Emissions Projections, 2005' (report based on modeling work by both BTRE and ACG (Apelbaum Consulting Group Pty Ltd)). Apelbaum Consulting Group Pty Ltd (2005), 'Australian Transport Facts 2005'. Apelbaum Consulting Group Pty Ltd (2005), 'Queensland Transport Facts 2005'. A report for Queensland Transport and Main Roads. Australian Financial Review (2006), 'Crude price may hit $100, says insider', 8 May. Bureau of Transport and Regional Economics (BTRE, 2003), 'FREIGHT between Australian CITIES, 1972 to 2001.' BTRE (forthcoming), 'Freight Measurement and Modeling: Road Rail Air and Sea'. Department of Industry, Tourism and Resources (2005), 'National Oil Supplies Emergency Committee', see: http://www.industry.gov.au/content/itrinternet/cmscontent.cfm?objectid=B7E479A7-3868-437A8FD4AE50E45F333D&searchID=60609 Department of Industry, Tourism and Resources (2006), see: http://www.industry.gov.au/content/itrinternet/cmscontent.cfm?objectid=8B5F1E0E-0855-A30AB4CE1CA0050EDA0A&searchID=61091 Department of Industry, Tourism and Resources (2006), 'Australian Petroleum Statistics'. Dodson J, and Snipe N (2005), 'Oil Vulnerability in the Australian City', Research Paper 6, Urban Research Program, Griffith University. Energy Information Agency (2006), '2006 Annual Energy Outlook', (the EIA is the the independent statistical and analytical agency, in the U.S. Energy Department. NTC (2006), ' "Twice the Task". A review of Australia's freight transport tasks.', report prepared by Meyrick and Associates, and Sinclair Knight Merz. Queensland Transport and Main Roads (2005), 'Connecting Queensland. Transport Coordination Plan for Queensland. 2005-2025'. Sydney Morning Herald (2005), 'Petrol tops consumer worry list', September 14, 2005.
Page 81 of 158
The Allen Consulting Group (2003), 'Benefits of Public Investment in the Nation's Road Infrastructure'; prepared for the Australian Automobile Association. The Australian (2006), 'Price fuels energy debate', 9 May 2006.
Page 82 of 158
Appendix B – Fuel Market Changes, Figures This appendix summarises some key overseas and local fuel price factors. Current world oil prices remain below their peak (in real terms) in the early 1980s. Appendix Figure 1 - World Real Oil Prices – 1968 to 2010 World and US Real Oil Prices Source: IMF, & US EIA. Projection = IMF 500
70
450 60
50
350 300
40
250 30
200 150
US - Price Index
World - Real Price Index
400
20
100
World Oil Price (IMF)
10
Real US Price to Refiners
50
20 10
20 05
20 00
19 95
19 90
19 85
19 80
19 75
0 19 70
0
Australian $A prices for oil rose strongly in the late 1990s and 2000, due to the decline in our exchange rate with the $US. This highlights an additional area of potential vulnerability in the future.
Page 83 of 158
Appendix Figure 2 - World Oil Prices (current prices) in $US & $A, and the Exchange Rate 0.90
80
0.80
70
0.70
60
0.60 US Oil - $US - LHS 31.87 28.99 28.63 US Oil - $A - LHS 31.51 32.19 32.64
50
0.50
$US / $A - RHS 1.0114 0.9006 0.8770 40
0.40
30
0.30
20
0.20
10
0.10
0
Exchange Rate - $US / $A
Oil Prices (US prices) - $US & $A per Brl
World Oil Price in $US & $A (current prices), and $US / $A Exchange Rate 90
0.00 1985
1990
1995
2000
2005
Australian petrol prices have not fluctuated as much in the past as have world oil prices. Australian tax structures and the refining margins are two factors responsible for this. Appendix Figure 3 - World Oil Prices & Australian Petrol Prices (current prices) World Oil & Australian Petrol Prices (current prices) - 1982 to 2005 120
80 US - Oil $US - LHS 31.87 28.99 28.63
100
US Oil - $A - LHS 31.51 32.19 32.64 Aust Petrol - A c / L - RHS 38.8 45 48.1
60
80 50
60
40
30 40
Australian Petrol Prices, c / L
Oil Prices (US prices) - $US & $A per Brl
70
20 20 10
0
0 1985
1990
1995
2000
2005
Brisbane's petrol prices over the past 6 years are shown below. The price reached a peak in real terms in the September quarter of 2005.
Page 84 of 158
Appendix Figure 4 - Brisbane Petrol Prices, 1999 to 2006 Unleaded Petrol Prices, Brisbane - Actual & Deflated Prices 0.80
120
0.75 110
Actual Price c / l
100 0.65 0.60
90
0.55 80
Real / Deflated Price
0.70
0.50 70
Price - Brisbane 0.45
Real Price - Brisbane
0.40
Ju nSe 99 pD 99 ec M 99 ar -0 Ju 0 nSe 00 pD 00 ec M 00 ar -0 Ju 1 nSe 01 pD 01 ec M 01 ar -0 Ju 2 nSe 02 pD 02 ec M 02 ar -0 Ju 3 nSe 03 pD 03 ec M 03 ar -0 Ju 4 nSe 04 pD 04 ec M 04 ar -0 Ju 5 nSe 05 pD 05 ec M 05 ar -0 6
60
The State fuel subsidy has ensured that Queensland's average prices are below those in other states. Appendix Figure 5 - Brisbane & Australian Petrol Prices, 1999 to 2006 Unleaded Petrol Prices - Brisbane & All Capitals 130
120
110
Price c / l
100
90
80 Price - Brisbane 70 Price - All Capitals 60
Ju n9 Se 9 p9 D 9 ec -9 M 9 ar -0 Ju 0 n0 Se 0 p0 D 0 ec -0 M 0 ar -0 Ju 1 n0 Se 1 p0 D 1 ec -0 M 1 ar -0 Ju 2 n0 Se 2 p02 D ec -0 M 2 ar -0 Ju 3 n0 Se 3 p03 D ec -0 M 3 ar -0 Ju 4 n0 Se 4 p04 D ec -0 M 4 ar -0 Ju 5 n0 Se 5 p0 D 5 ec -0 M 5 ar -0 6
50
Australia's petrol and diesel consumption has continued growing in the past 6 years. However there was a dip in the September quarter of 2005 during the period of peak prices.
Page 85 of 158
Appendix Figure 6 - Australian Road Transport Fuel Use & Real Petrol Prices, Quarterly, 1999 to 2006 Australian Transport Fuel Use (Petrol & Diesel) & Real Petrol Prices 0.85
9500
0.80
0.75 8500
0.70 8000
0.65
7500
Aust Fuel Use
Real Petrol Price (All Capitals)
Fuel Use, Quarterly - ML
9000
0.60
Real Price - All Capitals Linear (Aust Fuel Use) 0.55
Ju nSe 99 pD 99 ec -9 M 9 ar -0 Ju 0 nSe 00 pD 00 ec -0 M 0 ar -0 Ju 1 nSe 01 pD 01 ec -0 M 1 ar -0 Ju 2 nSe 02 pD 02 ec -0 M 2 ar -0 Ju 3 nSe 03 pD 03 ec -0 M 3 ar -0 Ju 4 nSe 04 pD 04 ec -0 M 4 ar -0 Ju 5 nSe 05 pD 05 ec -0 M 5 ar -0 6
7000
The following Figures for national fuel distribution are drawn directly from recent issues of: Department of Industry, Tourism and Resources, 'Australian Petroleum Statistics'. The main points here are: •
The flat trend visible in total petroleum product sales over the past 18 months.
•
Continuing growth in diesel and in aviation turbine fuel use.
•
The decline in petrol use over the past 18 months and 6 months.
•
The strong % rise in LPG use over the past year.
Page 86 of 158
Appendix Figure 7 - Australian Fuel Sales – Monthly, ML, by Fuel Type (various) Source: Australian Petroleum Statistics, March 2006. Total Petroleum 6,000 5,800 5,600 5,400 5,200 5,000 4,800 4,600 4,400 4,200 4,000 Mar-06
Jan-06
Nov-05
Sep-05
Jul-05
May-05
Mar-05
Jan-05
Nov-04
Sep-04
Jul-04
May-04
Mar-04
Jan-04
Nov-03
Sep-03
Jul-03
May-03
Mar-03
Autom otive Diesel Oil 1,500 1,450 1,400 1,350 1,300 1,250 1,200 1,150 1,100 1,050 1,000 Mar-06
Jan-06
Nov-05
Sep-05
Jul-05
May-05
Mar-05
Jan-05
Nov-04
Sep-04
Jul-04
May-04
Mar-04
Jan-04
Nov-03
Sep-03
Jul-03
May-03
Mar-03
Page 87 of 158
2,000
Autom otive Gasoline
1,900
1,800
1,700
1,600
1,500
1,400
Mar-06 Jan-06 Nov-05 Sep-05 Jul-05 May-05 Mar-05 Jan-05 Nov-04 Sep-04 Jul-04 May-04 Mar-04 Jan-04 Nov-03 Sep-03 Jul-03 May-03 Mar-03 550
Aviation Turbine Fuel
500
450
400
350
300
250
Mar-06 Jan-06 Nov-05 Sep-05 Jul-05 May-05 Mar-05 Jan-05 Nov-04 Sep-04 Jul-04 May-04 Mar-04 Jan-04 Nov-03 Sep-03 Jul-03 May-03 Mar-03
Page 88 of 158
LPG 490
440
390
340
290
240
Mar-06 Jan-06 Nov-05 Sep-05 Jul-05 May-05 Mar-05 Jan-05 Nov-04 Sep-04 Jul-04 May-04 Mar-04 Jan-04 Nov-03 Sep-03 Jul-03 May-03 Mar-03
Page 89 of 158
Appendix C – National Fuel Security System Australia has established a National Oil Supplies Emergency Committee (NOSEC); and a Liquid Fuel Emergency Act 1984 (Commonwealth). There is also a National Liquid Fuel Emergency Operational Response Plan. Under an emergency, the Act give the Minister for Industry, Tourism and Resources wide-ranging powers to control the drawdown, transfer and sale of industry stocks of crude oil and liquid fuels, and to control bulk and retail sales of fuel across Australia. The Department of Industry, Tourism and Resources has indicated that Australia’s dependence on transport to sustain its economic and social activities makes it vulnerable to oil supply disruptions. •
And also, that stocks of crude and petroleum products (held by industry throughout the supply chain) at the end of August 2005 amounted to 47 days of consumption cover.
Department of Industry, Tourism and Resources (2005), see: http://www.industry.gov.au/content/itrinternet/cmscontent.cfm?objectid=B7E479A7-3868-437A8FD4AE50E45F333D&searchID=60609 •
Stocks at the end of January 2006 amounted to 48 days of consumption
Department of Industry, Tourism and Resources (2005), 'Australian Petroleum Statistics', January 2006. •
Note: Stocks of automotive petrol and diesel specifically amounted to 19 and 17 days of consumption respectively.
Australia has also set up an Energy Infrastructure Assurance Advisory Group (the Energy Group) within a Trusted Information Sharing Network (TISN). The Energy Group includes representatives from the private sector and state and territory governments. •
It will assess medium to long-term vulnerabilities in the protection of energy infrastructure in Australia.
The Department of Industry, Tourism and Resources also has a program involving the mapping and assessment of supply chain vulnerabilities in each of the electricity, gas and liquid fuel energy sectors – identifying infrastructure that is critical to the supply of energy, and analysing contingency planning for each energy sector. Department of Industry, Tourism and Resources (2006), see: http://www.industry.gov.au/content/itrinternet/cmscontent.cfm?objectid=8B5F1E0E-0855-A30AB4CE1CA0050EDA0A&searchID=61091
Page 90 of 158
3.2
POTENTIAL IMPACT OF OIL SUPPLIES ON THE MINING INDUSTRY
Introduction Petroleum is a key fuel for all Australians. Queenslanders are very dependent on petroleum products which represent ~50% of all energy consumed in the State. The dependence of Queensland compared with other States is shown in Figure 1 which shows the per capita consumption for 2003-04 for each State. Per capita consumption of petroleum products - 2003-04 300
250
GJ
200
150
100
50
0 NSW
Vic
Qld
WA
SA
Tas
NT
Figure 1 - Petroleum consumption per head of population by State for 2003-04. Petroleum consumption data from Energy in Australia 2005 (ABARE). Population figures from the ABS website. Queensland’s dependence is less than Western Australia and the Northern Territory, but at 99 GJ (equivalent to about 2895 litres of petrol) per annum is still large. Mining in Context The mining industry is the second largest consumer of petroleum products in Queensland (Figure 2). All other industries are small consumers compared with the transport industry. Figure 3 compares the industries by percentage of total consumption.
Page 91 of 158
Petroleum products (PJ) consumed by industry - Qld 2003/04 15.51 0.96 17.26
8.42
30.83 25
Agriculture Mining Manufacturing and Construction Transport Commercial and Services Residential Other
270.01
Figure 2 - Comparison of petroleum product consumption by industry. downloadable database. ‘Other’ is solvents, lubricants, bitumen etc.
Data from ABARE
Petroleum consumption by industry as a percent of total state consumption Qld 2003/04 4% 0% 2%
5% 8% 7%
Agriculture Mining Manufacturing and Construction Transport Commercial and Services Residential Other
74%
Figure 3 - Percentage of total petroleum consumption by industry. For each industry, the petroleum consumption is only part of the total energy consumed (Figure 4).
Page 92 of 158
Petroleum products as a percentage of total energy used 120 100
93
90
100
%
80 50
60 40 20
10
17 2 O th er
Re sid en tia l
ru ct io n Co ns t
Tr an Co sp m or m t er cia la nd Se rv ice s
M an uf ac t
ur in g
an d
Ag ric
ul tu
re
M in in g
0
Figure 4 - Percentage of total energy consumption per industry represented by petroleum products (from ABARE database). As can be seen, petroleum represents 93% of transport energy consumption. Agriculture uses 90% of its energy as petroleum. Mining industry petroleum consumption is 50% of total energy use. It is a lesser component of other industries except ‘Other’ which is 100%. ‘Other’ as defined is a petroleum product industry. Mining Industry The 30.83 PJ of petroleum products consumed by the mining industry each year is equivalent to 778 million litres of industrial diesel. The gross consumption of energy for the mining industry (Figure 5) shows about 50% of energy consumed is petroleum products. The actual percentage of petroleum consumption will vary widely across the industry although it is difficult to obtain data to quantify the variation. Figures for Curragh Coal Mine in the Bowen Basin show a 72% usage of petroleum (28% for electricity) and bauxite mining an 82% usage (18% for electricity). Transport of ore in an open cut mine utilises diesel transport. These examples represent mining with minimal onsite processing. A remote mining operation which needed to generate its own electricity would use diesel for electricity generation.
Page 93 of 158
Final energy consumption - Mining Qld 2003/04 35 30 25
PJ
20 15 10 5 0 LPG
Other Petroleum products
Gas
Electricity
Figure 5 - Energy consumed by the mining industry. This does not include mineral processing which is included in ‘Construction and Manufacturing’ although some on-mine processing appears to be included in the ‘Mining’ figures. Exploration activities use petroleum products for field activities such as mapping and sampling, drilling, geophysical data collection and other support activities. This applies to both mining and petroleum exploration activities. There is a range of vehicles used from trail bikes to trucks. Drilling rigs vary from small trailer mounted rigs to large petroleum rigs. Aviation fuel is used for helicopters and airborne geophysical aircraft. Diesel is used for generation of electricity on remote mines. Gas fired power and grid power are used by the majority of mines in the state. New Hope Coal Australia in a submission to the Fuel Taxation Enquiry indicated that they used 16,063,000 litres of diesel to produce 2,068,000 tonnes of coal. This represents 7.6 litres per tonne of production.
Page 94 of 158
Figure 6 - Comparison of vehicle fuel consumption (From Westport Innovations Inc website). The Association of Mining and Exploration Companies Inc (AMEC) submission to the same enquiry included an example of a small gold mine in a remote area. To produce 100,000 oz of gold in two years, 10 million litres of diesel would be required. Sixty percent would be used for electricity generation, the remainder for transport. In this scenario, 100 litres of diesel would be required for each ounce of gold. In 2002, the medium sized Osborne underground copper/gold mine used 14,698,110 litres of diesel for electricity generation and 3,019,380 litres of diesel for vehicles (2002 Sustainability Report for Osborne). They also used 81,700 kg of LPG. The mine produced 38,149 oz gold and 46,109 tonnes of copper. The major use of petroleum products in mines is for transport, particularly ore or coal transport. The large trucks that haul ore are large consumers. A Caterpillar 777D capable of hauling 95 tonnes consumes 77 litres of diesel per hour according to its specifications. A truck that operated for 47,000 hours would consume 3.6 million litres of diesel. Figure 6 shows a typical consumption of about 1.5 million litres per year for one truck. Single trucks can now transport over 300 tonnes of coal per load.
Page 95 of 158
Research is being undertaken to reduce fuel costs for dump trucks. Lighter construction, hybrid trucks using a mixture of LNG and diesel, trolley assist on the ramps and more fuel efficient engines are just some of the methods being researched. In a sense, the impacts on mining are similar to transport in general and a similar mix of solutions need to be found. Many of the problems for the mining industry also apply to the construction industry where similar equipment is used, albeit of a smaller size. The key aspect of mining that is unique is the transportation of ore on the mine site. There are alternative handling systems such as conveyor belts and pipelines (reliant on water). The transfer outside the mine site is a transport industry issue. A significant proportion of Queensland’s coal is already transported by electric trains with seventy percent of the coal rail network electrified. The mining industry is highly dependent on liquid fuels, which makes it highly vulnerable to fuel price increases and shortages. The industry has been fortunate that recent high prices have occurred in conjunction with higher commodity prices. A decline in commodity prices and continuance of high oil prices would place marginal producers at risk. Fuel rebates and the soon to be introduced fuel tax credits, have provided, and will provide, some protection from the full price impacts.
Page 96 of 158
3.3
QUEENSLAND’S FOSSIL FUEL RESOURCES
Introduction Queensland’s future oil supplies need to be considered in an overall Australian context as Queensland produces only about 1.5% of Australia’s crude oil and condensate. The Australian supply of, and demand for, crude oil and condensate till 2020 is shown in Fig. 1.
Figure 1 - Potential crude oil and condensate supply for Australia (from APPEA website). The forecast curve is the mean probability of Geoscience Australia’s projections (see below). The demand curve is from ABARE’s projections. The data show that production will decline in real terms, and that the gap between supply and demand will grow rapidly requiring increased imports. The demand curve is based on ABARE’s projections of growth and on an oil price expectation that is in the lower range (US$20-$25 per barrel). The increase in production in 2008 will be the result of northwest shelf gas developments bringing new condensates to the market. The cost of imports to cover the supply – demand gap is $A200 billion at an oil price of $US40 per barrel (Figure 2). Australia will be increasingly dependent on international crude oil trade with all its risks and uncertainties.
Page 97 of 158
Although Australia produces a large volume of liquid hydrocarbons, she exports condensate and imports heavier crude oils required for diesel and transport fuels. Australia also imports petroleum products (10 542 Megalitres in 2003/2004). The impact of higher prices can be seen in the latest figures from ABARE (September, 2005). In 2003/04 Australia imported 23 498 ML of crude oil and refinery feedstock at a cost of $6,594 million. In 2004/05, the volume imported increased by 10% to 26 079 ML, but at a cost of $10,011 million, an increase of 50 per cent. By 2005-06 the cost of imports was $21,625 million for 41,023 ML. The short term impact can be seen in Figure 3, which shows ABARE projections to 2010. Although production will only drop marginally over this period and exports will increase, by 2009, imports will exceed production. This is due to the increased demand and the larger proportion of condensate that will be produced.
Figure 2 - CSIRO (2005) estimate of cost of supply – demand gap
Page 98 of 158
Crude Oil and Concentrate 40000
35000
25000
20000
15000
Megalitres
30000
Pr oduct ion Export s Import s
10000
5000
0 2003
2004
2005
2006
2007
2008
2009
2010
Ye a r
Figure 3 - ABARE (2005) projections of crude oil and condensate production to 2010. One way to decrease the dependence on imported crude oils is to make further discoveries in Australia. This will only be part of a strategy for the future, as it is extremely unlikely that sufficient reserves will be found to bridge the growing supply – demand gap. There is potential to close part of the gap and to provide a buffer as new liquid fuel sources are developed. Sources of Australian Oil The basins producing oil and gas were all recognised as petroleum basins before 1972. The majority of Australian basins are gas prone. Onshore liquid production is restricted mainly to the Cooper-Eromanga Basins in Queensland and South Australia (82% of onshore production), with lesser production from the Bowen-Surat Basins in Queensland, the Perth Basin in Western Australia, and the Amadeus Basin in the Northern Territory (Figure 4). The bulk of Australia’s liquid production (94.4%) has been from offshore. The Gippsland Basin in the Bass Strait is the only “giant” field discovered in Australia, but, as shown in Figure 1, the majority of the oil has been produced. The rest of the liquid production comes from the Northwest Shelf and is predominantly condensate. Australia’s liquid reserves are about 50:50 oil:condensate. The first commercial oilfield in Australia was developed in Queensland at Moonie in 1964. The Moonie oilfield, in the Surat Basin, is still producing today. Condensate and oil are produced from other fields in the Bowen-Surat Basins. Both oil and condensate are produced from the oilfields in the Cooper-Eromanga Basins in southwest Queensland and represent three quarters of all liquid hydrocarbons produced in Queensland.
Page 99 of 158
Figure 4 - Oil producing basins in Australia. Oil Reserves Projections Forecasting future production of petroleum or assessments of petroleum potential can be a contentious issue, both politically and commercially. Firstly, by their nature forecasts are uncertain and in the ensuing debate this uncertainty and the context for forecasts can frequently be forgotten—accidentally or deliberately—or perhaps inadequately communicated (Powell, 2004). Prediction of future production and of undiscovered resources for Australia are carried out by Geoscience Australia (previously known as Australian Geological Survey Organisation). For a period the group that carries out this work was attached to the Bureau of Resource Sciences (BRS). Forecasts of future consumption or demand are done by ABARE. The United States Geological Survey (USGS) also compiled data for Australia in their world-wide survey. Their data suggest much higher levels of undiscovered resources than the Australian data, but are based on different assumptions. The Australian data will be used herein as it covers short to medium term production. Undiscovered resources are subject to high levels of uncertainty and are discussed later in this paper.
Page 100 of 158
Prediction of production has inbuilt uncertainties. Figure 1 shows production at a 50% or mean probability. This can be considered the most likely scenario. However, it is possible that production will be less or greater. Figure 5 shows 10% and 90% probabilities. Even if the 90% probability (highest uncertainty) production were to be achieved, the supply – demand gap is only narrowed slightly. Because the majority of Australian liquid hydrocarbon production will come from condensate associated with gas, the timing of the production of these resources will depend entirely on the future development of the gas resources. 1200
800 600 400
'000 bbl/d
1000 Demand P10 P50 P90
200
8 20 1
6 20 1
4 20 1
2 20 1
0 20 1
8 20 0
6 20 0
20 0
4
0
Figure 5 - Projected production of liquid hydrocarbons to 2020 showing 10, 50 and 90% probabilities. Production projections from GA (2003) and demand from ABARE (2004). Future production will come from: • • • • •
identified commercial fields; reserves growth; enhanced recovery; identified non-commercial fields which become commercial; and new commercial discoveries.
Reserves growth may add some reserves. Australian field reserves have traditionally been underestimated, for example, crude oil reserves declared commercial before 1976 were underestimated by 45%. In 1982, condensate reserves were underestimated by two thirds. Initial reserves in Australia are always estimated conservatively. Reserves growth usually occurs early in the life of a field as development drilling and reservoir performance provide more reliable figures for calculating reserves. The existing crude oil fields are mature and there is little scope for further significant reserves growth. There may be some scope for reserves growth of condensate as the undeveloped gas fields are brought into production. However, modern 3D seismic surveys provide a much better tool for mapping fields and reserves are probably less underestimated than previously. Any reserves growth will only add a small increment to the resource base.
Page 101 of 158
When an oilfield is produced, as little as a third of the oil actually in the field is recovered. In some fields, as much as 60% of the oil in place is produced. The percentage of oil produced is a function of the porosity, permeability and composition of the reservoir, and the composition and viscosity of the oil. A number of techniques can be applied to increase production (enhanced oil recovery (EOR)). These cost money and as the price of oil increases it becomes more economical to utilise enhanced recovery. It is difficult to quantify how much oil could be recovered by EOR as each field is unique. In the USA, only about twelve per cent of current crude oil production utilises EOR (DOE figures). There is evidence that, in some fields, EOR accelerates depletion of the field rather than extending its life. EOR techniques tend to behave unpredictably. The role which EOR plays in future production will be to increase crude oil production as condensate already has about an 80% recovery rate. The cost of applying EOR to abandoned or shut in fields will vary depending on whether existing wells can be modified or whether additional wells are required. The economics of EOR for each field will be unique to that field. If a suitable profit can be made, then the technique will be applied. Costs of discovery (finding costs) are highly variable. Costs are dependent on many factors including the maturity of an exploration area, remoteness, depth of water, size of target and success ratios. Although it is often stated that finding costs are increasing, the evidence suggests that over the last decades finding costs have actually decreased, but with indications of a recent up swing. The decreasing cost is a function of improved technology, low risk targeting, competition between service companies and local factors. Figure 6 shows the finding costs for large energy corporations in the USA. The graph shows trends over time and the table shows regional variations. The average of about $7 per barrel made acquisitions attractive with reserves purchased for less than $4 per barrel.
Page 102 of 158
Figure 6 - Graph showing finding costs for major USA energy companies and table showing regional variation of costs. Debate continues as how attractive Australia is for explorers. The August 2005 AAPG Explorer contains information from a report to be released later this year from Wood Mackenzie. Figure 7 shows that offshore Australia provides an above average return on exploration.
Page 103 of 158
Figure 7 - Returns on exploration expenditure (source AAPG Explorer 2005 – figure by Wood Mackenzie). New Discoveries – Existing Basins New discoveries in existing basins are, in general, going to be small as the largest discoveries are usually made early in the exploration history in a basin. The exception is where a new play is discovered or technology enables production from tight sands. An example is the Tinowon play in the Bowen Basin near Surat. Gas was already known to be present, but advanced drilling techniques have resulted in large gas flows. This play may ultimately have gas reserves larger than the reserves produced to date from that region. Although the gas contains condensate, the volume of condensate will have only a minor impact on overall liquid hydrocarbon production. The existing onshore producing basins, whilst attractive for some explorers, will only provide small incremental increases in reserves. More oil fields will be found in the Cooper-Eromanga Basins particularly now that native title issues are being resolved in the area. However, the volume of oil will be minor compared to offshore production. In the existing basins offshore, the Gippsland Basin has little potential for further discoveries at the water depths of the current fields (deeper water potential is discussed below). The Carnarvon Basin is the main offshore basin with continuing discoveries of liquid hydrocarbons and reserves growth. The Bonaparte Basin is relatively under-explored but complex geology makes exploration difficult. Increasing oil prices will trigger ongoing exploration in the existing basins, but even the most optimistic predictions indicate that the overall reserves will decline.
Page 104 of 158
New Discoveries – Frontier Basins The only chance of maintaining the current rates of oil production would be to discover reserves outside the current production areas. However, exploration in frontier basins will take time and, if a major discovery is made, it will take 10-20 years to bring new fields into production. Although geological inferences can be made about a basin’s prospects, there is no guarantee that discoveries will be made. A major oil bearing basin requires a number of geological factors to all be present. To be oil or gas bearing a basin must have organic rich rocks (source rocks) that have been buried to sufficient depth for hydrocarbons to generate. There must be suitable conduits to carry the oil and gas to preexisting traps, which must contain suitably porous and permeable rocks and be sealed. The trapped oil must then be preserved. The absence of one of these factors means the basin has no prospects. With unexplored basins, inferences can be made from limited seismic coverage and by comparing the unknown basin with known basins. Any assessment of undiscovered resources in unexplored basins has high levels of uncertainty. Most of the World’s oil reserves are a small number of large fields that are a rare event in nature. Many onshore basins in Australia are under-explored, particularly basins older than the Cooper and Bowen Basins. One problem with older basins is the timing between trap formation and migration, and another the period of time that the deposits need to be preserved. Suitable basins include the Canning Basin in Western Australia, the Amadeus and Wiso Basins in the Northern Territory, and the Georgina Basin in Queensland and the Northern Territory. Two other basins in Queensland have some potential, the Adavale and Belyando Basins. There are liquids associated with gas in the Adavale Basin and oil has generated in the Belyando Basin and migrated into younger rocks. These basins may add some oil to the inventory, but are unlikely to add large reserves. Deepwater offshore basins in Australian waters have been estimated to hold 13 billion barrels of oil. If this oil did exist, it would need to be in giant accumulations because of the costs of extraction. Such a resource would meet Australia’s oil needs for over thirty years. However, none or only some of this oil might exist, and exploration to assess these basins will be expensive. Geoscience Australia no longer report resource assessments for frontier basins because it is difficult to get meaningful estimates. Deeper water of the Northwest Shelf offers good prospects for further discoveries of oil and gas. Because the petroleum geology is relatively well known for the shallower areas, estimates for undiscovered oil of 1.3 billion barrels are reasonable although there are some geological uncertainties. Basins in the Great Australian Bight have potential to contain reasonable sized fields provided the geological factors are all present. A number of offshore exploration permits have been granted in this area. The geology is insufficiently known to make meaningful assessments of oil resources. Eastern Australia contains offshore basins with potential for hydrocarbons. The Gippsland Basin may contain additional resources in deeper water. The Lord Howe Rise is a large area of continental crust lying in Australian, New Zealand and French waters. It contains a number of sedimentary basins with sufficient thickness of sediment to have generated hydrocarbons. These rocks are likely to be similar to those in the Gippsland Basin and the hydrocarbon bearing Taranaki Basin of New Zealand. Indications of hydrocarbons natural oil slicks and traces of hydrocarbon in seabed cores.
Page 105 of 158
These basins are in very deep water and remote from infrastructure. Some of the basins lie partly within Queensland territorial waters. These basins have a speculative estimate of 4.5 billion barrels of oil equivalent. There are basins with potential in Queensland waters. The Maryborough Basin is present both onshore and offshore. Exploration onshore has been unsuccessful, but there is a thick section of the basin offshore, southeast of Fraser Island. The basin is probably gas prone. Adjacent to the Maryborough Basin is the Capricorn Basin. The only drilling in this basin has been in the northern shallower part of the basin (two wells). A thicker sequence in deeper water at the southern end of the basin has potential for oil deposits. This is supported by natural oil slicks near Swains Reef. The basin with the most potential off Queensland is the Townsville Basin. The basin contains up to 6.5 km of sediment. Given the age and style of formation of the Townsville Basin it may contain oil shales of the same age as those in onshore eastern Queensland. These would form high quality oil source rocks. The regional seismic coverage indicates structures of a size that could contain 5 billion barrels of oil equivalent provided all geological factors are present. The risk is high given the lack of geological knowledge. Proximity to the Great Barrier Reef is the major impediment although it is well outside the World Heritage area. The producing fields of the Northwest Shelf are in areas of pristine reefs. Some of the Northwest Shelf reefs nucleated round oil seeps. Large scale production of sugar cane for ethanol production is potentially a greater threat to the Great Barrier Reef than oil drilling in the Coral Sea. In northern Australia, the offshore Arafura Basin is little explored and has potential for discoveries. Australia’s Oil Future Australia’s future oil position will be one of growing demand and a widening gap between supply and demand. This will result in a very large expenditure to purchase oil and petroleum products on the World market, a market that will see increasing competition for a resource that will probably begin to decline sometime in the next ten years. The only augmentation to existing reserves will be further discoveries in known areas. The only potential for significant reserve additions are from deep offshore areas. These do have the potential to add reserves and meet some future shortfalls. Their impact will be in ten to twenty years times, so might meet a medium term need. Long term, liquid hydrocarbons reserves in Australia will be limited. Exploration of the deep offshore areas to provide liquid hydrocarbons for premium use and to help bridge the change to alternative energy sources may need particular consideration of government. The exploration of the deeper Northwest Shelf basins may be a natural progression from the shallow water exploration and may require limited pre-exploration seismic surveys. The Lord Howe Rise basins need significantly more public data collected to enable areas with higher potential to be identified. There are plans in place for Geoscience Australia to collect these data. The water depth and remoteness will require a high oil price to attract explorers. If it were to prove gas prone then exploration interest will be reduced.
Page 106 of 158
The Townsville Basin requires more data and a risk assessment of potential impacts on the Great Barrier Reef. This basin has probably the greatest potential to make a difference to Australia’s oil inventory. If it were to prove dry or to contain limited resources, then Australia’s medium term outlook for indigenous crude oil supplies is reduced. In both the Lord Howe Rise basins and the Townsville Basin, exploration will depend on early success. If the initial large targets are dry, exploration will probably cease. For the under-explored basins onshore consideration could be given to incentives to explore. At present companies are content to drill safe targets even if they are small. Frontier basins have a higher risk, but have the potential for larger discoveries. Sources This summary is based on publications involving Commonwealth Government agencies. ABARE, 2004, Australian energy: National and state projections to 2019-20. Blevin, J., 2001, Hydrocarbon prospectivity of Australia’s remote frontier areas in offshore east and south-east Australia – examples from the basins of Lord Howe Rise. Proceedings PESA Eastern Australasian Basins Symposium, 25-35. Geoscience Australia, 2005, Oil and gas resources of Australia 2003. Geoscience Australia, Canberra. Longley, I.M., Bradshaw, M.T. & Hebberger, J., 2000, Australia’s petroleum provinces of the 21st century. PESA Journal 28, 21-42. Powell, T.G., 2001, Understanding Australia’s petroleum resources, future production trends and the role of frontiers. The APPEA Journal 41(1), 273-287. Powell, T.G., 2004, Australia’s hydrocarbon provinces – where will future production come from? The APPEA Journal 44(1), 729-740.
Page 107 of 158
Queensland Natural Gas Supplies Queensland has been a gas producer since the 1960’s. Conventional gas has been produced from the Bowen/Surat, Cooper/Eromanga and Adavale Basins. More recently coal seam methane has become an important contributor to Queensland’s gas supplies. The gas reserves for Queensland are about 180,000,000 x 103 m3 of which five-sixth is coal seam gas. In 2003-04, Queensland’s natural gas production was worth 380 million dollars. Although small compared to coal, the petroleum industry’s value (595 million dollars) is exceeded only by copper, lead and zinc, and extractive minerals Conventional Natural Gas Gas consumption in Queensland is rising rapidly as is production. Figure 8 shows cumulative production to 2001-02. The horizontal red line represents the known reserves in 1998. The actual reserves are higher (more than 180,000,000 m3x103). The rate of gas reserve discovery is slowing down in the Cooper-Eromanga Basin. Significant reserves have been added to the Bowen-Surat Basins in recent years. More than 50 percent of the current conventional gas reserves have been produced. The increasing production of coal seam methane is reducing pressure on the conventional gas resources. Some of the gas in southwest Queensland is sold to the southern states.
Cummulative Gas Production
100000000 90000000 70000000 60000000 50000000 40000000 30000000
cubic metres x 103
80000000
20000000 10000000 80 82 /8 3 84 /8 5 86 /8 7 88 /8 9 90 /9 1 92 /9 3 94 /9 5 96 /9 7 98 /9 9 00 /0 1
78
76
74
72
70
68
66
64
0
Year
Figure 8 - Cumulative production curve, conventional natural gas. Red line is reserves figure for 1998 – actual reserves are higher.
Page 108 of 158
The rate of discovery of gas reserves in the Cooper-Eromanga Basins is declining as smaller and smaller fields are being discovered. The only chance for significant reserve additions would be a new play type such as stratigraphic traps. The Bowen-Surat Basins have had a significant addition of reserves recently due to innovative drilling techniques to extract gas from sandstones containing reactive clays. It is difficult to estimate the total reserves likely to be found because of the heterogeneous distribution of the reservoir sandstones. These techniques can be applied to other sandstones in the Bowen-Surat Basin. The Denison Trough reserve situation is controlled by the current gas contracts - only sufficient reserves have been identified to meet the contracts. Additional resources of gas are present. Minor production has occurred from the Adavale Basin, and further gas resources may be found in this basin. Other basins with potential for discoveries are the Galilee and Georgina Basin. Coal Seam Methane Coal seam methane has become a major focus for gas exploration in Queensland. The existing coal seam production areas are shown in Figure 10. About one third of the gas consumed in Queensland is coal seam methane. Reserves are about 150,000,000 x 103 m3. Coal seam methane reserves are more difficult to define than conventional reserves and until some fields reach depletion, the actual proportion of gas in the reservoir that can be produced will be unknown. The total coal seam gas resource is a matter of conjecture and figures proposed should be viewed with caution. All coal contains some gas, but whether it can be recovered economically depends on a number of geological factors. Similar to coal seam methane basins in the United States of America, distinctive fairways occur where gas can be economically recovered. Even within fairways, production can be variable. One published estimate of likely resources for the Comet Ridge area suggests 130,000,000 m3 x 103 may be recoverable, being roughly equivalent to the total conventional gas volumes discovered to date. At present this is the best coal seam methane fairway identified in Queensland. It is highly likely that economic resources of coal seam methane will be significantly higher than the conventional gas resources. Some of the coal gas is contracted for the southern market (195PJ over 15 years). Baker and Skerman (October 2006) published Proved +Probable+Possible resources as 11,986 PJ based on industry figures. With Queensland’s current total gas consumption approaching 120 PJ/a, coal seam methane resources are sufficient to meet needs in the medium to long term. Unconventional Gas Queensland has other potential sources of gas. The Bowen Basin contains a number of tight gas reservoirs. The central part of the Bowen Basin and deep parts of the Cooper and Georgina Basins have potential for basin centred gas. Basin centred gas accumulations can be very large, but difficult to extract. Access to these resources will require technological solutions as the cost of exploring for and extracting such gas is higher than for conventional gas. These resources will become more attractive exploration targets once gas prices are higher. Basin centred gas is a major part of the current gas supply in North America. Gas is also produced from black shales in North America and Queensland has some potential for similar gas. The present contract system with cheap prices locked in for significant time periods means that only readily extracted gas will be produced. The unconventional gas is a potential source for the future when contract gas prices increase or a large spot market develops.
Page 109 of 158
Liquified Petroleum Gas (LPG) Queensland has very limited resources of LPG and most of the existing production is not sold within Queensland. In the first half of 2005, 173.46 ML (megalitres) were produced in the CooperEromanga basins and piped to South Australia. Production for the same period from the Bowen and Surat basins was 15.5 ML. This was available for use in Queensland. The remaining reserves in Queensland are 2050 ML. At the current rate of production this will last about six years. The prospects for further discoveries are limited, but some “wet’ gas will be found. In 2003/04 Qld consumed 13.3 PJ of LPG. The Bowen and Surat basins contributed 0.5 PJ, so Qld needed to make up 12.8 PJ. Refinery production is limited so Queensland needs to import most of her LPG. Some will come from overseas as Australia both exports and imports LPG (net exporter). The remainder comes from interstate. Australia has significant LPG resources associated with the gas in Bass Strait (declining production) and the North West Shelf (increasing production). Figure 9 shows the future sources of LPG in Australia.
Figure 9 - Natural LPG production to 2020. Central Eastern refers to the Cooper, Eromanga, Bowen and Surat basins. Figure from ABARE report to ALPGA (Australian Liquified Petroleum Gas Association). Long term natural LPG supplies will be linked to gas supply projects off northwest Western Australia. Coal seam methane rarely has a wet gas component so is unlikely to provide LPG.
Page 110 of 158
Gas in Queensland Given the existing reserves and potential for significant addition to reserves, Queensland’s domestic market is well placed for gas supplies well into the future. The PNG Pipeline is poised to proceed and will provide gas for large commercial users and the south-eastern Australian market. If the PNG Pipeline did not proceed, there is potential for alternate pipelines. The gas market is well placed in the short to medium term. Demand for gas further south may see more Queensland gas being sold interstate. Whether any capacity exists for gas to liquid conversion is difficult to assess. Generally the GTL process is seen as more beneficial in treating stranded gas resources rather than gas resources with ready access to markets. There may be potential for local scale GTL plants, but it would be difficult to anticipate large-scale development. Cost and price are the prime drivers for the GTL industry. The conversion of methane to liquids is an exothermic reaction that theoretically uses between 20-25 percent of the methane’s energy. In real processes the BTU losses will be about a third. On the other hand, diesel fuel made from gas has no sulphur and no particulate matter making it more environmentally friendly than diesel from crude oil. Patterson and others (2002) estimate that by 2025, the GTL industry might be producing 1,000,000 bpd worldwide. This will require an investment of US$ 20-30 billion in capital plus R&D over 25 years and 100 trillion cubic feet of gas reserves at less than US$1.00/mcf. Current US gas prices are over US$5/mcf. Reference Baker, G. and Skerman, R., 2006: Coal Seam Gas: a significant driver for new gas pipeline infrastructure in eastern Australia. APIA Annual Conference, Alice Springs October 2006. Patterson, R.D., Payne, R. and Tam, S. S., 2002: Potential impacts of Gas-to-Liquids on the oil and gas industry. The APPEA Journal, 47-57.
Page 111 of 158
Figure 10 – Coal seam methane in Queensland
Page 112 of 158
QUEENSLAND COAL RESOURCES Current and Historic Production Queensland has a large number of coal bearing basins (Figure 13). In the ‘age of steam’, coal was mined from the Ipswich, Surat, Bowen, Clarence Moreton and Maryborough Basins and at Mount Mulligan. With the development of export markets, the Bowen Basin and the Surat Basin, to a lesser extent, have become major mining centres. Exports come from the Bowen and Surat Basins whilst domestic supplies come from those basins plus the Callide Basin, the Tarong Basin, the Ipswich Basin and the Clarence Moreton Basin (Figure 14). Production trends since 1960-61 are shown in Figure 11. Queensland Historical Coal Production
250 Cummulative Production = 3053 Mt
Million tonnes
200
150
100
50
3
1
02 -0 20
9
00 -0 20
7
98 -9 19
5
96 -9 19
3
94 -9 19
19
92 -9
1
9
90 -9 19
7
88 -8 19
86 -8
5 19
19
3
84 -8
1
82 -8 19
9
80 -8 19
7
78 -7 19
5
76 -7 19
3 19
74 -7
1
72 -7 19
9
70 -7 19
7
68 -6 19
5
66 -6 19
3
64 -6 19
62 -6 19
19
60 -6
1
0
Year
Figure 11 - Annual production of raw coal for Queensland. In 2003-4, Queensland produced 203.7 million tonnes of raw coal from which 160.1 million tonnes of saleable coal was produced. Of the saleable coal, 135 million tonnes were exported and the remainder (25.1million tonnes) were used domestically. About 85 per cent of the saleable coal came from open cut mines with the remainder from underground. Of the domestic coal, 90.1 per cent was used for electricity generation. Export coals comprised about 90.2 million tonnes of coking coal and 44.8 million tonnes of thermal coal. Exports will continue to rise in the short term for both thermal coal and the higher value coking coal. Remaining Coal Resources Queensland has a large resource of coal. Coal continues to depth in all the coal basins and the Cooper Basin has thick seams at depth. No attempt has been made to estimate the size the total amount of coal in situ nor is it realistic to do so. However, resource data are available for a number of basins.
Page 113 of 158
The Department of Natural Resources and Mines compiles estimates of the amount of raw coal in Queensland basins. These data are compiled from available company information. Estimates of yet to be mined resources of operating coal mines are added to estimates of identified coal in undeveloped coal deposits to provide a state estimate. The company estimates either comply with the Australasian Joint Ore Reserves Committee (JORC) Code for Reporting of Mineral Resources and Ore Reserves – 1999 (updated 2004) or departmental guidelines for reporting. JORC estimates are preferred but some older estimates are not JORC compliant. Since the two methods use different parameters, the estimates must be considered a guide rather than a commercially viable figure. Only measured and indicated resources are included in the state inventory. Inferred resources would increase the figure substantially but are not usually reported. A download from the MERLIN database at 30 June 2005 provides a total estimate of 34,770 million tonnes of raw coal of measured and indicated status. At the 2003-04 production rate, this represents about 174 years supply. Figure 12 shows the production since 1960-61 and projected production in 2025 based on historic growth rates; production may double by 2023. Between 2003-04 and 2024-2025 about 7000 million tonnes will be produced so that in 2025 only 70 years of the current resource will be left. However, additional resources will have been entered in the inventory by then. Historical and Projected Coal Production 450 400
Million tonnes
350 300 250 200 150 100 50
19 60 19 61 63 19 64 66 19 67 69 19 70 72 19 73 75 19 76 78 19 79 81 19 82 84 19 85 87 19 88 90 19 91 93 19 94 96 19 97 99 20 00 02 20 03 05 20 06 08 20 09 11 20 12 14 20 15 17 20 18 20 20 21 23 -2 4
0
Year
Figure 12 - Projected production to 2025 based on historic trends. The gross figures give a misleading view of the resource base as it ignores what the coal is used for. Coking coal indicated and measured resources in the MERLIN database are 8,578 million tonnes. At current production rates the resource will last about 70 years. The thermal coal resource of 22,566 million tonnes will last about 265 years. The indicated and measured inventory also contains 3,625 million tonnes of coal which is unclassified. The inventory contains an additional 11,284 million tonnes of inferred resources. There is considerable scope for further additions of resources, particularly for underground thermal coal resources which will require continued higher prices to be viable.
Page 114 of 158
Gasification/Liquefaction Studies into gasification of Queensland coals are continuing. Most coal can be utilised for gasification using the developing technology, but vitrinite-rich thermal coals in the range of 0.7 to 0.9% vitrinite reflectance are optimal. A large number of thermal coals already in the inventory would be suitable. In situ gasification would provide access to a much larger coal resource, that below the current limits of mining. Perhydrous coals such as those of the Walloon Coal Measures of the Surat basin and the Reids Dome beds in the Denison Trough are coals that are highly amenable to in situ gasification. There are large volumes of other suitable coals within 1000 m of the surface in the Bowen, Surat, Clarence Moreton and Galilee Basins. Some of the coals currently subject to coal seam methane production, such as Fairview and Peat, would be suitable for in situ gasification. A number of issues have to be resolved prior to in situ gasification becoming a viable process. Controlling the combustion is essential, the escape of pollutants and groundwater contamination must be prevented or controlled, and surface subsidence must be minimised. The final product from gasification could be synthetic gas or a liquid depending on the processes utilised. Queensland coals have shown themselves to be amenable to direct liquefaction by hydrogenation, generating artificial oil. The coals of the Surat Basin are well suited to this process. The tests have been on mined coal. In situ liquefaction would provide access to more coal, but such a process is not technically feasible at present. A two step process of gasification followed by liquid conversion is feasible. Direct liquefaction at present can provide yields of about 4bbls/tonne of coal. To meet the shortfall in Australia’s oil demand in 2015 (approx 800,000 bbls/d) by coal liquefaction would require 73 million tonnes of coal per year, assuming that the coal products would meet all liquid use specifications (unlikely). Use of Coal Resource Queensland has large coal resources accessible to mining. It has much larger resources beyond the reach of current mining techniques. Mining techniques will undoubtedly be developed that will enable mining at greater depths. The main uses of Queensland coal are for export and electricity generation. As discussed above, Queensland coal could also be used for gasification and liquefaction processes. Gasification can be carried out in situ thus utilising deeper coals. Given the importance of coal to Queensland as an export commodity and as the source of cheap electricity to attract industry, it may be an opportune time to carry out a major review of Queensland coal and its future utilisation. The developing technologies need to be assessed for their future role and the coal resources best suited to the technology identified. Consideration needs to be given to planning the future development of the state’s coal resources. Should we, for example, export coals that might be ideal for gasification or direct liquefaction for local use? A strategic plan for development of the state’s coal resources would provide more certainty for coal utilisation in the future.
Page 115 of 158
Carbon Capture and Storage Future usage of coal is linked to greenhouse gas reduction strategies. Geological storage of carbon dioxide is one option that is being explored. Three broad options are being studied. The first is the use of depleted hydrocarbon reservoirs; the second is the use of deep saline aquifers; and the third is utilising coal as the storage medium. The use of coal to store carbon dioxide has some technical issues, but it also means that a coal used for such purposes is effectively sterilised as a resource. Experience overseas and economic modelling locally suggest that carbon dioxide could only be stored in coal if used for enhanced methane recovery from an operating coal seam methane field. Only limited parts of the coal resource will be suitable, and consideration needs to be given to other uses the coal may be suitable for.
Page 116 of 158
Figure 13 - Coal basins in Queensland.
Page 117 of 158
Figure 14 - Coal mines and infrastructure.
Page 118 of 158
Queensland Oil Shale Resources Queensland has a large oil shale resource. Despite their name, oil shales do not contain oil, but complex organic material derived mainly from algae. The oil shales have to be treated to extract a liquid product. For example, at the Stuart Oil Shale project, the oil shale was first retorted and the gases produced were hydrogenated to produce naptha and fuel oil. The remaining carbonaceous material was used as a fuel to heat the unprocessed oil shale. The Stuart Oil Shale project which started in 1999, remains ‘on hold’ with the next stage dependent on environmental approvals. The oil shale resources can be divided into three groups. The most important group are the Tertiary oil shales that occur in the coastal strip between Proserpine and Bundaberg and in the Duaringa area (Figure 15). These oil shales could yield more than 4,629 Gigalitres (equivalent to 27.774 billion barrels) of oil. This represents about 46 times Australia’s initial crude oil reserves.
OIL SHALE DEPOSITS In situ resource: •Alpha 14 Gigalitres •Julia Creek 1192 Gigalitres •Tertiary 4629 Gigalitres
Julia Creek
Alpha
300 km
Figure 15 - Location of oil shale resources. The Tertiary oil shales are geographically well placed near population and industrial centres. The Alpha oil shales belong to a group of oil shales called torbanites and are characterised by very high yields. However, they are smaller in size so the total resource is only 14 Gigalitres. Alpha is in a locality remote from infrastructure. Julia Creek oil shales were formed under marine conditions unlike the other types which were formed in freshwater. As such, the Julia Creek oil shales are geochemically different. Oil yields are lower than the Tertiary oil shales, but the deposits do cover a large area. A resource of 1192 Gigalitres has been identified. Julia Creek oil shales have a high vanadium content, and have been explored for vanadium as well as oil shale. If these oil shales were developed for oil, vanadium would be a valuable byproduct. They are remote from infrastructure.
Page 119 of 158
Although oil shales have been processed in the past, large scale commercialisation has met with little success despite billions of dollars having been spent. Rising oil prices will offset the economic costs of mining and processing shale oil. The main impediments to shale oil production are the total energy required to produce shale oil, the large volumes of water required, and environmental issues. The World Energy Council provides a pessimistic view of oil shale’s future, Perhaps oil shale will eventually find a place in the world economy, but the energy demands of blasting, transport, crushing, heating and adding hydrogen, together with the safe disposal of huge quantities of waste material, are large. On a small scale, and with good geological and other favourable conditions, such as water supply, oil shale may make a modest contribution but so far shale oil remains the "elusive energy". Likewise, a report prepared for the German Federal Ministry of Economics and Labour in 2002 downgrades the likely impact of shale oil on oil supplies because of economic and environmental factors. Shale oil may have a role to play, but economics, environmental issues and water availability are key factors that have to be balanced. Public acceptance of shale oil is another issue that needs careful consideration. The oil shales in the Gladstone area contain sufficient water that no external water source would be required. This does not apply to the deposits further inland.
Page 120 of 158
3.4 SHORT, MEDIUM AND LONG TERM IMPACTS OF RISING OIL PRICES ON QUEENSLAND PRIMARY INDUSTRIES Executive Summary Over the short term, rising oil prices will have a relatively significant impact on the profit margins of agricultural and fishery industries highly dependent on oil and oil-based inputs. However over the medium term, this study predicts these impacts to be mitigated to some degree, due to Queensland’s large supply of alternative energy supplies and transitional fuels. Over the long term even in the worse case scenario, should peak oil eventuate (i.e. cheap oil supplies are completely eliminated), farmers and (to a lesser extent) fishery operators have options available to adjust to life after the cheap oil era. This study expects a shift from conventional farming systems to precision farming systems over the long term and trawl fisheries to move operations closer to shore where possible. Conversely, the high price of oil is advantageous for the renewable energy industry, as it forces the speedier development and uptake of alternatives. The speed and success of these new developments and their pricing to users such as farmers will determine how protracted are the adverse consequences of the decline in oil reserves and associated shortages. The Queensland Department of Primary Industries and Fisheries (DPI&F) is investing in research and development that aims to increase profitability and improve sustainability. Improving input efficiency, including oil and oil-based products is an aspect of this research and development. Continued targeted investment in further such initiatives will be instrumental to ensure that primary industries are strategically placed to adjust to life after oil, should peak oil eventuate. Brazil’s large ethanol and expanding biodiesel industries have successfully reduced its dependence on foreign oil. These initiatives have placed them in a good strategic position to deal with any potential decline in oil reserves and associated shortages, mitigating the impacts of oil price rises. From a policy perspective, the case of Brazil demonstrates the potential benefits of investment and development of alternative energy supplies.
Page 121 of 158
Introduction The peak oil concept regards the end of cheap oil. It asserts that world oil production is about to peak, and will progressively fall, with the consequences of ongoing increases in the price of oil. In the past, oil prices have largely shaped the farming practices adopted by farmers, and rising oil prices can be expected to place considerable pressure on primary industries. A proper understanding of these pressures will be instrumental in developing appropriate policy responses to help producers adjust to rising oil prices. The first section discusses briefly the concept of peak oil. The next section outlines the model used throughout this report to discuss the impacts of rising oil prices on primary industries. The third section examines the dependence on oil of Queensland’s agricultural industries. Included in this section is a discussion of Queensland’s chemical industry’s dependence on oil, with specific emphasis on agro-chemicals and fertilisers. Chemical and fertiliser use and Queensland energy supplies are also outlined in this section. Section 4 details the possible impacts and responses at the farm level over the short, medium and long term. Section 5 details the possible impacts and responses of commercial fishers and presents a case study of the historical impacts of rising diesel prices in the South East Trawl fishery. This case study is potentially indicative of the impacts of rising diesel prices on commercial fisheries. Section 6 examines Brazil’s large ethanol industry, and how it has placed them in a strategic position to deal with any potential decline in oil reserves and associated shortages. The final sections report DPI&F policy recommendations and concluding remarks respectively. Concept of Peak Oil The peak oil concept refers to the end of cheap oil. Interestingly, in real dollar terms, oil prices are lower now than in the early 1980s when they were equivalent to around US$100 per barrel in 2005 dollars. Predictions of a peak have been around for a long time, but the latest prediction is that oil will peak in the next 10 years or so. Uncertainty surrounds such predictions as they are derived from reports on known reserves. However, there may still be many currently unknown oil reserves in areas in which it is not currently commercially viable to explore. Additionally, improvements in extraction technology coupled with rising oil prices may make extraction and exploration for oil viable in those oil-plentiful regions in the world where it is currently not economically viable (for instance, many shale oil deposits around the world are currently unviable). This will extend the life of the resource, allowing scientists and entrepreneurs time to research and develop alternatives. Rising oil prices will increase the competitiveness of alternatives and see such energy sources increasingly utilised. Australia is fortunate in that a diverse range of alternative energy supplies are available. These alternatives are discussed in a later section. Model As a result of peak oil predictions, policymakers have the problem of working out the best way to respond. Many of the typical proposed responses are to shield consumers and industry from rising oil prices by reducing taxes or by subsidising production. Policymakers should be careful as such responses can backfire, making both consumers and industry worse off and damaging the economy overall in the long run (see the recent example of Indonesia’s policy of subsidising petrol for commuter transport and kerosene for cooking)
Page 122 of 158
The impacts on the economy are measured by changes to total fuel cost (i.e. fuel expenditure), rather than just fuel price. Other factors affecting total annual fuel cost are fuel use efficiency (technical efficiency) and annual fuel usage as summarised in the model below. Annual Fuel Cost = Fuel Price × Fuel Use Efficiency × Fuel Usage Higher fuel costs send the appropriate market signal to consumers to increase vehicle fuel efficiency (by choosing more efficient vehicles) and reduce usage (by changing modes and destinations). The same applies to industry. For instance, if farmers are shielded from oil price rises they have less incentive to increase oil efficiency, for example by switching to more fuel efficient tractors and machinery. In rural areas, many primary industries are heavily dependent on transport. The costs of delivered inputs and costs of delivered outputs of many rural industries will be higher under rising oil prices. For export-competing industries, these effects may be reduced as overseas competitors will mostly face similar cost rises. However, for those industries well inland, and without efficient freight and rail access may face disproportionate cost rises and some loss of competitiveness as well. Rising oil prices over the long term may raise risks of rural communities depopulating; and declining standards of land management in rural areas. Overall, primary producers can be expected to become more sensitive to location and market proximity. International trading patterns may change over time in accordance with rising oil prices. Export-competing industries could be expected to shift their focus towards markets closer to shore. The extent to which world trading patterns change will depend on many factors (more significantly barriers to trade such as tariffs and bio-security protection measures will determine trading patterns worldwide), including oil prices. These changes are hard to predict. Either way, it could be expected that both domestic and international primary producers will become more sensitive to location and market proximity in the presence of continued oil price rises. Overall, rising oil prices should have only a relatively small impact on total economic activity, providing oil price increases are gradual and that the market focus to work, allowing both industries and consumers to respond to price signals. This assumes no major failure on the part of the market. However, even in the case of major failure, free operation of the price mechanism may be more optimal to government intervention (through subsidising production). Although all sectors in the Queensland economy are exposed to rising oil prices, some sectors are more exposed than others. The size of the impact on a particular industry will depend on both their direct and indirect dependence on oil and oil-based inputs. Queensland Agricultural Industries’ Dependence on Oil Scope of Queensland’s Agricultural Industries The gross value of production (GVP) of Queensland primary industry commodities for 2004-05 was estimated at almost $10 billion. This is a significant contribution to the Queensland economy. Table 1 presents the breakdown of GVP by primary industry.
Page 123 of 158
Table 1 - Queensland’s Primary Industry GVP for 2004-05
Industry Sugar Cane Beef Cattle Wool and Sheep Meat Pigs Cotton Grains and Pulses Dairy Cattle Fisheries Forestry Poultry Lifestyle Horticulture Vegetables Fruit Total
Gross Value of Production ($ Million) 815 3,100 160 205 435 560 215 295 785 325 1,400 785 780 9,860
%age of Total 8 31 2 2 4 6 2 3 8 3 14 8 8 100
Source: DPI&F Prospects Table 1 demonstrates that beef cattle, lifestyle horticulture and sugar were the three largest primary industry contributors to the Queensland economy in 2004/05 in terms of GVP. Oil use, both direct and in-direct, by primary industry is the focus of the next section. Oil Dependency in Agriculture Industrial agriculture has been called a system for converting petroleum into food. Since the 1940s, agriculture has dramatically increased its productivity due largely to the use of petroleum-derived petro-chemical pesticides, fertilizers, and increased mechanisation. This process has been called the Green Revolution. Pesticides and fertilizers require both oil and natural gas (which, being a non-renewable resource, will also peak) as starting points for their commercial-scale synthesis.
Page 124 of 158
Figure 1 illustrates the increasing consumption of fertilisers on Australian farms over the period 1979-2003. Australian Agricultural Fertliser Consumption 3,000,000
Kilotons of Fertiliser Used
2,500,000
2,000,000
1,500,000
Fertliser Use
1,000,000
500,000
19 79 19 80 19 81 19 82 19 83 19 84 19 85 19 86 19 87 19 88 19 89 19 90 19 91 19 92 19 93 19 94 19 95 19 96 19 97 19 98 19 99 20 00 20 01 20 02
0
Year
Source: FAO Stat Figure 1 - Australian Agricultural Fertiliser Consumption Figure 2 illustrates vegetable yields for the Australian Vegetable Industry over the same time series. This figure indicates steadily increasing yields in vegetable production over time. Vegetable Yield
300,000
250,000
Yield (Hg/Ha)
200,000 y = 3965x - 8E+06 2 R = 0.9179 Vegtable Yield (Hg/Ha)
150,000
Linear (Vegtable Yield (Hg/Ha)) 100,000
50,000
0 1975
1980
1985
1990
1995
2000
2005
Year
Source: FAO Stat Figure 2 - Australian Vegetable Yields 1979-2002
Page 125 of 158
This increase in demand for fertilisers has been largely met through imports. Figure 3 shows that domestic fertiliser production levels have been decreasing slowly over time while imports have been steadily increasing.
Fertiliser Imports versus Fertiliser Production 2,000,000 1,800,000 1,600,000 1,400,000
Kilotonnes
1,200,000 Fertiliser imports Fertiliser Production
1,000,000 800,000 600,000 400,000 200,000
19 79 19 80 19 81 19 82 19 83 19 84 19 85 19 86 19 87 19 88 19 89 19 90 19 91 19 92 19 93 19 94 19 95 19 96 19 97 19 98 19 99 20 00 20 01 20 02
0
Year
Source: FAO Stat Figure 3 - Domestic versus Imported Production Oil Dependency of Queensland’s Agricultural Industries An indication of the direct dependence on oil inputs of an industry can be extracted from the cash costs of the average operator in a particular industry. The following table reports this dependence. Table 2 - Input Use Expressed as a Percentage of Total Cash Costs (2003-04) Primary Industry
Fuel, Oil and Grease
Fertiliser
11.70%
Crops and Pastures Chemicals 10.58%
Fuel, Oil and Grease Dependency 34.71%
Wheat and other crops industry All Broad-acre industries Dairy cattle industry Beef cattle industry Sheep industry
12.44%
6.45%
2.24%
2.09%
10.79%
4.63%
4.99%
0.48%
10.09%
7.27%
0.03%
0.31%
7.61%
5.48%
0.88%
0.64%
7.00%
Source: ABARE Australian Farm Survey Results 2003-04
Page 126 of 158
Table 2 shows that the wheat and other crops industry at 12.4% is the most vulnerable in terms of proportion of costs spent directly on fuel, oil and grease inputs; other industries include beef cattle at 7.3%, all broad-acre industries at 6.5%, sheep at 5% and dairy cattle at 4.6%. Based on the above data, direct expenditure on petroleum products may not seem to be significant however agricultural industries are closely linked to oil-based products and services. For example, farmers indirectly use significant amounts of oil through energy intensive farm inputs such as crops and pastures, chemicals and fertilisers. The wheat and other crops industry is significantly more dependent on indirect use of petroleum based products than the other industries in Table 1. Other agricultural industries with similar or higher dependencies are cotton, sugar cane and horticulture 39. These industries are not included in Table 2 due to lack of data. If data becomes available, this table will be amended. Cash costs are only a proportion of total farm costs. Other costs that constitute a significant proportion of total farm costs, namely owner labour and capital, are not included in this estimate. The percentage dependency on oil and oil-based products for total cash costs would therefore be significantly less than that stated above. Regardless of the fact that the direct use of oil inputs to agricultural industries are generally only a small proportion of total inputs, there could be significant impacts where profitability is low. Rabobank (2006) states that “higher fuel prices affect food and agribusiness in two key ways; through lower consumer spending, potentially slowing demand for food, particularly at the higher quality, discretionary end of the market; and through higher direct business costs, with farms typically spending 8-10% turnover on fuel. A 40% increase in fuel price translates to around a 3-4% increase in overall business costs which, while unwelcome, is not sufficient in itself, to cause financial distress for most businesses”. Oil Dependency of Industries Linked to Agriculture Queensland has a large coal and gas resource base with a modest scale chemical industry focused on the local resource development sector (ACTED, 2006). The chemical industry (chemicals and fertiliser used by agriculture) is represented by the manufacture of: • • • • •
ammonia, ammonium nitrate and urea by Ticor and Orica at Gladstone; urea formaldehyde adhesive by Borden at Murarne; ammonium nitrate at Gladstone (using ammonia freighted from Incitec); ammonium nitrate plant at Moura; and ammonium phosphate fertilisers at Mt Isa (ACTED, 2006).
Petroleum comprises only a fraction of the of the cash costs of the chemicals and fertiliser industries. Other inputs are also used in the manufacture of chemicals and fertilisers. Table 3 presents the input structure 40 for the Queensland chemicals industry at 1996-97.
39
It is expected that these industries have similar cash costs to the wheat and other crops industry. This input structure is assumed to be representative of the input structure for chemicals and fertilisers used on Queensland farms today.
40
Page 127 of 158
Table 3 - Input Structure of Queensland Chemicals Industry (includes fertilisers, herbicides and other chemicals) at 1996-97 Industry All Other Intermediate Inputs Chemicals Petroleum and Coal Products Wholesale Trade Coal, Oil and Gas Road Transport Marketing Electricity Supply Total Intermediate Inputs Primary Inputs (Labour Capital) Total Production
GVP $million 90.2
% Intermediate Inputs 38.91%
% Total Inputs
52.9 45.9
22.82% 19.80%
7.86% 6.82%
31.9 18.5 11.3 10.7 10.4 231.8 440.9
13.76% 7.98% 4.87% 4.62% 4.49% 100.00%
4.74% 2.75% 1.68% 1.59% 1.55% 34.46% 65.54%
672.7
13.41%
100.00%
Source: OESR QLD 107 Sector Input-Output Table Table 3 shows that in 1996-97, petroleum and coal products accounted for 6.8% and 19.8% of total inputs and intermediate inputs respectively and coal, oil and gas inputs accounted for 2.8% and 8% of total inputs and intermediate inputs respectively for the Queensland Chemicals Industry 41. It should be noted that these estimates are based on different data and have no relation to those estimates reported in table 2. From this table it is apparent that oil price rises will affect the profitability of the chemicals industry to some degree. However chemical producers worldwide face similar issues. Chemical industries will respond at the margin to rising oil prices by improving oil use efficiency and investing in alternative energy sources. Fertiliser industries may consider diversification into: • • •
Effluent treatment; Feedlot waste; and Rock phosphate-based fertilisers.
The following example demonstrates such diversification. “Western Mining’s Corporation’s Queensland Fertiliser Project involves the manufacture of fertiliser, at Phosphate Hill near Mt Isa. The conversion of captured sulphur dioxide from MIM’s copper smelter provides the fertiliser project with a supply of sulphuric acid. After being railed to Phosphate Hill the acid is combined with phosphate rock to produce phosphoric acid, while an ammonia plant uses natural gas as its feedstock. The phosphoric acid and ammonia are combined in a granulation plant to produce fertiliser. The company has said it expects to be the lowest cost producer in the world. (Chemicals Technology, 2006)”. 41
These estimates do not include other oil-based dependant inputs such as road transport, marketing, rail transport etc.
Page 128 of 158
Table 4 reports Australia’s economic demonstrated energy-based resources as at January 2004. Australian reserves of uranium and coal account for a large proportion of the world’s supply of these commodities. In addition a large proportion of Australia’s coal supply is of a high quality, with low sulphur and ash content. Table 4 - Australia’s Alternative Energy Supplies
Knowledge of Australia’s known natural gas resources has increased dramatically over the past two decades, particularly in the North West Shelf of Australia. Around 90 percent of recoverable reserves of natural gas are located in this region in Australia. In addition to natural gas reserves, there is growing commercial utilisation of Australia’s reserves of coal seam gas. The majority of these reserves are located in Queensland and New South Wales. Queensland has 56 percent of Australia’s economic demonstrated reserves of coal seam gas (Geoscience Australia, 2005). Queensland has natural gas reserves located in the Surat, Bowen, Adavale and Cooper Basins in the south-west of the State with total reserves estimated at 2,200 petajoules. The gas is distributed around the State by pipelines. Like New South Wales, Queensland has abundant coal seam methane reserves in the Bowen Basin with more than 13,000 petajoules (out of 150,000 petajoules) of methane recoverable. The State also has extensive deposits of shale oil. Possible Impacts and Responses at Farm Level Farm production relies on many factors (water, soil type, crop selection, weather etc), including oil. Increases in oil prices can be expected to have a relatively significant impact on farm expenditures and incomes.
Page 129 of 158
Over the short term, farmers are ‘locked in’ to their current production processes and therefore, have limited scope to shift into other modes of production (for instance crops with higher gross margins, already invested in current machinery and tractors etc). This is compounded by the inability to pass on higher oil prices to consumers through higher food prices in the short to medium term. Those agricultural industries that operate in relatively un-concentrated markets and have some pricing power are better positioned to pass on higher prices than those industries that do not. It is unlikely that farmers are able to pass on increasing oil or other costs to the consumer. Australian farmers continually experience a cost-price squeeze. That is, costs of production (for instance input costs and labour wages) have risen more rapidly than commodity prices in real terms. To compensate for this, farmers have resorted on productivity improvements (e.g. higher yielding varieties). Over the short term, farmers are limited in what they can do to mitigate the effects of higher oil prices, although some options are available. As outlined previously, fuel price is only one of three components of fuel expenditure, the other two being fuel usage and fuel economy. Even though fuel prices rise, farmers can potentially reduce fuel expenditure through improving fuel economy and/or fuel usage. Such strategies will be discussed for the short, medium and long term. Short Term Farmers can respond at the margin to changes in price signals. For example, increased fuel/oil/petroleum prices may have accelerated the shift from conventional farming to minimum or zero tillage, decreasing fuel use on farms. Minimum tillage leaves plant residue on the soil surface after planting and requires considerable less oil than conventional-till that involves extensive field preparation prior to planting. However, these response strategies will only serve to alleviate the squeeze in profits associated with increased oil prices over the short term. Even after implementing such practices, increased oil prices can be expected to erode profit margins. Those farms that are more dependent on oil and oilbased products will be more impacted than others. Medium Term Over the medium term, oil price rises will see substitute energy sources becoming increasing utilized such as blended fuels, synthetic oils and natural gases. The use of transitional energy sources will serve to moderate rising oil prices in the medium term. Table 5 reports some comments about these transitional fuel alternatives.
Page 130 of 158
Table 5 - Transitional Fuel Alternatives (Medium Term) Natural Gas Biofuels (Ethanol) (Biodiesel)
Oil Shale
Plentiful Supply in Australia. Sourced from crops such as sugar and grain. QLD government is currently promoting ethanol production. Petrol added with ethanol added can reduce emissions. Currently researchers investigating whether ethanol can be extracted commercially from fibres. Currently the largest biodiesel plant in the Southern Hemisphere is being constructed in Narangba. Oil shale is stripped from mines, crushed and processed to generate oil. One of the world’s largest shale deposits is in Gladstone, Queensland. Currently not economically viable (trials conducted in Gladstone discovered this) However as price of oil rises, this will increase the viability of this resource. Some environmental concerns.
The agricultural sector is fortunate in that there are a diverse range of transitional substitutes available. Other sectors in the economy are not as fortunate, particularly the transport sector where there are limited alternatives available over the short to medium term notwithstanding a major breakthrough in the competitiveness of an alternative liquid fuel. Queensland also has a substantial source of feedstock (plant, animal and recycled food oils are all able to be used) which can be used for producing alcohol for biodiesel. Currently the largest biodiesel plant in the Southern Hemisphere is being built in Narangba using non-edible oil as feedstock and has a design capacity of 160 million litres a year. The significance of non-edible oil based feedstock is that it reduces the pressures on edible oils. Dr Humphreys (2006) said that current biodiesel capacity in Australia is about 75 million litres, with a forecast for this industry to grow to 360 to 750 million litres within three years. Technologies that provide greater fuel efficiency will also become competitive over the medium term. Farmers may also find market opportunities in growing higher-yielding industrial crops suitable for use in blended fuel production. In the short to medium term, producers can be expected to adjust application rates of fertilisers and chemicals in the presence of increasing oil prices. Some producers may become more reliant on nitrogen fixing crops such as chickpeas and soybeans and incorporate these into rotation. Some producers may switch to genetically modified crops that minimise fertiliser and chemical use. The prices that farmers pay for fuels are typically more volatile than other farm input prices, such as fertiliser, chemicals and general supplies. A large proportion of the fertilisers and chemicals used by Queensland farmers is manufactured using petroleum, and the prices of these inputs, as demonstrated by Table 3, are relatively sensitive to the price of oil.
Page 131 of 158
Long Term Over the medium to long term, farmers could replace inefficient farm machinery with more oil-efficient equipment. In addition, more advanced farming practices could be adopted, such as precision farming that optimises the use of chemicals and fertilisers and also controls traffic. As discussed later, such farming techniques are currently being adopted in some industries. Rising prices of oil will trigger development and utilization of other renewable technologies (solar, wind, hydrogen to name a few) from which all sectors, including agriculture may benefit. The speed and success of these new developments and their pricing to users such as farmers will determine how protracted are the adverse consequences of the decline in oil reserves and associated shortages. Over the longer term, increasing oil scarcity may facilitate a change in paradigm from more conventional farming systems, where emphasis is placed on heavy tillage and intensive use of inputs to precision farming systems, where emphasis is placed on farmer expertise and precise use of inputs. Although being further researched, precision farming techniques are already in place on Queensland farms. For instance, in the Northern region of Queensland grain farmers are using these techniques and reports from leading farmers in this region suggest that significant savings are being realised through the use of such techniques. Farm management is conventionally conducted on an average basis where whole paddocks are given the same treatment of crop inputs. However, variation in soil type, soil depth, topography/slope, or weeds can lead to variation in yield. For instance grain yield can typically range from nil to upwards of 10 tonne per hectare within the same field. The concept of precision farming is simply to manage this variation by matching inputs, such as fertiliser, with site potential. In this way crop yield is maximised while excess usage of crop inputs is minimised. With regards to increasing oil prices, precision farming can serve to ameliorate the negative impacts on farm profitability of rising oil prices. Table 6 demonstrates the typical characteristics of these two farming systems. Table 6 - Typical Characteristics of Conventional and Precision Farming Systems Conventional Farming Systems Reliant on technological advance
Precision Farming Systems Reliant on farmer expertise and wise application of technologies Monoculture Multiple crops grown Extensive use of fertilisers, pesticides and Reduced use of fertilisers, pesticides and other farm chemicals. other farm chemicals. Alternate sources of fertiliser and tight cycling of nutrients, use of natural cycles. Heavy reliance on fossil fuels. Less use of fossil fuels in production. Either way, reduced use of inputs and the use of greener substitutes will alleviate the pressure on the environment and natural resources as rising oil prices cause farmers to shift to less oil-reliant means to treat crops and pastures.
Page 132 of 158
Rabobank (2006) predicted that increasing oil prices may have an effect on the demand for food. Therefore, this may have an effect on the demand for agricultural products. Those agricultural goods that are relatively elastic (price-responsive) may be more impacted than those that are relatively inelastic. This is because consumers will consume inelastic goods regardless of the increase in the price (through rising oil prices). With regards to elastic goods, price increases will see consumers look to substitutes, including foreign goods. However foreign goods are also exposed to rising oil prices also, and therefore the effect of rising domestic food prices (through rising oil prices) is hard to predict. Farmers will adjust at the margin (short to long term) to produce more of what consumers demand, requiring farmers to become more in touch with the consumer (market-driven production versus production-driven production). Commercial Fisheries Commercial fishing is a fuel intensive business. Given that fuel costs have been steadily increasing in recent times and that these costs account for up to 30% of harvesting costs in Australian fisheries, the effects on operators have been extreme (ABARE, 2005). This problem has been compounded by a marked increase in average horsepower ratings of boats, particularly in the trawl fisheries. Also a factor is the increased travel distance to fishing grounds in response to over-fishing of some fisheries adjacent to major/convenient ports (ABARE, 2005). Case Study: South East Trawl Fishery FERM (2004) conducted a study to find the main factors affecting the profitability of the SET fleet. Profitability in this fishery has been worsening over the last five years, significantly explained by increasing operating costs. In recent times operators in the SET fleet have observed that profitability has been falling for the offshore and inshore sectors and increasing for the Danish Seiners. An ABARE (2002) survey found that costs are rising faster than revenue in the offshore and inshore fisheries, supporting claims by offshore and inshore operators in this fishery (Figure 4).
Figure 4 - Real Boast Cash Income, Source: ABARE Fisheries Survey FERM (2004) found that increased operating costs, notably fuel and repairs and maintenance were the main costs which have impacted profitability over these years. Other costs such as management levies, quota leasing costs etc. collectively had an impact on profits over time, but individually, had little impact on overall operating costs and profits.
Page 133 of 158
Fishing effort levels in the SET fishery consistently increased throughout much of the 90’s such that fuel costs over this period would have grown considerably. However, over the past five years, effort levels (Figure 5) have remained relatively constant, so that any increase in fuel costs in recent years would be largely attributed to an increase in fuel price (although some vessels may have travelled to more distant fishing grounds). The determinants of total fuel costs are discussed in a latter section 9 of this report). This is confirmed by fuel price data, depicted diagrammatically in Figure 6.
Figure 5 - SEF Trawl Effort, Source: FERM, (2004)
Figure 6 - Average Nominal Fuel Price 1998-2004, Source: FERM, (2004) FERM (2004) found that the main reason for these increases was the change in government policies on excise duties (government policy in 2001 replaced the former indexed fuel rebate with a capped rebate of AUD $0.38 per litre), and for repairs and maintenance due to an ageing fleet where 40% of the vehicles are over 30 years old. ABARE (2004) surveys of the SET fishery estimated that fuel costs account for between 18-25% of total operating costs for the inshore and offshore sectors, and around 10% for the Danish Seine fleet (Table 7).
Page 134 of 158
Table 7 - Fuel Costs as a % of total cash costs (2002/03 dollars)
Source: ABARE Fisheries Surveys (2004) Table 7 shows that fuel costs as a percentage of total cash costs in 2002-03 dollars has been increasing over this time period. Even though these have been increasing for the Danish Seiners, they are significantly less dependent on oil than the inshore and offshore operators in this fishery and as a result have been able to increase their boat cash income over this period. ABARE (2005) found that rising fuel costs, coupled with lower fishing receipts greatly reduced the economic performance of commercial operators in the Queensland Eastern Tuna and Billfish Fishery over the period 1998-99 to 2002-03. This is despite the fact that fuels costs accounted for between 13-15% of total operating costs (less than dependence of SET inshore and off shore operators discussed previously) for the average vessel in this fishery. The above case study demonstrated that commercial fishers range in their dependence to the price of oil, with the trawl fishery being the most dependent. Although fisheries probably have less response strategies available to them than farmers to mitigate the impacts of rising oil prices, there are some options. Fishery Response Strategies Commercial fishing vessels in Queensland predominantly run on diesel. Overseas commercial fishing vessels are also predominately diesel powered. Even though Australian fisheries are price takers and limited in their ability to alter their domestic/export production mix, rising diesel prices will affect most operators, both domestic and overseas, that are reliant on diesel to power their vessels. Over the short to medium term, commercial operators will respond at the margin to rising oil prices by moving operations closer to shore. They may also invest in more diesel-efficient engines mitigating the impacts of rising oil prices to some degree. Those operators that are able to invest in diesel-efficient engines may gain a competitive advantage over those operators that use less diesel-efficient engines both domestically and overseas. Should the price of oil continue to rise over the medium to long term, there may be a point where commercial operators replace their diesel engines with alternatives (such as biodiesel engines) providing the technology and economics exists to do so, and that the power generated by alternatives is sufficient to maintain operations. Vessels must use the right combination of inputs such as gear, hull size and crew to minimise the cost of a given harvest, including fuel. Increases in fuel prices can be expected to have a relatively significant impact on the incomes of fishery operators and their employees.
Page 135 of 158
Case Study: Brazil and Ethanol Figure 7 demonstrates increasing world ethanol production, in recent times.
Figure 7 - World Ethanol Production The principal reason behind this increase is strong growth in the Brazilian, US and Canadian ethanol industries since the 1980s. Brazil is the largest producer of ethanol in the world, followed by the US. Brazil has successfully reduced its dependence on foreign oil through the development of this large alternative fuel supply. Brazil’s reliance on oil imports has plummeted from 85 percent of its energy consumption in 1978 to 10 percent in 2002, according to Brazil’s National Petroleum Agency. Since the 1980s Brazil has developed an extensive domestic ethanol fuel industry upon sugarcane production and refining. Ethanol plants in Brazil maintain a positive (+34%) energy balance by burning the non-sugar waste from sugarcane, to some degree debunking theories that ethanol production is energy inefficient. However, there is a strong voice in the literature that argues that ethanol is inefficient. The case of Brazil demonstrates that it is possible to produce fuel from renewable resources. From a policy perspective, Brazil demonstrates the potential benefits of investment and development of alternative energy supplies. Policy Recommendations Based on the above, there are two principal recommendations of this report. Firstly, it is recommended that a close watching brief be maintained on the situation. This could be done through a working group of relevant government departments and industry bodies. There is a strategic need for government to be proactive, not reactive to peak oil.
Page 136 of 158
Secondly, it is recommended that DPI&F in collaboration with other government bodies and industry continue to lead and encourage investment in research and development of new, promising energy technologies (such as solar and hydrogen). In saying this, subsidising production of alternatives is not recommended for reasons outlined in the previous section. Government should not be in the business of ‘picking winners’. Queensland is energy rich, especially in coal. There is an opportunity to capitalise on this resource endowment, through Smart State investment in clean coal burning technology. Furthermore, with plentiful supplies of natural gas, there is an opportunity for government to encourage the transition from diesel to gas in Queensland’s primary industries if it becomes apparent that peak oil will eventuate. Economic growth and sustainable use of natural resources have to be complementary goals: clearly, economic growth that relies on the use of non-renewable natural resources (oil) can’t be maintained in the long term. DPI&F currently work in partnership with the Queensland Farmers’ Federation to actively promote and support adoption of Farm Management Systems (FMS) by the intensive farming sector in Queensland. The FMS dual objectives of sustainability and profitability are pursued through a systems approach to the integration of business and natural resource management practices at the property level. Consistent with continuous improvement approaches, FMS involves identifying and managing risks, in particular environmental risks, implementing appropriate management practices, and monitoring and verifying performance. DPI&F is, should continue, and should consider increasing research and development relating to the following: • • • • • • •
improving water use efficiency; decreasing oil use through precision farming, controlled traffic, zero till and low input farming; farming systems research optimizing cropping rotations e.g. lucerne, soybeans etc; integrated pest management; organic low input farming; mixed farming systems using livestock for weed control in cropping country; and decreasing chemical use by genetically modifying crops.
The objectives of such programs are to increase profitability and improve sustainability. Improving input efficiency, including oil and oil-based products is an aspect of these research and development programs. Historically, rising fuel costs have had a significant effect on trawl fisheries and have resulted in more operations closer to shore. Over-fishing has compounded this problem also, forcing operators to travel further to unexploited fishing grounds. As a consequence, better management of fisheries may mitigate the impacts of rising diesel prices. Concluding Remarks Targeted investment by DPI&F in further such initiatives will be instrumental, to increase farmers’ knowledge, awareness and most importantly, uptake of sustainable farming practices. DPI&F needs to be prepared, in the worse case scenario of cheap oil running out in the future, to ensure that primary industries are strategically placed to adjust to life after oil. Targeted investment and involvement in such initiatives are congruent with the Department’s mission to maximize the economic potential of primary industries on a sustainable basis. Page 137 of 158
References ABARE (2005) Australian Farm Survey Results 2002-04 to 2004-05. Australian Bureau of Agricultural and Resource Economics, Australian Government Publishing Service, Canberra. ABARE (2005) Australian Fisheries Survey Report 2004: Economic Performance of Selected Fisheries in 2001-02 and 2002-03.Australian Bureau of Agricultural and Resource Economics, Australian Government Publishing Service, Canberra. ACTED Consultants, 2006. Queensland www.chemlink.com.au/qld/chem.htm Chemicals Technology, 2006. www.chemcialstechnology.com.
Phosphate
Chemical
Hill
Industry
Fertiliser
Profile.
Project.
Site
visited
Site
visited
DPI & F (2005) Prospects for Queensland’s Primary Industries 2004-05 to 2005-06. Department of Primary Industries and Fisheries. FAOSTAT Database. Site Visited 20th February www.faostat.fao.org FERM (2004) ITQs, Ageing Boats and the Price of Fish, Fisheries Economics, Fisheries Economics, Research and Management Pty. Ltd. OESR 1996-97 Statistical Division Input Output Tables. Research, Queensland Treasury, Brisbane.
Office of Economic and Statistical
Rabobank Global Focus, 2006. Australian Agriculture in Focus. Site visited www.rabobank.com.au
Page 138 of 158
CHAPTER 4 – QUEENSLAND’S ALTERNATIVE ENERGY OPTIONS Queensland Energy Alternatives Mitigating oil vulnerability is a challenging prospect. Crude oil, unlike most other crude resources, contains a multitude of chemical products that are easily (comparatively) recovered. Hence utilisation of the entire product is remarkably high, with different product markets developed around this ease of separation and recovery. There is no simple, direct substitution for oil in its current role in our society. There are however a range of alternative options to cover the various uses of oil. The implications of this approach need to be carefully explored throughout the supply chain, as substitution, even into a few of the current uses for oil, will have a domino substitution effect throughout the resource sector, particularly in stationary energy. For example, a decision to try direct substitution into electric vehicles would substantially impact on Queensland’s current industry base and include: •
rapid development of additional power stations and transmission infrastructure to meet a potential doubling of Queensland’s electricity load;
•
re-evaluation and configuration of security of supply (how to keep vehicles moving during power failures, and more particularly how to manage those remote-area energy demands which are dependant on diesel generation);
•
Greenhouse emissions solutions for an already emissions-intensive energy sector; and
•
establishment of gas or coal-cracking facilities to provide the range of hydrocarbons currently produced during fractional distillation of crude oil to meet the chemical feedstock needs of a range of synthetic products (note this process is extremely emissions-intensive).
There is also the question on whether substitution to preserve the ghost of a resource is necessarily the best approach – a supply driven response to preserve the status quo fails to address the issue of demand. Demand-substitution is a frightening prospect for every government throughout the world, as it is highly dependent on governments either shepherding a suite of new technologies, or picking the “winner”. The following analysis provides an overview of the energy-resource sector, with particular attention on Queensland’s access to these resources, as direct and indirect substitutes for oil.
Page 139 of 158
Note there is no emphasis or importance attributed to the order in which these technologies are presented. Wind is not included in this discussion. The role of wind power as part of a renewable energy portfolio is undisputed, and the relatively unexplored potential of a range of Queensland sites is also recognised. However, the potential contribution of wind power to electricity generation in Queensland is based on increased elasticity in a constrained market – and not substantial increase in overall capacity – either through distributed or centralised generation. Hydro-power is also excluded, as this source of electricity generation is recognised to have already reached its peak contribution to the energy portfolio, and therefore has no real capacity for further substitution in any fresh-water form. Natural Gas There are numerous forms of “gas” currently in use internationally and in the Australian market as an energy resource, including various states of natural gas, liquefied petroleum gas (LPG), propane, ethane, hythane and even hydrogen. Natural gas will be the focus of this section, as this resource represents Queensland’s predominant gas profile. Note hydrogen is discussed further in the paper. Natural gas refers to any natural resource that is predominantly methane gas. Hence while terms like “conventional” and “non-conventional” are used in the industry, this is no reflection on the quality or content of the gas – only origin. Conventional has historically referred to gas associated with the “oil window”, the main source of world supply, and initially a waste stream of oil extraction. Today however, many non-conventional forms of gas are price-competitive, and readily extracted, such as Queensland’s principal gas reserves, coal seam methane. The message here is simple – an abundant supply of methane that is readily extractable is a prized commodity, no matter where it comes from. Natural gas is a fossil fuel, and therefore has a Greenhouse emissions profile. However, because of its chemical structure, it releases substantially less carbon emissions than either coal or oil when used in electricity generation. This and the responsiveness of gas-fired power stations have made natural gas the energy “transition” fuel of all developed and emerging economies, considered a necessary component of any country’s energy portfolio. The Oil Window – where to find gas The discovery of conventional gas is intricately tied with exploration for oil. At 2,300 metres (m) below the surface, temperatures are high enough to convert (crack) large organic molecules into oil – carbon chains of five to twenty carbon atoms in any one component. As the depth of the well below the surface increases to 4,500 m, the temperature continues to increase, cracking molecules down to a single carbon atom with four hydrogens attached – methane gas. The range of rock within the 2,300-4,500 m band is termed the “oil window”. However, any rock that has ever existed below 4,500m has the potential to harbour gas suitable for production.1 A minor amount of oil has been discovered outside of the oil window (at 5,200m), however this exception is attributed to abnormally low temperatures or rapid sedimentation during rock formation. Solution gas refers to methane that has migrated into the oil window and dissolved, while gas caps occur when there is more gas present in the oil window than the oil is able to absorb. This gas forms a cap of gas above the oil, and can be used to increase oil extraction. Adapted from Beyond Oil – the view from Hubbert’s Peak, Kenneth S. Deffeyes, 2005
Page 140 of 158
Like the early days of oil refining, gas in its relatively early development is a wasted resource. Compared with coal or oil, natural gas is potentially the most chemically exciting hydrocarbon that man has ever discovered. With its simple chemical structure (one carbon atom and four hydrogen atoms), it is readily converted or synthesised into just about any other hydrocarbon chemical (including oil) provided there is enough energy available. But this is not how most of the available gas resources in the world are used. In 2004, worldwide gas demand expanded to 2,784,000 gigalitres (GL) 42. Over 30% of all gas demand is exhausted through electricity generation. That is, the direct burning of gas to pressurise a turbine and generate electricity. This is the lowest order use of gas 43. The World Energy Outlook 2006 predicts close to half of total gas demand in 2030 will be used for electricity generation. In 2005 Australia’s production of natural gas (38, 884 GL) 44, including coal seam methane, met just under 1.4% of worldwide demand. Most of Australia’s natural gas reserves reside in Western Australia (State jurisdiction), or just off the Western Australian coast (Commonwealth jurisdiction). 45 All export of Australian gas resources occurs through Western Australia’s reserves. As a result the price of gas on the eastern Australian seaboard is low (approximately $3.00 per GJ) compared with international gas prices, as all gas production is exhausted by localised domestic demand, and consequently shielded from international price indexing. This has both a positive and negative effect on Queensland gas supplies, which are predominantly sourced from coal seam methane: •
the lower price, in combination with government policy 46 has driven a faster, deeper penetration of natural gas uptake in Queensland, and necessary interest in infrastructure investment; but
•
a lower price also encourages a reliance on cheap gas, potentially stifling long term investment interest through extended capital recovery of investment. Hence long term gas surety projects like the Papua New Guinea or East Timor pipelines are unlikely to proceed, at this time, through lack of cost competitiveness.
Although Queensland’s gas consumption is expected to treble between 2004 and 2030, a high proportion of this growth is expected through gas-fired electricity generation. A significant uptake in residential gas, as local distribution networks increase in both southeast and regional Queensland centres, is also anticipated to contribute to growth. Hence, although Queensland gas reserves are estimated to meet Queensland’s demand for approximately 100 years, this is based on electricity generation, industry use (including agricultural products), and residential use. Discoveries of coal seam methane gas reserves are continuously revised upwards, suggesting that it may be some time before we have a comprehensive understanding of the size of this resource.
42
World Energy Outlook 2006, International Energy Agency, November 2006. Peak Oil Paradigm Shift, Bilaal Abdullah. 44 Energy in Australia 2005, Australian Bureau of Agricultural Research and Economics, 2005. 45 Key Statistics 2005, Australian Petroleum Production and Exploration Association Ltd (APPEA). 46 The Queensland Energy Policy – A Cleaner Energy Strategy, May 2000. 43
Page 141 of 158
However, the potential uses for natural gas are far greater than those currently exploited in the Queensland market. As a direct substitute for oil, gas has considerable potential in both transport fuel and chemical feedstock applications. As demonstrated by the Brisbane City Council over the past 6 years, compressed natural gas (CNG) is considerably successful as a fuel in mass transport vehicles. However, it is not readily available throughout petrol stations around Queensland – which inhibits uptake of CNG passenger vehicles (i.e. the family car); and because of this insufficient uptake of CNG vehicles, there is limited CNG refuelling capability at service stations throughout Queensland. An innovative solution has been developed by FuelMaker Corp (partly owned by American Honda) which introduced compressors for home fuelling in 2002. Ten thousand units were sold in the first year at approximately US$1,000 each.47 For this type of solution to be applied in Queensland, reticulated gas networks would need to be substantially developed beyond today’s minimal infrastructure, particularly in South East Queensland. Home fuelling also limits a car’s use – requiring alternative transport when travelling out of range of the family home. Natural gas is the most obvious choice for synthetic oil production, using “Gas To Liquids” (GTL) technology. However, the technology is high cost. Installing a GTL plant costs approximately $2 billion (US) for an 80,000 barrel of synthetic oil per day plant – and the ongoing operation continues to be high cost, as the conversion process is extremely energy-intensive, and uses most of the gas required in the process. 48 Qatar Petroleum has successfully developed this technology in South Africa, driven by the international trade restrictions imposed during Apartheid and a lack of endogenous oil. World Energy Outlook 2006 predicts that GTL will emerge as a significant new market for gas by 2030, although the overall share of gas demand will be less than one percent. Most of this growth is expected in Africa and China. Qatar recently entered into a GTL plant partnership with one of China’s national oil companies. Note however that greatest growth in gas is expected to come from distributed generation. Natural gas has significant potential as a feedstock fuel for fuel cells. The Australian fuel cell company, Ceramic Fuel Cells Limited (CFCL), has developed stationary energy fuel cells that internally reform natural gas into hydrogen, before transforming into electricity. The efficiency of these two transformations to electricity output exceeds the efficiency of a gas-fired power station. However, because the CFCL unit is designed for a household or small building, and is therefore a distributed energy solution, Australian governments have demonstrated little interest to date. Key messages Whatever direction the Queensland Government chooses to take in relation to oil, gas will feature prominently in the solution, directly or indirectly. However, any action involving gas also requires several years lead-time, some rigorous planning around the current role of gas, and future projections based on the current role. In addition, any planning must recognise that while there are many roles that gas can play, there is insufficient gas for the resource to fulfil all roles at the exclusion of other resources.
47 48
Beyond Oil – the view from Hubbert’s Peak, Kenneth S. Deffeyes, 2005. World Energy Outlook 2006, November 2006, page 129.
Page 142 of 158
Coal For both this section and hydrogen, the available literature on future viability is significantly polarised, pitting the two resources as a choice of one over the other. Notably, most literature is not written by scientists in either of these fields. For this reason, a joint interview was conducted with Dr Kelly Thambimuthu, Chief Executive Officer of the Centre for Low Emissions Technology, and Dr Andrew Dicks, Senior Research Fellow, ARC Centre for functional nanomaterials. Both scientists are internationally renowned for work in their respective fields of clean coal technology and hydrogen, and have provided ongoing advice to Queensland Government on these technologies. The intent was to explore the differences of opinion between the two scientists on the future directions of these supposedly competing technologies – remarkably, there were none. Coal is a carbonaceous rock consisting of layers of partially decomposed plant and vegetable matter, formed over 100-400 million years, depending on the coal type. 49 It is therefore a nonrenewable, fossil fuel. Scientists estimate every metre of coal has derived from 120 metres of plant material. Coal is one of Australia’s most important minerals. More particularly, Queensland’s economy is built on the back of coal export markets. Australia accounts for 7% of world black coal production, 59% of which comes from Queensland. In 2005, Australia was estimated to hold 9% of the world’s coal reserves, and is the largest exporter of coking coal. 50 During 2004, 68% of world coal was consumed for electricity generation. A further 11% was consumed in coking. 51 The proportion of coal-based electricity within the electricity generation sector will continue to grow internationally, driven by the transition of developing nations, which also happen to have substantial endogenous coal deposits. 52 However, in Australia, the proportion of brown and black coal-based electricity generation is projected to decline during 2004 – 2030. Although over 50% of electricity generation will continue to be sourced from coal, movement away from coal will be directly substituted into gas. 53 Future coal directions, both internationally and in Australia, are highly dependent on low-emission technologies developing successfully, to mitigate the intensive Greenhouse profile of coal power generation. Through investment in the Centre for Low Emissions Technology (CLET), the Queensland Government has clearly committed to the long term future of coal. However, a clean coal solution is, if fully backed by required funding, and timely installation of demonstration projects, at most optimistic projections, 10 years away. 54
49
www.bmacoal.com – What is coal? World Energy Outlook 2006, November 2006. 51 World Energy Outlook 2006, November 2006, page 131 52 World Energy Outlook 2006, November 2006, page 127 53 Energy in Australia 2005, ABARE, page 43. 54 Interview with Kelly Thambimuthu, 17 November 2006. 50
Page 143 of 158
What exactly are clean coal technologies? These are technological developments that either reduce Greenhouse Gas emissions from coal-based electricity generation, or provide a means of sequestering emissions underground. The two dominant types of coal-fired electricity generation where most research funding is currently directed are integrated gasification combined cycle (IGCC) and the more recent funding for oxyfiring, with compatible capture and storage technologies. Ultra-supercritical power stations, and variations of this type of technology generate electricity more efficiently and with lower Greenhouse Gas emissions. However, the capacity to capture and store emissions exiting from these technologies is currently non-existent. As IGCC and oxyfiring gasify coal prior to electricity generation (as opposed to direct combustion) there is opportunity to capture, separate and store emissions from the process. Note that IGCC technologies can also be applied to gas and biomass. If capture and storage technologies are successfully developed for coal, arguably they should also be able to be applied to gas and biomass. However, where IGCC is coupled with capture and storage technologies, whether the fuel used is coal or gas, the cost of carbon dioxide abatement is lower when the fuel is converted to hydrogen rather than electricity 55. That is to say converting coal or gas to hydrogen in a “zero emissions” environment is cheaper than converting the same fuel to electricity. Progressing towards hydrogen production from coal can contribute to the research window required for parallel development of hydrogen technologies as part of the transition towards a hydrogen economy. 56 Attaining a hydrogen based economy will however rely on producing hydrogen from a range of hydrocarbon sources, and coal’s participation is predicated on successful IGCC capture and storage technologies. Because coal is a mixture containing carbon and hydrogen, (as well as some nuisance elements like sulphur and nitrogen) it too can be synthesised into any other hydrocarbon chemical – at a cost. “Coal To Liquids” (CTL) plants are in operation today, in both South Africa and China. As with gas, lack of access to oil has driven the South African plants, and China, with a rapidly growing transport sector, is investing in every opportunity. CTL plants cost in the order of $5 billion (US) to install, are even more energy intensive than gas to liquid (GTL) plants, and subsequently extremely Greenhouse intensive. Although a CTL or GTL can theoretically be optimised to produce petroleum, diesel is cheaper and easier to achieve. The same can be said for the range of petrochemical feedstocks from crude oil production – these are all achievable with coal – at a high cost. With significant deposits of black coal, Queensland is strategically positioned to benefit from clean coal technology developments. However, it is not clear on what basis the current reserves estimates are projected – one hundred years based on the current profile of activities – but what would this look like on the basis of substitution.
55 56
CLET position paper, Dr Kelly Thambimuthi, August 2006. An agreed view by both Dr Kelly Thambimuthi and Dr Andrew Dicks.
Page 144 of 158
Key message Coal is an abundant Queensland resource, with significant potential. However, this potential is caveated with quick successes in clean coal technology research, and an unlimited financial investment – these are not guaranteed results. Coal’s role in an oil constrained world is more likely to be as an indirect substitute, either through electricity generation – or hydrogen production for fuel-cell applications, including vehicles. The value of CTL technology in Australia is questionable, based on price and Greenhouse Gas intensity. Solar Solar energy is the capture and use of energy from the sun either by direct photoelectric effect, or thermal (heat). Most solar use in Australia tends towards on-site generation, for homes and small buildings. One of the most successful applications of large scale solar energy is the 300 MW power station in the Mojave Desert of California, in the United States. However, overall penetration in the world market is remarkably low, and not even registered in the World Energy Outlook 2006. This is a deceptive outlook, as solar technology has improved significantly over the last 15-20 years. Technology acceptance is hindered by its limited generation of 8-12 hours everyday, and significantly less on overcast days. The technology does not suit large scale, base-load generation. However, from the perspective of managing peak demand, solar energy to manage spikes in electricity demand during hot days makes sense. Consequently, there has been significant discussion within Queensland Government regarding the sale of air-conditioners with a solar panel. Solar in no way contributes to direct substitution for oil. However, it does have a place as a means of electricity generation. This may become clearer as the federally-sponsored Solar Cities Trial on Magnetic Island, Townsville, progresses. The proposal includes connecting 650 homes on Magnetic Island with 1-1.5 kilowatt photovoltaics. Each photovoltaic will offset individual household electricity consumption, and export to the grid when in excess. This is the largest form of distributed generation ever undertaken in Queensland, and presents significant learning opportunities for greater integration of solar power into the future energy portfolio. To date, solar technologies penetration has been led by project development housing, based on ecohousing estates. In addition, uptake of solar hot water was particularly successful under the combined funding support of Federal and State Government. Solar hot water systems are one of the hot water options under the Sustainable Housing Code. The ultimate challenge for solar energy development is electrolysis of water. This is an energy intensive process, but currently viewed as the long term source of renewable hydrogen, by splitting water into its chemical constituents of hydrogen and oxygen. Significant technology development is still required before solar power becomes a significant contributor to the electricity generation portfolio. Compared with most energy technologies, research investment is low, and will continue to be until a major world sponsor becomes involved. However achievements on such a low funding base have been remarkable – and the industry appears ready for breakthrough technologies.
Page 145 of 158
Key message Solar power has no direct substitution value for oil. However, its potential for greater substitution in the energy portfolio remains to be seen. This is a technology with potential to pay for itself very quickly with the right technology breakthrough. Geothermal Energy Electricity generation through geothermal energy capture is an embryonic industry in Australia. However, the potential of this resource is substantial, with approximately 19,000 Petajoules of estimated heat energy located in the Eromanga Basin alone, a high proportion of which is located in Queensland. Geothermal resources can occur as hydrothermal reservoirs, geo-pressured brines, magma and hot dry rock. In Queensland all significant geothermal reserves discovered to date are in the form of hot dry rock, with a few minor hydrothermal reservoirs (such as near boiling water from the Great Artesian Basin, used to supplement power at Birdsville) and hot springs. Hot dry rock refers to the heat released by localised tectonic activity and radioactive decay of crustal rocks, up to 5km below ground. Heat is harvested by fracturing hydrothermal rocks, and recovering water subsequently pumped through the fractured seam. The near boiling water is in turn introduced into a steam turbine for electricity generation. This technology has been proclaimed to have the potential to supply all of Australia with relatively emissions-free electricity. There are however a number of significant hurdles to overcome to supply substantial baseload power to Queensland, let alone the rest of Australia. These include: •
if the resource stopped producing, assets and supporting infrastructure would be stranded;
•
most hot dry rock resources are over 1,000 kilometres from any human settlement;
•
supplying base-load electricity in quantities suitable to justify the distance between generation and end-use requires high grade, cost intensive infrastructure, replicated over extreme distances. Current estimates suggests several billion dollar investment just in transmission infrastructure;
•
current estimates also suggest a lack of cost-competitiveness with existing energy generation, even with modest carbon taxes;
•
approximately 30 year cost recovery on asset-investment; and
•
energy security risks, through increased centralisation of energy generation, and one main transmission network. Reliance on geothermal for most of Queensland’s electricity needs exposes the transmission network to a range of physical environment and security risks to manage, including the potential for all of Queensland to lose power at once.
Page 146 of 158
However, increasing emissions management pressures through climate change may well drive the emergence of this industry. In addition, identified resources to date are a result of oil and gas exploration – hence identifying additional resources closer to the electricity network is an exercise yet to be undertaken. The Department of Mines and Energy is currently developing legislation to enable exploration and production (beyond the five year exploration licenses currently issued under interim legislation). Key message Geothermal has significant potential, yet to be explored. While the barriers are substantial, a move towards substantial increased electricity generation (as substitution in transport) has the potential to drive resolution of these issues. Biomass (does not include biofuels) There are 2.5 billion people in the world today using biomass for cooking. That is fuel-wood, charcoal, agricultural waste and animal dung. However, in Australia, biomass is used as a stationary energy fuel. Bagasse, or cane trash, is the most common form of biomass in Australia, followed by wood-waste and other forms. Traditional use has revolved around the inefficient burning of the cane waste to offset the use of coal boilers, and gaining green credit through the offset of coal, under the Mandatory Renewable Energy Target (MRET). While there are some efficiency gains to be made in the utilisation of biomass, the resource is unlikely to provide any significant substitution opportunities for oil. Its current use in onsite generation appears the most useful choice for waste utilisation. Key message Biomass is unlikely to provide substantial opportunities for oil substitution, direct or indirect. Biofuels There are two biofuels available internationally, and in Australia – ethanol and biodiesel. They are however, two remarkably different products, and should be treated accordingly. Note that despite the various mandates discussed below, the Federal Government has only set a target of 350 megalitres of biofuels by 2010, less than 1% of Australia’s current use of fuel in transport. 57
57
Australia’ Future Oil Supply and Alternative Transport Fuels, Interim Report, September 2006, Senate Inquiry, Pg 20.
Page 147 of 158
Ethanol Ethanol is a curiously represented fuel in Australia. While it is a biofuel, with a maximum component of 10% (vehicle manufacturers have not endorsed a higher ethanol component under their warranties) by blend in petroleum, this biofuel is at best a fuel extender. Hence while ethanol has the potential to provide some ease to the petroleum market when supply and demand are in tight equilibrium, its effect when demand exceeds supply is at best marginal. The Federal Government’s recent decision to compel increased acceptability of ethanol in vehicle manufacture at greater than 10% is an interesting move. With current rainfall patterns, Australia does not have sufficient producer land to justify diversion into ethanol crops (sugarcane, sorghum or otherwise); hence if ethanol is mandated, imported ethanol is more likely to fill the created opportunity. The perception of ethanol in Australia, until the past year of sustained high oil prices, has been largely undermined by unscrupulous fuel adulteration by a few operators in New South Wales, using kerosene, paint thinners, and other non-compliant additives in fuel. There have been no recorded instances in Australia where ethanol-blended petroleum has led to engine damage, although suppliers do advise that some minor modifications be made to most vehicles (minor hosing). Major fuel companies continue to argue the benefits of ethanol are marginal or questionable (increased fuel consumption) while ethanol lobby groups claim ethanol to be Greenhouse neutral It should be noted that ethanol is a remarkably successful product in Brazil, and in a sense it is a direct substitute for oil. Vehicles are modified to run on 80% ethanol, and government support through the value chain, including farmer subsidies, policy, mandatory standards is particularly high. In addition, ethanol crops in Brazil are in a climate zone less likely to experience drought. There is current research in Queensland into ethanol production via lignocellulosics – essentially harvesting ethanol from plant waste material through the destruction of lignocellulose. This research is at an early stage, but is particularly promising for the Queensland sugar industry if successfully developed. The proportion of recoverable ethanol impact on the fuel market is relatively unexplored at this time. In the interim, the Department of State Development is exploring the potential of ethanol-based engines. Key message Ethanol is a fuel extender in petroleum, important for its potential to maintain some oil market elasticity in Australia. However, its role in oil substitution is limited, at this time, but has some unquantified potential to increase in the future. Biodiesel Biodiesel is the lead biofuel in Europe, not ethanol. However, despite targets and grower subsidies (usually through land subsidies rather than crop) uptake is relatively low. Biodiesel can be manufactured from a range of resources – effectively any oil bearing crop (nuts, seeds), animal render, and waste oils, including cooking, manufacture and industrial.
Page 148 of 158
Australian production of biodiesel is still emerging, however, the fuel has immense potential. Unlike ethanol, biodiesel looks chemically similar to petroleum-based diesel, and therefore poses no issues for engines. Although currently only blended at 5%, there are sufficient trials, and evidence of ongoing usage around the world where substantially higher concentrations of biodiesel have been used (up to 90%). The credentials of this fuel are also undisputed, resulting in cleaner tailpipe emissions, and improved engine performance. In the absence of timely Federal Government industry support, the biodiesel market is emerging in pockets, assisted by direct community support. However the Queensland Government recent support for this fuel is assisting emergence of an industry in South East Queensland. As an outright oil substitute, the ongoing issue will be availability of feed-stock. Given the oil-recycling capability for biodiesel production, there is an extended market of available product. Biodiesel production also profits in time of drought, as there is little competition for low quality tallow. Key message Biodiesel, like ethanol, will be limited by availability of feedstock. However, unlike ethanol, there is greater diversity in the feedstock required for biodiesel production, and therefore greater potential to adapt production to maintain a constant output. Considering the minimal government attention directed at this industry to date, government support in the future could make a significant difference to its role. Hydrogen As stated under coal, much of this section is derived from an interview with Dr Kelly Thambimuthi and Dr Andrew Dicks. Hydrogen is the most abundant chemical element on earth. When hydrogen gas is used in fuel cells it converts to water. It is high energy and extremely clean. The problem however, is hydrogen gas does not occur in significant, harvestable quantities naturally. This means it must be stripped from other chemicals, such as water and hydrocarbons. However, as stripping hydrogen from water is extremely energy intensive (and therefore cost prohibitive) it is not a commercial option for access to hydrogen at this time. Since hydrogen is found in all hydrocarbons, next to water, they are the most abundant quarry for producing hydrogen gas. Most hydrogen production today is through steam reformation of gas, capture of hydrogen as a by-product of crude oil refining and steam reformation of coal. Hydrogen is touted as the future energy carrier for our society because it represents greater efficiency. Whenever energy is converted from one form to another, there are always losses. In the case of burning a hydrocarbon to generate electricity, the energy losses represent over half of the embodied energy in the fuel. Processing hydrogen in a fuel cell for electricity generation will lose between 10-20% of the embodied hydrogen energy. Hence hydrogen represents the opportunity to produce more energy with less fuel.
Page 149 of 158
Importantly, breakthroughs in the last two years have exceeded breakthroughs in history of hydrogen as a fuel source. This has been a little difficult to understand, as one of the fundamental blocks to hydrogen development is market interest. While there has been technology push, there has been no market pull – and the two elements are critical for technology breakthrough and commercialisation. 58 It would seem the fundamental driver for hydrogen development now, in its 5th cycle, is the investment by Daemler-Chrysler, Shell and Ford in Ballard (Canada) fuel cells in 1997 – mostly because of a fear of being marginalised in the future, along the lines of tobacco companies today. Opportunities in Australia are surprisingly encouraging. Hydrogen expertise in the form of research and development is promising in pockets throughout Australia, Queensland holding a high proportion of this expertise. The Queensland Government has failed to capitalise on this expertise to date. Queensland research on nanomaterials for fuel cells, and new materials for hydrogen storage has proved particularly promising. The Federal Government has recently recognised the importance of maintaining this momentum by developing a Hydrogen Materials Alliance, effectively a flagship cluster providing $3 million over three years to universities in Australia to continue this work. Work sponsored under this group includes biomass gasification, and localised steam reformation for hydrogen production, unprecedented directions in hydrogen work to date. However, the fundamental question with hydrogen is how long before it can be commercially available? There is no simple answer. Hydrogen development relies on the parallel development of hydrogen production, fuel cells (and potentially other hydrogen technologies), delivery and storage systems. This is essential to avoid the problems currently facing the coal industry – attempting to marry two independently developed technologies into a compatible solution. Sustained high oil prices over the last twelve months have led to unprecedented international commitment to realisation of a hydrogen economy. One of the real questions for a hydrogen economy is the path taken to achieve. A traditional view has held that fuel cell vehicles would herald a hydrogen economy. However, the incredibly successful development of the electric hybrid vehicle, particularly the diesel-electric hybrid suggests the strong possibility of a hydrogen economy transitioning through electric hybrid to hydrogen-electric, to hydrogen fuel cell. Understanding these pathways is essential to the positioning of the Queensland Government in the future, as the implications to energy delivery are fundamentally different. In an electricity-led transition to hydrogen, greater emphasis is placed on large scale hydrogen production at one end of an electrical network. But a direct transition into fuel cells relies on a hydrogen distribution network. A potential intermediate step down this pathway is the introduction of hythane – a mix of natural gas and up to 20% hydrogen, that can be entered into the existing gas network with additional compression, and combusts like natural gas. Power stations are built with a 40 year life span, infrastructure usually up to fifty years. Hence although hydrogen may seem to be 30 years away, decisions in the next few years may mean the difference in stranded infrastructure. The sheer magnitude of Queensland’s ribbon energy networks provides little tolerance for poor delivery infrastructure decisions.
58
Interview with Dr Kelly Thambimuthi and Dr Andrew Dicks.
Page 150 of 158
Key message A hydrogen-based economy, or transition into a hydrogen-based economy may be 30 or more years away – but it may be significantly earlier. A failure to consider, participate and actively develop potential directions by the Queensland Government runs the risk of stranded infrastructure. Hydrogen technologies are unlikely to emerge in time to counter a potential oil crisis – but sustaining the petrol engine in its current form seems increasingly unlikely also. Hence developing potential technology pathways now may be necessary to manage vehicle transition, particularly if brought on by an oil crisis. Nuclear There are two principal nuclear reactions – fission and fusion. Both can (and have) been used in nuclear weapons, and theoretically both can be used in power generation. However, only fission nuclear power plants have successfully commercialised to date (although the sun is a massive fusion nuclear reactor). Fission reactions are based on unstable chemical isotopes progressively changing their mass until their nuclear arrangement is as close to nickel (62) as possible. Each time the molecule fissures, heat is released. However, each time the molecule does fissure it also sets off a chemical chain reaction – with an exponential release of heat. This heat is subsequently used to heat up steam and drive a turbine – in much the same way as a coal fired power station. Hence one of the critical limitations of any heat engine, is a significant problem for nuclear reactors – cooling, or more specifically, water cooling. There must be a significant temperature drop in the heat leaving the system for any heat engine to be efficient. In a warm climate, this means a large supply of water in which to dump the waste heat. Spraying water onto a nuclear plant’s heat exchangers (evaporative cooling) is an expensive use of water, and not considered an option in any water restrained environment. Locating a nuclear plant beside a river, and running river water through the plant is also not considered an option – as heated river water will evaporate to cool the river back to its original temperature, resulting in water loss directly comparable to evaporative cooling. Cooling with seawater may be an option (assuming there were no environmental issues). Fission nuclear reactors are in use around the world, with France generating 77% of its electricity with nuclear fission power. Nuclear fission power is most frequently adopted where endogenous energy resources are limited, or insufficient to meet the electricity demand of the country. Fission reactors use uranium, and depending on the design, sometimes plutonium (breeder reactors) as the fuel source. The half life of reacted plutonium is 24,100 years. The half life of reacted uranium varies between 4.5 and 750 billion years depending on the isotope of metal. A real concern with nuclear reactors is the potential for recovery of decay products for nuclear weaponry. For this reason, very few nuclear power plants currently recycle spent waste, as it involves transporting the material over long distances, with significant potential for hijacking by terrorists (see Japan recycling example). There are indications that India will consider using thorium fuelled reactors instead of uranium. Although some uranium or plutonium will be needed to seed the reactor, the recovered amounts are insufficient for nuclear weaponry, and thorium is not a nuclear weapon fuel.
Page 151 of 158
In view of climate change concerns, nuclear power has recently resurged as a potential form of low emissions electricity generation in Australia , particularly given the natural abundance of minable uranium. However, there are three principal problems: •
Australians have a historical reluctance to the concept of nuclear energy;
•
Australia’s abundant coal supply ensure that coal fired generation outcompetes nuclear generation on any price comparison to date, with the possible exception of introducing a carbon tax; and
•
nuclear waste cannot be permanently disposed off.
This third point is the most difficult to resolve, and the greatest cause for concern. The half lives of plutonium and uranium indicate any waste from nuclear reactors needs to be carefully disposed off, and monitored into perpetuity - at least 24,100 years. Historical management of nuclear waste throughout the world to date indicates this is something that we, mankind, do not do well. There is a tendency to store nuclear waste at the lowest possible cost at the time of disposal – implicitly ignoring the crippling rehabilitation costs. Although a range of technologies for nuclear storage continues to be developed, their effectiveness can only be proven over time. Notably fusion nuclear energy does not have the radioactive waste issues associated with decay products. Note that the Commonwealth’s report into nuclear power viability, finalised in early 2007, through some creative accounting, suggested that nuclear power could potentially compete “clean coal technologies” under a carbon tax. However, subsequent Queensland Government investigations into the economics behind the Commonwealth proposed model indicate this proposal is seriously flawed. Key message Nuclear power is unlikely to be considered by Queensland as part of managing future oil crisis, at this time. What are the options? There are no direct substitutes for oil, and indirect substitution has significant resource and infrastructure implications for the State. These implications are likely to be further complicated by an increasingly apparent need to manage climate change expectations through emissions mitigation. For this reason, the concept of gas to liquids (GTL) and coal to liquids (CTL) seems unlikely to be a real consideration for long term transportation in Queensland. However, indirect substitution isn’t a simple exercise. As a major electricity generator, and exporter into the National Electricity Market, Queensland energy reserves estimates are predicated on projected electricity consumption growth patterns (i.e. stationary energy). Hence sudden and significant diversion of a resource for transportation requirements has profound implications on Queensland’s stationary energy sector. There are three potential pathways currently emerging for passenger/freight transport. include: •
These
diesel hybrid, moving into electric vehicles;
Page 152 of 158
•
hydrogen fuel cells, either with internal fuel reformation on board (including gas, ethanol), or hydrogen supply networks; and
•
CNG/LPG gas, moving into gas-electric hybrids.
Infrastructure to transition into these pathways exists at varying levels in the earliest stages, however, without formal policy direction to further develop, and develop linkages within the stationary energy sector, transitioning into a new transportation energy framework will be problematic, and marginalise groups of the community who can least afford to be so marginalised.
Page 153 of 158
CONCLUSION AND RECOMMENDATIONS While Queensland has abundant supplies of some fuel stocks, such as coal and solar energy, it is highly vulnerable in other key areas - such as liquid fuels from petroleum. The economic and human carrying capacity of the State will be determined by continued access to convenient and affordable energy, including liquid fuels. The effects of higher oil prices in the future and of oil supply disruptions are key considerations in the well-being of the Queensland economy and community and are set out in the sectoral papers that are a part of this report. A number of significant risks and vulnerabilities to any future high oil price conditions are identified. In the near future it is increasingly likely that world production of oil will go beyond peak oil and will slip into decline, at a time when world demand for oil and its substitutes is growing strongly. Nations are already locking in supplies, via long term contracting and nationalisation of assets, meaning that fewer supplies will be traded in international markets. Prices will be higher and more variable, than previously experienced. With the peaking of world oil production likely in the next 10 years, and with increasing risks of world oil supply disruption due to political instability in the Middle East and other supplying nations, Queensland must adopt an Oil Vulnerability Mitigation Strategy and Action Plan as a matter of priority in order to minimise the foreseeable consequences of substantial liquid fuel price rises and supply disruptions. The three cornerstones of this proposed Queensland Oil Vulnerability Mitigation Strategy and Action Plan are to: • • •
Reduce consumption of liquid fossil fuels; Encourage development and use of alternative fuels, technologies and strategies; and Prepare for demographic and regional changes.
Government policy must embrace a new paradigm where all activity is scaled by the three cornerstones suggested above - if the social and economic disruptions that will attend the looming liquid fuel supply decline are to be minimised. The order in which these cornerstones are adopted is not prescribed. However the sooner action is initiated, the greater will be the chances for smoother transition, post the world peak of oil production. There is also the possibility that should Queensland exercise timely leadership, comparative advantage can be gained for the State. The three cornerstones recommended by the Taskforce are not intended to be the optimal economic use of resources in today’s market – but rather the optimal use over a longer timeframe.
Page 154 of 158
1.
Reduce consumption of liquid fossil fuels
Queensland has a significant oil dependency, most prevalent in the transport sector. While improved fuel quality and vehicle efficiency has decreased overall liquid fuel consumption per vehicle, Queensland’s total liquid fuel consumption has continued to increase. Hence addressing this dependency will involve reducing oil consumption by substituting into alternative fuels and vehicle technologies, and increased use of public transport. It should be noted that in February 2005 the International Energy Agency recommended in its report “Saving Oil in a Hurry” that member nations, of which Australia is one, commence public awareness campaigns to promote dramatic reductions in petroleum usage immediately. A public awareness program along the lines of Water Wise, Clean Up Australia, or anti-smoking or drink driving campaigns, may be necessary to both explain rising energy costs and to garner support for the action necessary to address the problem. Further strategies to reduce energy consumption can be based on pricing incentives, regulation, taxation, education and behaviour change programs, and increased investment in public transport. 2.
Encourage development and use of alternative fuels, technologies and strategies
Oil is an energy resource. Substituting away from oil dependency requires alternative energy supplies to fill the void left by oil. However, there is no one resource available in Queensland that can readily replace oil and its myriad of uses in our transport sector and broader economy. Hence reducing oil consumption needs to be combined with increased diversification of the energy sector, to ensure sufficient energy resources are available to meet Queensland’s energy needs. In a carbon constrained world responding to climate change, this includes a range of transitional fuels and technologies (eg gas, clean coal, hydrogen systems and improved electricity storage battery capacity) and renewable energy solutions (eg solar, geothermal, biofuels and wind). Government must take responsibility for promoting and supporting both domestic and commercial development and applications of renewable energy sources, including solar, geothermal, biofuels, and hydrogen systems. 3.
Prepare For Demographic and Regional Changes
There is likely to be a major change in demographics, compounded by the ageing population. Under high oil prices in future, it is likely that the outer suburbs of our major cities will become fragmented, with potential decline driven by transport cost concerns. Conversely, government should anticipate more people moving to some rural, regional and coastal areas with work, schools and shops available within smaller, largely self-contained geographic areas. Town planning (involving the explicit adoption of the principles of new urbanism, walkability, connectivity, in-fill, and higher density residential living) and the abandonment of support for urban sprawl will be a key policy tool. The protection of not just green space, but agricultural land in and around our major population centres will be a key determinant of food costs and liveability.
Page 155 of 158
Energy efficiency and sustainability need not lead to lower standards of living than we now currently enjoy. However, failure to anticipate the inevitable change in the energy framework on which our society and economy now rests, will certainly impact negatively on all of us, and particularly on those who can least afford it. Emerging liquid fuel constraints brought on by peak oil means that we must now consider encouraging change in the layout and design of our cities and in the behaviour patterns of society. From now and over the coming decades, government will need to take a much more proactive role in managing the decline of oil, energy management focussing on the major challenges of rising user demands and energy security, and addressing the related issue of climate change. This process needs to begin immediately, if large scale social dislocation is to be avoided or at least minimised. The costs of preparing too soon will be infinitesimal compared to the costs of reacting too late. In preparing this report, the Taskforce notes that there is no area of government that currently develops comprehensive policy for long term liquid fuel security. Responsibility falls between the legislative role of the Department of Mines and Energy in an emergency, pursuant to the Liquid Fuel Supply Act 1984 (Qld) and the regulatory and policy roles of various government departments including Premier and Cabinet, Treasury, State Development and Infrastructure, Transport, Mines and Energy, Primary Industries and Fisheries, Local Government and Planning, and Natural Resources and Water. Recommendations The Taskforce recommends the following to assist in the preparation of a detailed peak oil risk management strategy: (i)
The Government agree to the establishment of a high level interdepartmental committee to develop a Queensland Oil Vulnerability Mitigation Strategy and Action Plan, recognising a broad range of sectors are directly and indirectly affected;
(ii)
Conduct a modelling exercise to quantify oil dependency of Queensland industry, how oil is currently used in various industry sectors and potential substitution options;
(iii)
Undertake an analysis of industry development opportunities to inform decision making;
(iv)
Model interstate and international dependencies on Queensland energy resources and potential substitution effects;
(v)
Conduct demographic and regional modelling to inform of potential impacts; and
(vi)
Consider a whole of government strategy for managing communication and implementation of a Queensland Oil Vulnerability Mitigation Strategy and Action Plan.
__________________________ Andrew McNamara MP Member for Hervey Bay Chair Oil Vulnerability Taskforce
Page 156 of 158
ATTACHMENT 1 TERMS OF REFERENCE Queensland Oil Vulnerability Taskforce Role The role of the Oil Vulnerability Taskforce is to develop an information report for cabinet consideration, identifying Queensland’s potential vulnerabilities to world oil depletion, and what can be done to manage associated tasks. Responsibilities The responsibilities of the Taskforce are to endure that: •
A balanced report is prepared, recognising Peak oil, and particularly reserves data against which predictions are based, is a contentious issue involving long term debate
•
A whole of government view is considered, including coordination of input from agencies not represented on the Taskforce, as appropriate (ie during review).
•
The taskforce is accountable to the Minister for Natural Resources and Mines
•
Interaction occurs with non-participating agencies, and where necessary external stakeholders as defined by the Minister for Natural Resources and Mines.
•
Confidentiality of all materials prepared, discussed or commissioned by the Taskforce, including material prepared by individual members.
•
The Member for Hervey Bay is the Chair of the Taskforce.
Functions of the Taskforce To comprehensively inform the Queensland Government Cabinet on Queensland’s oil vulnerability to oil prices and world resource depletion and related risks by: •
Developing a current overview of the peak oil debate
•
Identifying potential vulnerabilities, flow on impacts, and potential opportunities for Queensland as a result of world oil depletion
•
Providing high level analysis and strategic advice on a range of potential options to minimise impact on Queensland
•
Preparation of material by the Taskforce to include two Cabinet submissions: - Phase 1; An information paper detailing the peak oil debate, and Queensland’s key vulnerabilities - Phase 2; Potential options to minimise the impact on Queensland (date to be determined).
Taskforce operational timeframe The Taskforce, as defined by the terms of reference, will cease on production of its report.
Page 157 of 158
ATTACHMENT 1 Contingency Arrangements The taskforce has been formed in response to the growing concerns surrounding international oil vulnerability, and the consequent potential flow on effects for Queensland. In particular, it has developed through he Premier’s support. In the event that any members of the taskforce are required to withdraw their service, it is the responsibility of their department to ensure that agency representation and participation on the taskforce continues. This includes potential changes in Ministerial portfolios, and subsequent movement of ministers and ministerial advisers. Membership Parliamentary Members Andrew McNamara MP, Member for Hervey Bay (Chair) Rachel Nolan MP Member for Ipswich Technical Advice Officers from: Department of Natural Resources and Water; Department of Primary Industries and Fisheries; Department of Mines and Energy; and Department of Transport.
Page 158 of 158