Beyond Prediction: First Steps Toward Automatic Intervention in MOOC Student Stopout Jacob Whitehill
Joseph Williams
Glenn Lopez
Harvard University
Harvard University
Harvard University
[email protected]
[email protected]
[email protected]
Cody Coleman
Justin Reich
MIT
Harvard University
[email protected]
[email protected]
ABSTRACT High attrition rates in massive open online courses (MOOCs) have motivated growing interest in the automatic detection of student “stopout”. Stopout classifiers can be used to orchestrate an intervention before students quit, and to survey students dynamically about why they ceased participation. In this paper we expand on existing stop-out detection research by (1) exploring important elements of classifier design such as generalizability to new courses; (2) developing a novel framework inspired by control theory for how to use a classifier’s outputs to make intelligent decisions; and (3) presenting results from a “dynamic survey intervention” conducted on 2 HarvardX MOOCs, containing over 40000 students, in early 2015. Our results suggest that surveying students based on an automatic stopout classifier achieves higher response rates compared to traditional post-course surveys, and may boost students’ propensity to “come back” into the course.
1.
INTRODUCTION
Massive open online courses (MOOCs) enable students around the world to learn from high-quality educational content at low cost. One of the most prominent characteristics of MOOCs is that, partly due to the low cost of enrollment, many students may casually enroll in a course, browse a few videos or discussion forums, and then cease participation [12, 6, 10]. Some MOOCs offer the ability to receive a “certificate” by completing a minimum number of assignments or earning enough points, and for the most part the number of students who certify in MOOCs is far lower than the number of students who register. This is not necessarily a problem – students may enroll for different reasons, not everyone cares about formal certification, and if students learn anything from a MOOC, that is arguably an important gain. On the other hand, the fact that most students who enroll in a MOOC do not complete the course still warrants further
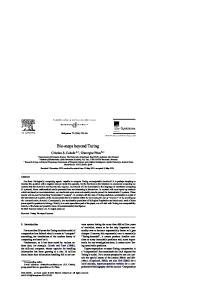
investigation. For example, there may be some students who genuinely intended to complete a course when they enrolled but, upon encountering the lecture materials, quiz problems, or even other students, felt discouraged, frustrated, or bored, and then stopped participating in the course. Indeed, Reich [11] found that, of students who completed HarvardX pre-course surveys and expressed the intent to complete the course, only 22% of such students actually did so. A deeper understanding of the reasons why students stop out of a course could help course developers improve course content. HarvardX, Harvard’s strategic initiative for online education, is interested in understanding students’ learning experiences in order to improve both online and residential education. Some of the questions we are currently tackling include who is enrolling in HarvardX courses, why are they enrolling, and how can we improve their educational experiences. In particular, we would like to know whether students stop out of HarvardX courses for reasons exogenous to their course experience – e.g., increased stress at work – or whether they quit because they disliked something about the course, especially things that course developers might be able to improve. One step towards answering this question, which we instituted starting in 2014, was to request of every student who enrolled in a HarvardX course to answer a post-course survey, which asks whether they liked the course and how it could be improved. Unfortunately, this effort was largely unsuccessful: response rates to these surveys were very low (around 2% of all course registrants, and less than 1% of students who had stopped out) and heavily biased toward students who had already persisted through weeks of voluntary challenges and were likely very satisfied with the course. It seems that the traditional approach to course evaluation – asking all students to evaluate a course at its end – is unlikely to work in a MOOC context. One possible reason for the low response rate from students who stopped out is that such students quickly disengage after leaving the course, so that the likelihood of responding to a survey weeks or even months after they quit is small. Indeed, we found (see Fig. 1) that the probability of responding to (i.e., starting, but not necessarily completing) the post-course surveys decays rapidly as the time since stopout increases. It is possible that higher response rates could be achieved if students could be contacted, through some automatic mechanism, in a more timely fashion. This could potentially increase the amount of information that
0.07
almost no prior research has explored how to use a stopout detector to survey students or conduct an intervention. We present a principled method, based on optimization via simulation, to choose a threshold on the classifier’s output so as to maximize a performance criterion. Finally, (3) we conduct one of the first MOOC “survey interventions” using an automatic stopout classifier (to our knowledge, the only other work is [7]) and report initial findings.
End-of-course survey response for stopped-out students
Probability of survey response
0.06 0.05 0.04 0.03 0.02
2.
0.01
Most HarvardX MOOCs (all those which are analyzed in this paper) are hosted on servers owned and managed by edX, which is a non-profit multi-university consortium located in Cambridge, Massachusetts. Student enrollment and event data are stored at edX and then transferred periodically (daily and weekly depending on the dataset) from edX to HarvardX. Hence, there is a “time gap” between when students generate events and when these event data are available at HarvardX.
0.00 0
1
2 3 # weeks since stop-out
4
5
Figure 1: Mean probability (± std.err.) of responding to the post-course survey versus time-sincestopout, over 6 HarvardX MOOCs.
HarvardX, and other MOOC providers, can glean from students who choose not to complete their courses. In January-April 2015, we pursued this idea of a dynamic survey mechanism designed specifically to target students who recently “stopped out”. In particular, we developed an automatic classifier of whether a student s has “stopped out” of a course by time t. Our definition of stopout derives from the kinds of students we wish to survey: we say a student s has stopped out by time t if and only if: s does not subsequently earn a certificate and s takes no further action between time t and the course-end date when certificates are issued. The rationale is that students who either certify in a course or continue to participate in course activities (watch videos, post to discussion forums, etc.) can reasonably be assumed to be satisfied with the course; it is the rest of the students whom we would like to query. In addition to developing a stopout classifier, we developed a survey controller that decides, based on the classifier’s output, whether or not to query student s at time t; the goal here is to maximize the rate of survey response while maintaining a low spam rate, i.e., the fraction of students who had not stopped out but were incorrectly classified as having done so (false alarms). In our paper we describe our approaches to developing the classifier and controller, as well as our first experiences in querying students and analyzing their feedback. To a modest extent, even just emailing students with “Returning to course?” in the subject line (see Sec. 6) constitutes a small “intervention”; the architecture we develop for deciding which students to contact may be useful for researchers developing automatic mechanisms for preventing student stopout. Contributions: (1) Most prior work on stopout detection focuses on training detectors for a single MOOC, without examining generalization to new courses. For our purpose of conducting dynamic surveys and interventions, generalization to new MOOCs is critical. We thus focus our machine learning efforts on developing features that predict stopout over a wide variety of MOOCs and conduct analyses to measure cross-MOOC generalization accuracy. (2) While a variety of methods have been investigated for detecting stopout,
STRUCTURE OF HARVARDX MOOCS
Every HarvardX MOOC has a start date, i.e., the first day when participation in the MOOC (e.g., viewing a lecture, posting to the discussion forum) is possible. HarvardX MOOCs also have an end date when certificates are issued. At the end date, all students whose grade exceeds a minimum certification threshold G (which may differ for each course) receive a certificate. HarvardX courses allow students to register even after the course-end date, and they may view lectures and read the discussion forums; in most MOOCs these students cannot, however, earn a certificate. For the analyses in this paper we normalize the start date for each course to be 0 and denote the end date as Te .
3.
RELATED WORK
Over the past 3 years, since MOOCs have proliferated and the low proportion of students who complete them has become apparent, researchers from a variety of fields, including computer science, education, and economics, have begun developing quantitative models of when and why student stop out from MOOCs. The motivation for such work varies – some researchers are more interested in estimating the relative weight of different causes of stopout, whereas others (including ourselves) are primarily interested in developing automatic classifiers that could be used for real-time interventions. Work on stopout/dropout detection in MOOCs varies along several dimensions, described below: Definition of stopout/dropout: Some researchers treat a student’s last “event” within a MOOC as the stopout/dropout date, where “event” could be submitting an assignment or quiz solution [14, 13], watching a video [13], posting to a discussion forum [17], or any event whatsoever [8, 1]. Others define stopout as not earning a certificate within a course [5, 2, 4]. Hybrid definitions, such as having watched fewer than 50% of the course’s videos and having executed no action during the last month [3], are also possible. Our own “stopout” definition (see Introduction) is a hybrid of lack of certification and last event. Features used for prediction: The most commonly used features are derived from clickstream data [4, 1, 8, 2, 3, 14, 7] (e.g., when students play videos, post to discussion forums, submit answers to quiz problems), grades [4, 5, 3, 14, 7]
(e.g., average grade on quizzes), and social network analysis [17, 5] (e.g., eigenvector centrality of a node in a discussion forum graph). Biographical information (e.g., job, age) has also been used [5, 13, 17]. Classification method: Most existing work uses standard supervised learning methods such as support vector machines [8] and logistic regression [4, 5, 14, 7]; the latter has the advantage of probabilistic semantics and readily interpretable feature coefficients. Another approach is to use a generative model such as a Hidden Markov Model [1]; this could be useful for control-theoretic approaches to preventing stopout. Survival analysis techniques such as the Cox proportional hazards model have also been used [17, 13]. Classification setting: A critical issue is whether a stopout detector is highly tuned to an existing course that will never be offered again; whether it could generalize to a future offering of the same course; or whether it could generalize to other courses. Detectors that are tuned to perform optimally for only a single course are useful for exploring different classification architectures and features, but their utility for predicting stopout in new students is limited (since typically the entire course has ended before training even begins). Most existing work focuses on a single MOOC (which may or may not be offered again); to our knowledge, only [7, 3] explore stopout detection across multiple courses. To our knowledge, the only prior work that explores how to use a stopout detector to conduct dynamic surveys is [7]. In contrast to their work, we take a more formal optimization approach to deciding how to use the classifier’s output to make intelligent survey decisions (see Sec. 5).
4.
STOPOUT DETECTOR
The first step toward developing our dynamic survey system is to train a classifier of student stopout. In particular, we wish to estimate the probability that a student s has stopped out by time t, given the event history up to time t. We focus on time invariant classifiers, i.e., classifiers whose input/output relationship is the same for all t. (An alternative approach, which we discuss in Sec. 4.3, is to train a separate classifier for each week, as was done in [14].) In correspondance with the interventions that we conduct (see Sec. 6), we vary t over T = {10, 17, 24, . . . , Te } days; these days correspond to the timing of the survey interventions that we conduct. In our classification paradigm, if a student s stops out at time t = 16, then the label for s at t = 10 would be negative (since he/she had not yet stopped out), and the labels for times 17, 24, . . . , Te would all be positive. Note that, since students may enroll at different times during the course (between 0 and Te ), not all values of t are represented for all students. For classification we use multinomial logistic regression (MLR) with an L2 ridge term (10−4 ) on every feature except the “bias” term (which has no regularization). Prior to classifier training, features are normalized to have mean 0 and variance 1; the same normalization parameters (mean, standard deviation) are also applied to the testing set. For each course, we assign each student to either the training (50%) or testing (50%) group based on a hash of his/her username; hence, students who belong to the testing set for one course
will belong to the testing set for all courses. For all experiments, we include all students who enrolled in the MOOC prior to the course-end date when certificates are issued. As accuracy metric we use Area Under the Receiver Operating Characteristics Curve (AUC) statistic, which measures the probability that a classifier can discriminate correctly between two data points – one positive, and one negative – in a two-alternative forced-choice task [15]. An AUC of 1 indicates perfect discrimination whereas 0.5 corresponds to a classifier that guesses randomly. The AUC is threshold independent because it averages over all possible thresholds of the classifier’s output. For a control task in which we use the classifier to make decisions, we face an additional hurdle of how to select the threshold (see Sec. 5).
4.1
Features
Our focus is on finding features that are predictive of stopout for a wide variety of MOOCs, rather than creating specialized features (via intensive feature engineering [14]) that are tailored to a particular course. We extract these features from two tables generated by edX: the “tracking log” table (containing event data), and the “courseware student module” table (containing grades). The features we extract and the motivation for them are listed below: 1. The absolute time (in days, since course start) t, as well as the relative time through the course (t/Te ) – it is possible that students who persist through most of the course are unlikely to stop out. 2. The elapsed time between the last recorded event and time t – recent activity is likely negatively correlated with stopping out. 3. The total number of events of different types that were triggered by the student up to time t, where event types includes forum posts, video plays, etc. 4. 1-D temporally-local band-pass (Gabor [9]) filters (6 frequencies, 3 bandwidths) of all event times before t. Temporal Gabor filters capture sinusoidal patterns (with frequency F = 2f , f ∈ {−10, −9, . . . , −5} days) in the recent history of events by attenuating with a Gaussian envelope (with bandwidth σ ∈ {14, 28, 56} days); see Fig. 5 for examples. Gabor filters have been used previously for automatic event detection (e.g., [16]), and it is possible that “regularity” in event logs is predictive of whether a student stops out. 5. The student’s grade at time t relative to the certification threshold (gt /G), as well as a binary feature encoding whether the student already has enough points to certify (I[gt ≥ G]). If the latter feature equals 1, then by definition the student has not stopped out. See Appendix for more details. Including a “bias” feature (constant 1), this amounts to 37 features.
4.2
Experiments
We investigated the following questions:
Course ID AT1x CB22x CB22.1x ER22x GSE2x HDS1544.1x PH525x SW12x SW12.2x USW30x
Year 2014 2013 2013 2013 2014 2013 2014 2013 2014 2014
Subject Anatomy Greek Heroes Greek Heroes Justice Education Religion Public Health Chinese History Chinese History History
# students 971 34615 17465 71513 37382 22638 18812 18016 9265 14357
# certifiers 60 1407 731 5430 3936 1546 652 3068 2137 1089
# events 384747 11017890 5195716 16256478 13474171 6837110 5567125 7638660 3544666 2171359
# data 7588 671894 250205 1209515 209097 144233 124592 78821 25885 107789
# + data 5895 555581 201836 926067 159639 108848 96836 50431 15741 86043
Table 1: MOOCs for which we trained stopout classifiers, along with # students who enrolled up till the course-end date, # students who earned a certificate, # events generated by students up till the course-end date, # data points (summed over all students and all times t when classification was performed) for training and testing, and # positively labeled data points (time-points after the student had stopped out). 1. Accuracy within-course: How much variation in accuracy is there from course to course? How does this accuracy vary over t ∈ [0, Te ] within each course? 2. Accuracy between-courses: How well does a classifier trained on the largest course in Table 1 (ER22x) perform on the other courses? 3. Training set size & over/under-fitting: Does accuracy improve if more data are collected? Is there evidence of over/under-fitting? 4. Feature selection: Which features are most predictive of stopout? How much accuracy is gained by adding more features? 5. Confidence: Does the classifier become more confident as the time-since-stopout increases?
4.3
Accuracy within-course
For this experiment we trained a separate classifier for each of 10 HarvardX MOOCs (see Table 1) using only training data and then evaluated on testing data. Accuracy for each course as a function of time-to-course-end (Te −t) is shown in Fig. 2. In this graph we observe substantially lower accuracy during the beginning of each course (left side of the graph) than at the end, suggesting that longer event histories (larger t) yield more accurate classifications. In addition, accuracy varies considerably from course to course, especially at the beginning of each course. Table 2 (middle column) shows accuracy for each course aggregated over all t ∈ T . Comparing classification architectures across different courses is approximate at best; however, we do observe a large performance gap between our numbers and the accuracy reported in [1] (AUC=0.71), who also use “last event” as their definition of stopout. One possible explanation is the lack of a “time since last event” feature (see Sec. 4.6) in their feature set. [8] use a similar definition of stopout but only report percent-correct, not AUC. Based on Fig. 2, it is conceivable that students’ behavior (or the set of students) is qualitatively different during the first week of a course compared to later weeks, and that training a specialized classifier to predict stopout only during the first week might perform better than a classifier trained on
Figure 2: Accuracy (area under the receiver operating characteristics curve (AUC)) of the various stopout classifiers as a function of time, expressed as number of days until the course-end date. all weeks’ data. We explored this hypothesis in a follow-up study (ER22x only) and found minor evidence to support it: train on week 1, test on week 1 gives an AUC of 0.69; train on all weeks, test on week 1 gives an AUC of 0.66.
4.4
Accuracy between-courses
Here, we consider only the classifier for course ER22x, containing the largest number of students and the most training data. We assessed how well the ER22x stopout classifier generalized to other courses compared to training a custom classifier for each course. We assess accuracy over all students and all t ∈ T to obtain an overall AUC score for each course. Results are shown in Table 2. The middle column shows testing accuracy when training on each course, whereas the right column shows testing accuracy when trained on ER22x. Interestingly, though a small consistent performance gain can be eked by training a classifier for each MOOC, the gap is quite small, typically < 0.02. This suggests that the features described in Sec. 4.1 are quite
Course AT1x CB22x CB22.1x ER22x GSE2x HDS1544.1x PH525x SW12x SW12.2x USW30x
Within-course 0.850 0.879 0.868 0.895 0.892 0.897 0.860 0.890 0.907 0.884
Cross-train (ER22x) 0.832 0.876 0.866 0.895 0.881 0.887 0.847 0.880 0.896 0.875
Table 2: Accuracy (AUC, measured over all students in the test set and all times t) of stopout classification for each course, along with accuracy when cross-training from course ER22x.
# 1 2 3 4 5
Top 5 Most Predictive Features Cumulative Feature AUC (training) Time since last event 0.867 Normalized grade (gt /G) 0.880 Time into course (t) 0.886 Gabor (σ = 56, F = 2−10 days) 0.889 Total # events 0.890
Table 3: The top 5 most predictive features and associated cumulative AUC on training data, for ER22x. Feature i is chosen so as to maximize the training AUC given the previously selected features 1, . . . , i − 1.
general; on the other hand, it also points to the possibility of underfitting (see Sec. 4.5).
4.5
Training set size & over/under-fitting
We examined how testing accuracy (AUC) increases as the number of training data increases. For ER22x, we found that, even if the number of training students is drastically reduced to 1000 (down from around 36000), the testing accuracy is virtually identical at 0.894. Moreover, the training accuracy for a training set of 1000 students is only 0.91 (and slightly lower when using the full training set) and does not improve by reducing the ridge term. These numbers suggest that (a) the feature space may be too impoverished (underfitted) to classify all data correctly; and/or (b) there is a large amount of inherent uncertainty in a student’s future action given only his/her event logs and grades.
4.6
Feature selection
While some insight into feature salience can be gleaned by examining the regression coefficients, in practice it is difficult to interpret these coefficients because the L2 regularizer distributes weight across multiple correlated features. We thus used the following greedy feature selection procedure: Initialize a feature set F to contain only the “bias” feature; find the feature (not already in F) that maximally increases the AUC on training data (for ER22x); add this feature to F and record the associated AUC score; repeat N − 1 times. We executed this procedure for N = 5 rounds and obtained the results in Table 3. The most predictive feature was timesince-last-action (which corroborates a similar result in [7]); using this feature alone (along with the “bias” feature), the AUC was already 0.867. The student’s normalized grade (gt /G) was the second most predictive feature; this is intuitive since our definition of stopout includes certification as one of the criteria. Next, time into the course (t) was selected, suggesting there are certain times in the course when students are more likely to stop out. The fourth feature selected was a Gabor feature; rather than capturing periodicity in a student’s events, the high bandwidth (σ = 56 days) and low frequency (F = 2−10 days) of the feature can more aptly be described as a weighted sum of event counts favoring the recent past more than the distant past (see Fig. 5).
Figure 3: The average output of the ER22x stopout classifier, as a function of time-since-stopout, on students who had stopped out of the course.
In retrospect, it is clear that “time since last event” would be salient – the longer it has been since a student has done anything, the less likely he/she is to do anything in the future. It may be useful, in future stopout detection research, to compare with this single feature as a baseline.
4.7
Confidence
When building a real-time system that uses the probability estimates given by a classifier to make decisions, it can be useful to “wait” before acting until the classifier becomes more confident (so as to avoid false alarms). For course ER22x, we found that the expected classifier output at time t, averaged over every student who stopped out at time t0 < t, increases with time-since-stopout (t − t0 ). The Pearson correlation of the classifier output y with t − t0 was 0.73, and the Spearman rank correlation was even higher (0.93). A graph displaying the expected classifier output versus timesince-stopout is shown in Fig. 3.
5.
CONTROLLER
Given a trained classifier of student stopout, how can we use it to decide which students to contact and when to contact them? At each week t, the classifier estimates for each student s the probability yst that the student has stopped out. How high must yst be in order to justify querying that student at that time? In this decision problem, we are faced with the following trade-off:
Factor 1: The sooner we contact a student after he/she has stopped out, the higher the probability that he/she will respond (see Fig. 1); this suggests using a lower threshold. Factor 2: On the other hand, the longer we wait after he/she has stopped out, the more accurate our classifier becomes (see Fig. 3); this suggests using a higher threshold.
vardX courses: HLS2x (“ContractsX”) and PH525x (“Statistics and R for the Life Sciences”), which started on Jan. 8 and Jan. 19, 2015, respectively. The goals were to (1) collect feedback about why stopped-out students left the course and (2) explore how sending a simple survey solicitation email affects students’ behavior.
Depending on how the “response fall-off curve” (factor 1) and the “confidence increase” curve (factor 2) are shaped, it is possible that a more efficient (higher response rate, lower spam rate) system can be constructed if the threshold θ on the classifier’s output is chosen carefully. Factor 2 was estimated in Sec. 4.7. Factor 1 can be roughly estimated using response rate data collected from the post-course surveys (see Introduction) and back-dating when students who responded to the survey had stopped out.
We trained separate stopout classifiers, using previous HarvardX courses for which stopout data were already available, for HLS2x and PH525x. For PH525x, there was a 2014 version of the course on which we could train. For HLS2x, we trained on a 2014 course (“AT1x”) whose lecture structure (e.g., the frequency with which lecture videos were posted) was similar. Then, using each trained classifier and the response fall-off curve estimated from post-course survey data (see Sec. 5), we optimized the classifier threshold θ for each MOOC (θ = 0.79 for HLS2x, θ = 0.75 for PH525x).
In collaboration with the HarvardX course creation teams, we also decided on additional constraints: (1) each student can be contacted during the course at most once (so as to avoid irking students with multiple email messages), and (2) the fraction of students whom we query but who had not actually stopped out (false alarms) should not exceed α = 20%. Note that this false alarm rate, which is computed over students’ entire trajectories through the MOOC, is different from the false alarm rate of classification described in Sec. 4, which is computed at multiple timepoints within each trajectory. Subject to these constraints, we wish to choose a threshold θ (a scalar) on the classifier’s output yst so as to maximize the rate of survey response from students who had stopped out. Our approach to tackling this problem is based on optimization via simulation. Optimization via simulation: We built a simulator of how students generate events, what grades they earn, and when they stop out, based on historical data from prior HarvardX MOOCs. We can also simulate whether a student who stopped out at time t0 responds to a survey given at time t using the “response fall-off curve” described above. Then, for any given value of θ, we can estimate how many query responses and how many false alarms it generates by averaging over many runs (we chose N = 50000) of the simulator: for each run, we randomly choose a student s from our training set, and at each time point t (every 7 days until Te ), we extract a feature vector xt based on s’s event log and grade up to time t. We then classify xt using a trained classifier (from Sec. 4) and threshold the result yst using θ. If yst > θ and if we had not previously queried s during the current simulation run, then we query the student. If the student had indeed stopped out before t, then we sample the student’s response (reply, not reply) from the response fall-off curve. During all simulation runs we maintain counts of both false alarms and hits (stopped-out student replies to query). Since θ is a scalar, we can use simple grid-search to find θ∗ that maximizes the hit rate subject to a false alarm rate below α. Note that more sophisticated controllers with multidimensional parameter vectors θ are also possible (e.g., a different threshold for every week of the MOOC) using policy gradient optimization methods.
6.
SURVEY INTERVENTION
Using the classifier and controller described above, we conducted a “dynamic survey intervention” on two live Har-
We emailed students in batches once per week. Each week, we ran the stopout classifier on all students who had registered and were active in the course (i.e., had not de-registered). Each student was assigned a condition (50% experimental, 50% control) based on a hash of his/her username. To every student s in the experimental group whose yst at time t exceeded θ, we sent an email (see Fig. 4) asking whether he/she intended to complete the course and why/why not. After clicking on a link, the user is given the opportunity to enter free-response feedback in a textbox. We used Qualtrics to manage the surveys, send the emails, and track the results. Students in the control group were not emailed; instead, we used them to measure the accuracy of our stopout classifier and to compare the “comeback rates” across conditions. We delivered 3 batches (Jan. 21, Jan. 26, Feb. 2) of survey emails to 5073 students in HLS2x and 1 batch (Feb. 2) to 3764 students in PH525x. These dates were chosen to occur shortly after the data transfers from edX to HarvardX (see Sec. 2). Except in Sec. 6.2, we exclude students (138 (2.7%) from HLS2x, 201 (5.4%) from PH525x) from our analyses whom we would not have emailed if we had had real-time access to students’ event data. Hence, the results below estimate the response rates, accuracy, and comeback rates if we could run our intervention directly on edX’s servers (with 0 time-gap).
6.1
Response rate from stopped-out students
We investigated whether the dynamic survey intervention induced more stopped-out students to respond compared to the conventional post-course survey mechanism. Because the HarvardX post-course surveys are much longer than our stop-out survey, we compared the rates with which stoppedout students started the surveys (without necessarily completing them) to enable a fairer comparison. We analyzed response rates for HLS2x only (PH525x is still ongoing). To measure response rates, we computed the number of students D whom we emailed and who had actually stopped out (which we now know since the course has ended) before the email was sent. Then, of these D students, we compute the number N of students who responded to (started, but not necessarily completed) the survey, and then calculated the response rate N/D. Since the last intervention for HLS2x was on Feb. 2, which was 32 days before the course-end date
Dear Jake, We hope you have enjoyed the opportunity to explore ContractsX. It has been a while since you logged into the course, so we are eager to learn about your experience. Would you please take this short survey, so we can improve the course for future students? Each of the links below connects to a short survey. Please click on the link that best describes you. [ ] I plan on continuing with the course [ ] I am not continuing the course because it was not what I expected when I signed up. [ ] I am not continuing the course because the course takes too much time. [ ] I am not continuing the course because I am not happy with the quality of the course. [ ] I am not continuing the course because I have learned all that I wanted to learn. [ ] I am not continuing the course now, but I may at a future time. Your feedback is very important to us. Thank you for registering for ContractsX.
Figure 4: A sample email delivered as part of our dynamic survey intervention for HLS2x. (Mar. 6), we also calculated the corresponding fraction of students in previous HarvardX courses who responded to the post-course surveys who had stopped out at least 32 days before the course-end date (c.f. Fig. 1).
6.3
Result: The response rate from stopped-out students for the dynamic survey intervention was 3.7% compared to 1.0% for the post-course survey mechanism; the difference was statistically significant (χ2 (1) = 183, p < 10−15 , 2-tailed). In other words, the dynamic survey mechanism achieved over 3x higher response rate.
Results: The accuracy (AUC) for HLS2x was 0.74 for week 1, 0.78 for week 2, and 0.80 for week 3. These numbers are consistent with the results in Sec. 4.3.
6.2
Survey responses
For this analysis we included all students whom we emailed (even those whom we would not have emailed with realtime data; see above). From HLS2x, 336 students (6.6%) responded to (i.e., started but not necessarily finished) the survey. From PH525x, 353 students (9.4%) responded to the survey. Note that, in contrast to [7], who reported a 12.5% response rate for a computer science MOOC, we did not condition on students having watched at least one video. Of students who started the survey and answered whether or not they planned to continue (329 for HLS2x, 328 for PH525x), most replied that they planned to continue the course (242 for HLS2x, 203 for PH525x). Of those who replied they did not wish to continue (87 for HLS2x, 125 for PH525x), the reasons are broken down as follows: Reason “It was not what I expected when I signed up” “The course takes too much time” “I am not happy with the quality of the course” “I have learned all that I wanted to learn” “I may at a future time”
Freq. 8.4% 5.0% 0.5% 5.5% 80.7%
In other words, many respondents who confirmed they had stopped out indicated that they also might resume the course in the future. Notably, very few respondents reported that the courses were of poor quality. However, we emphasize that the full population of registrants who stop out could potentially be very different from the sample who responded to the survey; hence, the numbers above should be interpreted with caution. Our stopout detector may disproportionately identify students who stop out because they are too busy, or students who stop out because they are too busy may disproportionately respond to our survey and students unhappy with the course may choose not to respond.
Accuracy
As a further assessment of the stopout detector described in Sec. 4, we computed the accuracy of the classifier on students in the control group of our HLS2x intervention.
6.4
Effect on student “comeback”
One survey respondent wrote: “I was not allocating time for edX, but receiving your survey e-mail recaptured my attention.” This raises the question of whether the mere act of notifying students that we believed they had lost interest might cause them to “come back”. To test this hypothesis, we compared the fraction of students in the experimental group who “came back” – i.e., took at least one action (other than de-registering and/or responding to the survey) in the course after we sent the emails – to the corresponding fraction of students in the control group. We assessed comeback rates at two different timepoints – Feb. 12 (before we submitted the paper for review) and Apr. 20 (before we submitted the paper for final publication) – using all event data available by those dates. Results: For all 4 interventions (3 weeks of HLS2x, and 1 week of PH525x), the comeback rates were higher at both timepoints for the experimental group (who received an email) than for the control group (who did not receive an email). Aggregated over all weeks of both courses, the comeback rate by Feb. 12 was 12.4% for the experimental group versus 11.2% for the control group; the difference was statistically significant (χ2 (1) = 5.63, p = 0.018, 2-tailed). By Apr. 20, however, the difference was smaller – 22.1% for the experimental group versus 21.4% for the control group – and not statistically significant (χ2 (1) = 1.25, p = 0.26, 2-tailed). Together, these results suggest that the intervention induced students to come back sooner into the course, even if the overall comeback rates are similar. To confirm this hypothesis, we compared the mean “comeback time” (time between last action before intervention, and first action after intervention, among students who came back) between the two groups and across all 4 interventions. We found that students in the experimental group came back significantly sooner: 51.68 days for the experimental group versus 55.02 days for the control group (Mann-Whitney U = 1458393, n1 = 1725, n2 = 1831, p < 10−4 , 2-tailed). These
time t, we convolve this complex kernel with a t-dimensional “history vector” h whose τ th component contains the total number of events generated by that student on day t−τ . We then P compute the magnitude of the complex filter √ response, i.e., tτ =1 (Kr (τ )hτ + jKi (τ )hτ ) , where j = −1.
8.
Figure 5: Sample Gabor kernels. results provide evidence that an “intervention” consisting of an email indicating that a student has been flagged as having potentially stopped out, can affect students’ behavior.
7.
CONCLUSIONS
We developed an automatic classifier of MOOC student “stopout” and showed that it generalizes to new MOOCs with high accuracy. We also presented a novel end-to-end architecture for conducting a “dynamic survey intervention” on MOOC students who recently stopped out to ask them why they quit. Compared to post-course surveys, the dynamic survey mechanism attained a significantly higher response rate. Moreover, the mere act of asking students why they had left the course induced students to “come back” into the course more quickly. Preliminary analysis of the surveys suggest students quit due to exogenous factors (not enough time) rather than poor quality of the MOOCs. Limitations: The subset of stopped-out students who responded to the survey may not be a representative sample; thus, results in Sec. 6.2 should be interpreted with caution. Future work: In future work we will explore whether more sophisticated, time-variant classifiers such as recurrent neural networks can yield better performance. With more accurate classifiers we can conduct more efficient surveys and more effective interventions to reduce stopout.
APPENDIX Event count features: We counted events of the following types (using the “event type” field in the edX “tracking log” table): “showanswer”, “seek video”, “play video”, “pause video”, “stop video”, “show transcript”, “page close”, “problem save”, “problem check”, and “problem show”. We also measured activity in discussion forums by counting events whose “event type” field contained “threads” or “forum”. Gabor features: A Gabor filter kernel (see Fig. 5) is the product of a Gaussian envelope and a complex sinusoid. At time t−τ (i.e., τ days before t), the real and imaginary components are given by Kr (τ ) = exp(−πτ 2 /(2σ 2 )) cos(2πF τ ) and Ki (τ ) = exp(−πτ 2 /(2σ 2 )) sin(2πF τ ) (respectively), where σ is the bandwidth of the Gaussian envelope and F is the frequency of the sinusoid. When extracting Gabor features at
REFERENCES
[1] G. Balakrishnan and D. Coetzee. Predicting student retention in massive open online courses using hidden markov models. Technical report, UC Berkeley, 2013. [2] C. Coleman, D. Seaton, and I. Chuang. Probabilistic use cases: Discovering behavioral patterns for predicting certification. In Learning at Scale, 2015. [3] S. Halawa, D. Greene, and J. Mitchell. Dropout prediction in MOOCs using learner activity features. In European MOOC Summit, 2014. [4] J. He, J. Bailey, Benjamin, I. Rubinstein, and R. Zhang. Identifying at-risk students in massive open online courses. In AAAI, 2015. [5] S. Jiang, A. Williams, K. Schenke, M. Warschauer, and D. O’Dowd. Predicting MOOC performance with week 1 behavior. In Educational Data Mining, 2014. [6] H. Khalil and M. Ebner. MOOCs completion rates and possible methods to improve retention - a literature review. In World Conference on Educational Multimedia, Hypermedia & Telecommunications, 2014. [7] R. Kizilcec and S. Halawa. Attrition and achievement gaps in online learning. In Learning at Scale, 2015. [8] M. Kloft, F. Stiehler, Z. Zheng, and N. Pinkwart. Predicting MOOC dropout over weeks using machine learning methods. In Proceedings of the EMNLP 2014 Workshop on Analysis of Large Scale Social Interaction in MOOCs, pages 60–65, 2014. [9] J. Movellan. Tutorial on Gabor filters. Technical report, UCSD Machine Perception Laboratory, 2002. [10] D. Onah, J. Sinclair, and R. Boyatt. Dropout rates of massive open online courses: behavioural patterns. In Conf. on Education and New Learning Tech. , 2014. [11] J. Reich. MOOC completion and retention in the context of student intent. EDUCAUSE Review, 2014. [12] R. Rivard. Measuring the MOOC dropout rate. Insider Higher Ed, 2013. [13] R. Stein and G. Allione. Mass attrition: An analysis of drop out from a principles of microeconomics MOOC. PIER Working Paper, 14(031), 2014. [14] C. Taylor, K. Veeramachaneni, and U.-M. O’Reilly. Likely to stop? Predicting stopout in massive open online courses. arXiv, 2014. http://arxiv.org/abs/1408.3382. [15] C. Tyler and C.-C. Chen. Signal detection theory in the 2AFC paradigm: attention, channel uncertainty and probability summation. Vision Research, 40(22):3121–3144. [16] E. Vural, M. Bartlett, G. Littlewort, M. Cetin, A. Ercil, and J. Movellan. Discrimination of moderate and acute drowsiness based on spontaneous facial expressions. In ICPR, 2010. [17] D. Yang, T. Sinha, D. Adamson, and C. P. Rose. “Turn on, tune in, drop out”: Anticipating student dropouts in massive open online courses. In NIPS Workshop on Data-Driven Education, 2014.