Biomacromolecules 2007, 8, 920-927
920
Binding Interaction of a Biological Photosensitizer with Serum Albumins: A Biophysical Study Alok Chakrabarty, Arabinda Mallick, Basudeb Haldar, Paramita Das, and Nitin Chattopadhyay* Department of Chemistry, Jadavpur University, Calcutta-700 032, India Received November 15, 2006; Revised Manuscript Received December 30, 2006
A photophysical study on the binding interaction of an efficient cancer cell photosensitizer, norharmane (NHM), with model transport proteins, bovine serum albumin (BSA) and human serum albumin (HSA), has been performed using a combination of steady-state and time-resolved fluorescence techniques. The emission profile undergoes a remarkable change upon addition of the proteins to the buffered aqueous solution of the photosensitizer. The polarity-dependent prototropic transformation is responsible for the remarkable sensitivity of this biological fluorophore to the protein environments. A marked increase in the fluorescence anisotropy in the proteinous environments indicates that the albumin proteins introduce motional restriction on the drug molecule. Light has been thrown on the denaturing action of urea on the probe-bound protein. The probable binding site of the drug in proteins has also been assessed from the combination of denaturation study, micropolarity measurement, and fluorescence resonance energy transfer (FRET) study. The present study suggests that the stability of serum albumins is enhanced upon binding with the drug.
1. Introduction Serum albumins, abundant in plasma, are the most widely studied proteins. Structural aspects and properties of these transport proteins have been well explored. The primary structure of these transport proteins has about 580 amino acid residues and is characterized by a low content of tryptophan and a high content of cystine stabilizing a series of nine loops. The secondary structure of these serum albumins is constituted of 67% of helix of six turns and 17 disulfide bridges.1,2 The tertiary structure is composed of three domains, I, II, and III. Each domain is constituted by two subdomains named as IA, IB, IIA, IIB, IIIA, and IIIB.1,2 Because domains II and III share a common interface, binding of a probe to domain III leads to conformational changes affecting the binding affinities to domain II. Bovine and human serum albumins (BSA and HSA) display approximately 80% sequence homology and a repeating pattern of disulfides, which are strictly conserved. The molecular weights are 66 kD for BSA and 66.5 kD for HSA.2 From the spectroscopic point of view, one of the main differences between the two proteins is that BSA has two tryptophan residues (Trp134 and Trp-212) and HSA has only one (Trp-214). This additional tryptophan residue in BSA is located at position 134, buried in a hydrophobic pocket, and it has been proposed to lie near the surface of the albumin molecule in the second helix of the first domain.2 Albumins have been identified as major transport proteins in blood plasma for many compounds such as fatty acids. Many drugs and other bioactive small molecules can bind reversibly to albumins, whereby the latter serves as carrier. Serum albumins are effective in increasing the solubility of hydrophobic drugs in plasma and modulate their delivery to cell in vivo and in vitro. They also play a leading role in drug disposition and efficacy. Furthermore, albumins are the principal biomacromolecules that are involved in the maintenance of colloid-blood pressure and are implicated in the facilitated transfer of many * Corresponding
[email protected].
author.
Fax:
91-33-24146266.
E-mail:
ligands across organ-circulatory interfaces such as in the liver, intestine, kidney, and brain.3 Fluorescence-probe spectroscopy of proteins is one of the most powerful methodologies, yielding structural and dynamical information concerning the fluorophore environment. It has a long history of the application of excitedstate molecular interactions between a probe and its environment.4-9 The interest on the photophysical study of the natural product, norharmane (NHM), in different microheterogeneous environments stems principally from two aspects. The first one comes from its novel biological applications, such as photosensitizer, toward a variety of systems, including bacteria, fungi, viruses, etc.10,11 The use of photosensitizing agents together with light for the treatment of neoplastic diseases, generally known as photodynamic therapy (PDT), has become a topic of increasing medical interest. PDT produces singlet oxygen that is detrimental to the cancerous cells. This is an established modality for cancer treatment.12 Norharmane has been reported to be quite effective in producing singlet oxygen, and it could be used as an efficient cancer cell photosensitizer.13 The extent of photodynamic action depends not only on the singlet oxygen production but also on the biodistribution of the probe molecule in the cytoplasmic and mitochondrial membranes, the retention, and the nature of the binding inside the cell. Norharmane or β-carboline (9Hpyrido[3,4-b] indole), a nontoxic alkaloid in the ground state, belongs to the group of alkaloids. Beljansky et al. have found that some β-carbolines can destroy selectively and completely the proliferative capacity of various types of cancer cells that is enhanced upon excitation with UV radiation.14 This behavior makes the study of photophysicochemical properties of this molecule even more interesting. Under the situation, the spectroscopic and photophysical data of this molecular system in homogeneous and microheterogeneous media are very helpful for a better understanding of the nature of binding and biodistribution of this dye system inside the living cells. The second aspect concerns the unusual emission properties of NHM such as multiple fluorescence and extreme sensitivity toward pH of the microenvironment. The photophysical and/or
10.1021/bm061084s CCC: $37.00 © 2007 American Chemical Society Published on Web 02/22/2007
Biomacromolecules, Vol. 8, No. 3, 2007 921
Interaction of a Photosensitizer with SAs Scheme 1. Different Acid-Base Equilibria for Norharmanea
a CN, cation-neutral; NA, neutral-anion; ZA, zwitterion-anion; and CZ, cation-zwitterion.
photochemical properties of NHM have been shown to be strongly modified by the solvents.15-17 In aqueous solution, NHM exists in four different forms (neutral, cation, anion, and zwitterion) depending on the pH of the medium.17 The various acid-base equilibria for NHM have been presented in Scheme 1. A good number of biochemical and molecular biological investigations have already been made using norharmane.18,19 Some of them are based on other methods, for example, microdialysis sampling technique combined with liquid chromatography, and flow injection chemiluminescence for studying drug-protein interaction.20,21 In the present paper, we have exploited both steady-state and time-resolved photophysical means to study the interaction of NHM with the model transport proteins because of its high sensitivity and ease of handling. The potential utility of the present work resides in exploring the potential application of the fluorescence property of NHM for studying its interactions with relevant biological targets such as proteins, biomembranes, etc. The interactions between β-carbolines and these biological receptors are yet to be explored. Hence, the present study will have a significant impact for understanding these properties. In our continuing effort, we have already studied the interaction of this bioactive fluorophore (NHM) in micellar as well as cyclodextrin environments.22,23
2. Experimental Section Norharmane procured from Aldrich was purified by recrystallization from ethanol. BSA (98%, fraction V) and HEPES (N-[2-hydroxyethyl]piperazine-N′-[2-ethanesulphonic acid]) buffer (SRL India) and HSA (Sigma, >96%) were used as received. 50 × 10-3 mol L-1 buffer solution was prepared, and its pH was adjusted to 7.0. The same buffer solution was used as bulk medium throughout the experiment. Analytical grade urea (SRL, India) was used for the denaturation study without further purification. Spectroscopic grade 1,4-dioxane (Aldrich) was used for the polarity measurement experiments. Triply distilled water was used throughout the experiment. The fluorophore was excited at 350 nm so as to excite principally the neutral species of NHM in the ground state.17 A Shimadzu MPS 2000 absorption spectrophotometer and a Spex fluorolog-2 spectrofluorimeter were used for the absorption and emission spectral studies, respectively, at 300 K. The steady-state fluorescence anisotropy measurements were performed with a Hitachi spectrofluorimeter model F-4010. Steady-state anisotropy, r, is defined by:
r ) (IVV - GIVH)/(IVV + 2GIVH)
(1)
G ) IHV/IHH
(2)
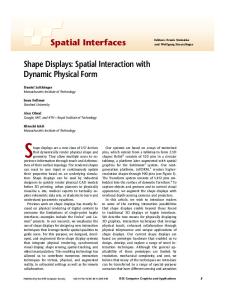
Figure 1. Emission spectra of NHM as a function of HSA concentration (λexc ) 350 nm). Curves (i) f (vii) correspond to 0, 1 × 10⁻⁵, 2 × 10⁻⁵, 4 × 10⁻⁵, 6 × 10⁻⁵, 8 × 10⁻⁵, and 10 × 10-5 mol L-1 HSA, respectively. [Inset represents the emission spectra of NHM as a function of BSA concentration (λexc ) 350 nm). Curves (i) f (vii) correspond to 0, 2 × 10⁻⁵, 4 × 10⁻⁵, 6.5 × 10⁻⁵, 9 × 10⁻⁵, 14 × 10-5, and 19 × 10-5 mol L-1 BSA, respectively.]
where IVV and IVH are the intensities obtained with the excitation polarizer oriented vertically and the emission polarizer oriented vertically and horizontally, respectively. I terms associated with G refer to the similar parameters as mentioned above for the horizontal position of the excitation polarizer. All of the anisotropy measurements were performed at room temperature (300 K). For all of the experiments, the concentration of NHM was ca. 2 × 10⁻⁵ mol L-1. Circular dichroism (CD) spectra were recorded on a JASCO J-720 spectropolarimeter, using a cylindrical cuvette with 1 mm path length. The CD profiles were obtained employing a scan speed of 20 nm/min and signal averaged for five successive scans. Appropriate baseline corrections in the CD spectra were made. For the CD experiment, HSA and BSA concentrations were kept at 5 × 10⁻⁶ and 10 × 10-6 mol L-1, respectively. Fluorescence lifetimes were determined from time-resolved intensity decay by the method of time correlated single-photon counting (TCSPC) using a nanosecond diode (IBH, U.K. nanoLED-03) as the light source at 370 nm. The typical response of this excitation source is 1.2 ns. The decay curves were analyzed using IBH DAS-6 decay analysis software. Goodness of fits were evaluated from χ2 criterion and visual inspection of the residuals of the fitted function to the data. The lifetimes were measured in air-equilibrated solution at ambient temperature. Mean (average) fluorescence lifetimes (τ) for triexponential iterative fittings were calculated from the decay times and the normalized preexponential factors using the following relation:
〈τ〉 ) a1τ1 + a2τ2 + a3τ3
(3)
3. Results and Discussion The absorption spectrum of NHM in HEPES buffer solution at pH 7.0 shows two bands with maxima at 348 and 372 nm corresponding to the neutral and cationic species, respectively.17 Addition of BSA or HSA to the aqueous buffered solution of NHM hardly changes the absorption spectrum. The room-temperature emission spectrum of NHM solution in HEPES buffer shows a single and unstructured band peaking at 450 nm ascribed to the cationic species.17,21 Gradual additions of BSA and HSA in buffered solution change the emission spectrum drastically. A new blue-shifted emission band with a peak at 380 nm develops at the cost of the emission corresponding to the cationic species at 450 nm, resulting in an isoemissive point at 410 nm for BSA and 392 nm for HSA. Figure 1 depicts the emission spectra of NHM as a function of BSA and HSA concentrations. Consistent with the existing literature, the 380 nm band has been ascribed to the neutral species of NHM.17
922
Biomacromolecules, Vol. 8, No. 3, 2007
Chakrabarty et al.
The modifications of the emission spectrum in the presence of BSA and HSA reflect that the microenvironments around the fluorophore in the protein solutions are quite different from that in the pure aqueous phase. The decrease in the intensity of the cationic band and the appearance of the neutral band suggest that the polarities of the protein environments are less than the polarity of the bulk aqueous phase because a similar fluorometric transformation is observed in less polar solvents. A fluorometric study in a varying composition of water-dioxane mixture, to be discussed in a forthcoming section, shows a similar enhancement in the emission of the neutral species of NHM and a concomitant decrease in the emission of the cationic species when the dioxane proportion is increased in the solvent mixture. This implies that the micropolarity of the environment plays a dominant role in the prototropic behavior of NHM. Because an increase in the dioxane proportion in water-dioxane mixture lowers the polarity of the environment, the variation in the fluorescence behavior of NHM in BSA and HSA indicates that the polarity around the fluorophore bound to BSA and HSA is less than that in the bulk aqueous phase. Thus, the fluorometric response of NHM in protein environment can be attributed to the reduced polarity of the microenvironment. As is evident from Figure 1, as compared to the situation in BSA environment, in HSA there is greater drop of fluorescence intensity of the cationic species of NHM, while the appearance of the neutral band is rather less prominent. As will be discussed in the following section, a stronger binding of NHM with HSA as compared to that with BSA might be responsible for a greater degree of fluorescence quenching of the cationic species of NHM in HSA. Low fluorescence quantum yield of the neutral species of NHM in HSA environment or energy transfer between NHM and albumins through some unidentified mechanism might be responsible for the other part of this observation. Further studies are invited before offering an unequivocal rationalization. 3.1. Drug-Protein Binding. The usefulness of the drugs as therapeutic agents is basically dependent on their binding ability that can also influence the drug stability and toxicity during their chemotherapeutic process. In addition, the drug-protein complex may be considered as an excellent miniature model for gaining insights into the general drug-protein interaction. To see the binding interaction between NHM and albumin proteins, the binding constant values have been determined from the fluorescence intensity data considering the following rearranged equation of the original one developed by Benesi and Hildebrand based on 1:1 probe-protein complexation.24
1/∆F ) 1/∆Fmax + (1/K[L])(1/∆Fmax)
(4)
Here, ∆F ) Fx - F0 and ∆Fmax ) F∞ - F0, where F0, Fx, and F∞ are the fluorescence intensities of NHM in the absence of protein, at an intermediate protein concentration, and at a protein concentration when the interaction is complete, respectively. K is the binding constant, and [L] is the total protein concentration. Because cationic species of NHM prefer to be in the region of the albumin proteins, which is mostly exposed to the aqueous environments as evident from the fluorescence anisotropy study, to be discussed in the following section, we have monitored the neutral fluorescence of NHM to study the binding interaction between the drug molecule and the protein. Rearranging eq 4, we have the following form:
[(F∞ - F0)/(Fx - F0)] - 1 ) (K[L])-1
(5)
Plots of [(F∞ - F0)/(Fx - F0)] - 1 against [L]-1 for both BSA and HSA show linear variations (Figure 2), justifying the validity
Figure 2. Plot of [(F∞ - F0)/(Fx - F0)] - 1 against [L]-1 for HSA [inset shows the similar plot for BSA].
of the above equation and hence confirming one-to-one interaction between the drug and the proteins. The binding constant values have been determined from the slope of the individual plots. It is important to mention here that [L] should be the free concentration of the protein, which is, as such, unknown. As a practice, the total concentration of protein added at each stage is used as [L]. The problem can, however, be resolved by adopting the self-consistent approach similar to the one used during the orbital calculations. In the first stage, one can determine K using the total protein concentration as [L]. Taking this K, one can easily calculate, for 1:1 association, concentrations of the protein in the free and bound state. In the second stage, one can redetermine K using this free protein concentration as [L]. Proceeding this way, one arrives at a self-consistent value of the association constant K. Following this technique, we determine the binding constant values to be 1.25 × 10⁵ and 1.33 × 10⁴ mol-1 for HSA and BSA, respectively, corresponding to the free energy changes (∆G) of -29.27 and -23.68 kJ mol-1 for the binding of NHM with the two albumin proteins, respectively, at ambient temperature. The determined K values ((15%) fall in the normal range reported earlier for such type of complexations with other probes.25,26 From a look at the relative values of K, it is evident that the probe binds in a stronger way with HSA than with BSA. This is, as mentioned earlier, reflected in the larger drop of fluorescence intensity of the cationic species of NHM in case of HSA with the addition of a definite amount of BSA or HSA. 3.2. Steady-State Fluorescence Anisotropy: Motional Information of the Drug. Because polarization (anisotropy) measurements can give details about an association or binding phenomenon, the technique has been employed to gather additional evidence in support of the interaction of the probe with the native albumin proteins. It reflects the extent of restriction imposed by the microenvironment on the dynamic properties of the probe, and hence can be exploited in assessing the motional information in the microheterogeneous environments.27 An increase in the rigidity of the surrounding environment of a fluorophore results in an increase in the fluorescence anisotropy. We have monitored the fluorescence anisotropy as a function of protein concentration for both fluorescence bands of NHM (at 380 and 450 nm corresponding to the neutral and the cationic species, respectively). The fluorescence anisotropy monitoring at 450 nm shows a nominal change (data not shown) in both proteins. This suggests that the cationic species in the presence of albumins resides in the protein surface facing the aqueous bulk. The fluorescence anisotropy monitoring the neutral species (at 380 nm), however, shows a marked increase on moving from the aqueous phase to the protein environments (Figure 3), revealing that the rotational diffusion of the neutral
Interaction of a Photosensitizer with SAs
Biomacromolecules, Vol. 8, No. 3, 2007 923
Figure 3. Variation of fluorescence anisotropy (r) of NHM with increasing concentrations of HSA and BSA (in the inset). λem is 380 nm for both proteins.
form of the probe molecule is restricted significantly. This reflects that the proteins bind with the neutral form of the probe more strongly as compared to its cationic counterpart. Figure 3 presents the variation of the fluorescence anisotropy (r) of the 380 nm emission of NHM as a function of protein concentration for both HSA and BSA. The plots show a marked increase in the anisotropy value with increasing concentration of both proteins, implying an imposed motional restriction on the fluorophore in the proteinous environments. After binding of a fluorophore to a protein, the motion of that fluorophore depends not only on its size but also on the following factors: (i) the nature of the attachment of the fluorophore, (ii) the three-dimensional shape and motions of the protein, and (iii) the global Brownian tumbling of the probeprotein aggregate. The overall dimension of the protein-bound probe is logically much larger than that of the unbound species itself. This leads to a marked reduction in the tumbling motion for the former, resulting in an increase in the anisotropy value. An increase in the anisotropy value for the 380 nm emission of NHM in HSA is greater as compared to that in BSA at the same concentration of the proteins (Figure 3) and is consistent with our proposition of stronger binding of the probe with the former than with the latter. Figure 3 further reveals that with increasing protein concentrations, fluorescence anisotropy (r) increases rapidly at the beginning (up to [HSA] ≈ 3 × 10⁻⁵ mol L-1 and [BSA] ≈ 7.5 × 10⁻⁵ mol L-1) and then levels off gradually. A similar observation has also been reported by Mishra et al.28,29 The difference in the amounts of the two proteins needed for the leveling effect is ascribed to the difference in their affinity toward the probe molecule. Although the final anisotropy values do not differ very much for the two proteins (r is 0.20 in HSA and 0.17 in BSA), attainment of the value at a much lower concentration of HSA as compared to that of BSA suggests a higher degree of motional restriction on the fluorophore in the former, a corroboration of the greater binding interaction between the probe and HSA than the probe-BSA interaction as reported above. Because fluorescence anisotropy is intimately related to the viscosity of the microenvironment around the fluorophore, microviscosity is often estimated from a comparison of the fluorescence anisotropy of a fluorophore in an environment with those of the probe in environments of known viscosities.30-34 With a similar intention, we have extended the anisotropy measurements of NHM in a glycerol-water mixture of different compositions and compared the values with the anisotropy values of the protein-bound situations. Interestingly, we have noticed that the anisotropy value of NHM in a 90/10 glycerol/ water mixture is still remarkably lower than the anisotropy in
Figure 4. Variation of cationic fluorescence yield of NHM in waterdioxane mixture against ET(30). Inset shows the emission spectra of NHM in dioxane-water mixture under the same experimental condition (λexc ) 350 nm). Water/dioxane compositions (vol %) of the solvent mixtures for curves (i) f (vii) correspond, respectively, to 100/ 00, 80/20, 70/30, 65/35, 60/40, 55/45, and 20/80.
the protein environment at the saturation level. It is, however, hard to believe that the viscosity in the BSA and HSA is high enough to exceed the viscosity of a 90/10 glycerol/water mixture.30,31 This observation thus suggests the dominance of the rotational correlation time for proteins over the normal viscosity effect. This interesting observation can be rationalized considering a stronger interaction between the probe and the proteins, maybe through some specific interactions like hydrogen bonding, etc.33 3.3. Polarity of the Microenvironment. For a couple of decades, fluorescent probes have been serving a unique role in the determination of the microscopic polarity of the biological systems.35-37 The polarity determined through different photophysical parameters of the probe gives a relative measure of the polarity of the microenvironments. In the present report, we have attempted to have an estimate of the micropolarity of the proteinous environments around the fluorophore, considering the fact that there are very few reports so far on the prospective use of polarity sensitive fluorophore molecule for the determination of micropolarity in proteins. Local polarity of a biological system such as a protein, having binding interaction with fluorescent molecules, can be estimated by comparison of the spectral properties of the fluorophore in that environment with those of the probe in pure solvents or in solvent mixtures of known polarities.32-37 It is true that the polarity of a homogeneous environment is not exactly the same as the polarity in a protein medium. However, to have a qualitative estimate, polarities in the microheterogeneous environments such as micelles, reverse micelles, proteins, and lipids are often determined and expressed in ET(30) scale (a solvent polarity parameter based on the transition energy for the solvatochromic intramolecular charge transfer absorption of the betaine dye 2,6diphenyl-4-(2,4,6-triphenyl-1-pyridino) phenolate and developed by Reichardt36) comparing the fluorescence behavior of the probe in microheterogeneous environments to that in a mixture of homogeneous solvents of varying composition.33-38 This polarity has been referred to the static polarity by Sytnik and Kasha.38 We have studied the fluorescence behavior of NHM in a water-dioxane mixture of varying composition (inset of Figure 4). To determine the micropolarity in BSA and HSA,
924
Biomacromolecules, Vol. 8, No. 3, 2007
the fluorescence behavior of NHM within this protein environment has been compared to that in water-dioxane mixture of varying composition. The inset of Figure 4 reveals that with a decrease in the water proportion in the water-dioxane solvent mixture the emission intensity of the neutral species increases at the cost of the emission of the cationic species. This means that as the polarity of the microenvironment around the probe is reduced the cation is destabilized and the prototropic reaction moves toward the neutral species. An increase in the neutral to cationic fluorescence yield in the protein environment from that in the pure buffered aqueous medium indicates that the microenvironment around the probe in protein is reasonably less polar than the bulk water. As already mentioned, the variation (increase) of the neutral emission of NHM in HSA is not as remarkable as that in the reference solvents (water-dioxane mixture), may be due to the presence of other quenching processes, but the variation (decrease) of cationic band in both BSA and HSA is comparable to that in the reference solvents. So, we have monitored only the cationic emission to measure the polarity. A calibration curve was constructed taking the logarithm of the ratio of fluorescence intensity of cationic species of NHM in the absence (F0) and in the presence (F) of dioxane in the water-dioxane solvent mixture against ET(30), and a linear plot was obtained. Comparing the value of the cationic fluorescence intensity of the NHM bound to BSA and HSA with the above correlation, we have determined the micropolarities around drug molecule to be 57.1 and 54.9 in the native state of the two protein environments, respectively. The micropolarity values suggest that the probe is located in a more hydrophobic region in HSA as compared to that in BSA environment. Measured binding constant and anisotropy values also support this conjecture. 3.4. Urea-Induced Protein Unfolding Studies. Steady-state fluorescence measurements, dictating changes in the tertiary structure of proteins, are complementary pathways to explore the conformational stability of globular proteins.27 The unfolding process of serum albumins on increasing concentration of urea has been well studied.39-42 These studies suggest that the denaturation of BSA and HSA in the presence of increasing urea concentration takes place at a single, two-state transition through intermediate state (I) at 4-6 mol L-1 urea.39,40 After finding the binding interaction between the drug and BSA/HSA, we intended to see the denaturing effect of the protein on its binding activity and on the overall photophysics of the drug. In the present work, urea-induced modification of the protein bound drug has been studied by means of steady-state fluorescence measurements. The fluorescence spectrum of protein-bound NHM (Figure 1) shows a decreased cationic emission at 450 nm for both cases (BSA and HSA) and an enhanced (depending upon the protein) neutral emission at 380 nm under normal condition (when the protein is in native state). On gradual addition of the urea to the protein-bound NHM, the emission profile undergoes a significant change opposite to the observation in Figure 1 (data not shown), along with a decrease in the fluorescence anisotropy (Figure 5). The reverse pattern in the variation of the fluorescence spectrum with respect to Figure 1 and the decrease in the steadystate fluorescence anisotropy values suggest that addition of urea leads to weakening of the probe-protein binding, resulting in the release of the probe molecules into the bulk aqueous phase. The increase in the cationic band indicates that the urea increases the polarity of the microenvironment. The increase in the cationic to neutral fluorescence ratio and decrease in fluores-
Chakrabarty et al.
Figure 5. Fluorescence anisotropy of (a) HSA-bound NHM and (b) BSA-bound NHM as a function of urea concentration. Table 1. Micropolarity Values in Terms of ET(30) at Different States of BSA and HSA different states of proteins
HSA
BSA
native (N) intermediate (Int) unfolded (U)
54.9 58.1 58.9
57.1 57.9 58.2
cence anisotropy when urea is added remain unexplained unless and until we assume that urea causes a decrease in the number of fluorophores bound to the protein.43 Consistent with our earlier work, we believe that urea displaces some water molecules adjacent to the probe in the protein environment with the denaturation of the latter.9,33 The resulting destabilization leads to the desolvation of the guest molecule and expulsion of it to the bulk aqueous phase. It is pertinent to mention here that in the presence of a sufficient amount of urea (9 mol L-1), the emission maxima, the anisotropy values, and mean fluorescence lifetime values closely correspond to the values in aqueous environment. These observations thus suggest that the proteins bind with the drug in their native forms, and denaturation of BSA and HSA leads to the release of the drug from the protein environment to the bulk aqueous phase. 3.5. Binding Site of the Drug. Exploring the binding site of any biologically active drug in proteins is the crucial factor for understanding the efficacy of the drug as therapeutic agent. To assess the binding site of the drug in the protein environments, we coupled together the denaturation study, micropolarity measurement, and the fluorescence resonance energy transfer (FRET) study. We have determined the micropolarity around the drug in different states of the proteins, that is, at native (N), intermediate (Int), and unfolded (U) states. Literature reports reveal that the intermediate state (in the presence of 4.8-5.2 mol L-1 urea)41 is characterized by the unfolding of domain III and partial loss of the native conformation of domain I.41,42,44,45 The unfolded (U) state is characterized mainly by the unfolding of domain II.42,45 The measured micropolarity values around the drug at different states of both proteins are given in Table 1. From Table 1, it is clear that in HSA, for the N-Int transition (involving domain I and III), there is a marked difference in the micropolarity values, and for the Int-U transition (involving domain II), there is a relatively smaller polarity difference. This observation leads to the point that there is a possibility of the drug molecule to be in either of the domains (I, II, or III). At this situation, the FRET study provides an effective way to check the proximity of the probe molecule to the tryptophan (Trp)
Interaction of a Photosensitizer with SAs
Biomacromolecules, Vol. 8, No. 3, 2007 925
Figure 6. Plot of (F/F0) of the proteins against concentration of urea in the absence (black) and in the presence of NHM (red) [λexc) 280 nm, λem) 350 nm]. For details, see text.
residue of the proteins. Despite the fact that there is a very good overlap between the emission band of the tryptophan and the absorption band of NHM, we did not notice the occurrence of FRET either in HSA or in BSA. Lack of existence of the FRET phenomenon from Trp in HSA to NHM suggests that the drug molecule is not located near the Trp moiety in HSA and excludes the possibility of the localization of the drug in domain II (where Trp-214 is situated). In one of our previous works, we found that the micropolarity value near the domain II in HSA is around 50.1 in terms of ET(30).9 In the present study, the measured value (54.9) is significantly higher than the previous one (50.1). Because domain II and domain III are located in a more hydrophobic region than domain I,2 it is logical to exclude domains II and III as the binding site for the drug leaving domain I as the possible binding site for the drug molecule. Table 1 reveals that the difference in the micropolarity values for the N-Int transition of BSA (involving domains I and III) is relatively large as compared to the polarity difference for the Int-U transition (involving domain II). This implies a greater probability for the NHM molecule to reside in either domain I or III relative to domain II. A reasonably higher micropolarity value around the drug in the native BSA as compared to that in HSA (Table 1) again proposes that the drug is not situated in the domain III because this domain is known to be present in a more hydrophobic region. Hence, the most probable binding site of the drug in BSA is supposed to be domain I. Nonoccurrence of FRET in the BSA environment, however, indicates that the drug is situated away from the Trp-134. So, the most probable binding site of the drug in both BSA and HSA is near domain I, the drug more exposed to the aqueous environment in BSA environment as compared to the situation in HSA. Although the principal hydrophobic binding regions in BSA and HSA are located in domains II and III, domain I, characterized by a strong net negative charge, can serve as proper binding site to many cationic ligands or drugs.2 This goes in favor of our proposition in the assessment of the binding site of NHM to the albumin proteins. 3.6. Structural Stability of Serum Albumins. Binding of a ligand with a protein may stabilize or destabilize the latter. The effect of NHM binding on the stability of proteins was investigated by urea-induced unfolding of the proteins by monitoring the steady-state protein fluorescence. For this purpose, serum albumins were excited at 280 nm (absorption maximum of tryptophan residue present in BSA and HSA), and fluorescence of tryptophan residue was recorded at 350 nm with gradual addition of urea in the absence and in the presence of NHM. It was observed that the protein fluorescence gradually
Figure 7. Far-UV CD spectra of BSA in the absence and in the presence of NHM.
diminishes due to the denaturating action of urea. A transition curve using relative fluorescence intensity, that is, fluorescence intensity of the proteins in the presence of urea (F) to that in its absence (F0), was plotted against concentration of urea for both BSA and HSA system. Figure 6 presents the variation patterns. The transition curves appear sigmoidal. We measured the values of the urea concentration at half completion of the transition (where one-half of the native state of proteins has been denatured) indicated as [den]1/2, and it is determined from the midpoints of these transition curves. An increase in the required urea concentration is observed for proteins bound to NHM as compared to the bare proteins. Figure 6 reflects that, for both HSA and BSA, [den]1/2 is higher in the presence of NHM as compared to the bare proteins. With urea, [den]1/2 moves from 3.1 mol L-1 for HSA (9 × 10⁻⁵ mol L-1) to 3.4 mol L-1 in the presence of NHM (2 × 10⁻⁵ mol L-1) and from 5.1 to 5.8 mol L-1 for BSA (20 × 10-5 mol L-1) in the presence of the same amount of NHM. The requirement of a greater amount of urea in the presence of NHM for both HSA and BSA reveals that both serum albumins are stabilized significantly in the presence of NHM. To ascertain the possible influence of drug binding on the secondary structures of BSA and HSA, we have performed farUV circular dichroism studies in both albumin proteins in the absence and in the presence of the 2 × 10⁻⁵ mol L-1 NHM. Consistent with the literature, the CD spectra for the BSA (20 × 10-5 mol L-1) and HSA (9 × 10⁻⁵ mol L-1) solutions, monitored in the range 250-200 nm, showed two bands at 209 and 222 nm.45 Figure 7 presents a set of representative CD spectra for the BSA-probe system. The superimposed CD spectra of the proteins in the absence and in the presence of the probe reveal that, at least in the experimental concentration
926
Biomacromolecules, Vol. 8, No. 3, 2007
Chakrabarty et al. Table 3. Photophysical Parameters of NHM in Aqueous Buffer and Protein Environments 〈τf〉 kr × 10-11 knr × 10-11
Figure 8. Time-resolved fluorescence decays of NHM in aqueous buffer, HSA, and BSA media (λexc ) 370 nm). The sharp profile on the left is the lamp profile. Table 2. Lifetimes of NHM in Buffer, BSA, and HSA Environments environment
a1
τ1 (ns)
a2
τ2 (ns)
a3
τ3 (ns)
χ2
buffer 1.0 11.05 1.234 BSA (20 × 10-5 mol L-1) 0.278 11.47 0.201 3.76 0.521 0.66 1.167 -5 -1 HAS (9 × 10 mol L ) 0.256 10.71 0.159 3.05 0.585 0.36 1.205
range, there is no detectable structural change of the proteins upon binding with the probe. A similar observation was also reported by Sengupta and Sengupta.46 3.7. Time-Resolved Studies. Fluorescence lifetime serves as a sensitive parameter for exploring the local environment around a fluorophore, and it is sensitive to excited-state interactions.47 It also contributes to the understanding of the interactions between the probe and the proteins.9 In buffer, at pH 7, NHM exhibits a single-exponential decay with a lifetime of around 11 ns,48 but in the protein environments the decay of NHM becomes multiexponential. Multiexponential decay of the fluorescence is quite common, even for chromophores in homogeneous environments, and it is often difficult to assign mechanistic models to various components of the decay. The multiexponential decay of a polarity-sensitive probe molecule may originate from the location of the probe in different polarity regions. Typical decay profiles of NHM in the two protein environments are shown in Figure 8, and the deconvoluted data are represented in Table 2. The specific concentrations used for the proteins are indicated in Table 2. These concentrations were chosen because further addition of proteins failed to bring any further change in the spectral pattern or lifetime of the probe. A glance at Table 2 reflects that two of the lifetime values (τ2 and τ3) are observed to be lower than those measured in aqueous buffered solution, while the remaining component (τ1) is of the same order as obtained in protein-free buffered solution. So, τ1 components may be assigned to the free (not bound to protein) probe molecule in proteinous environments. Extraction of meaningful rate constants of the fluorophore with multiexponential decay pattern in such heterogeneous systems is really difficult. Such behavior may be attributed to the possible existence of different hydrogen-bonding species formed with surrounding solvent (water) molecules in proteins.49 From the lifetime data of the fluorophore, the degree of exposure of the probe to aqueous phase can be predicted. The closer are the lifetime values in the protein environment and the aqueous environment, the greater is the degree of exposure of the probe to the aqueous environment. Table 2 reveals that all of the
environments
φf
(ns)
(s-1)
(s-1)
buffer BSA (20 × 10-5 mol L-1) HSA (9 × 10⁻⁵ mol L-1)
0.31 0.11 0.07
11.05 4.30 3.44
2.8 2.4 2.0
6.0 21.0 27.0
lifetime components (τ1, τ2, and τ3) in BSA are higher than the corresponding values in HSA. This indicates that in BSA the polarity of the microenvironment is higher than that in the HSA environment; that is, probe molecule resides in the more polar region in BSA than that in HSA environment, resulting in a concomitant increase in the lifetime values. This is corroborative to our previous discussions. Instead of placing too much importance on the magnitude of individual decay constants for such multiexponential decays, we chose to use the mean fluorescence lifetime defined by eq 3 as an important parameter for exploiting the behavior of NHM molecule bound to the proteins.9,50 The average lifetime values of NHM in protein environments are tabulated in Table 3. The protein environments affect the decay parameters, and the average lifetime in BSA and HSA decreases as compared to its value in albumin-free buffer medium. The lowering in the polarity values around the probe in the proteinous environments is reflected by the decrease in the fluorescence lifetime. From the observed fluorescence quantum yield (φf) and 〈τf〉 of the cationic species (because in buffer only cationic species exists), we can calculate the radiative and nonradiative rate constants for NHM using eqs 6 and 7 that follow:
kr ) φf/〈τf〉
(6)
1/〈τf〉 ) kr + knr
(7)
where φf, 〈τf〉, kr, and knr are the fluorescence quantum yield of the cationic species, mean fluorescence lifetime of the cationic species, radiative rate constant, and nonradiative rate constant, respectively. All of these photophysical parameters are tabulated in Table 3. It is apparent from Table 3 that in protein environments the nonradiative rate constants knr are reasonably increased from that in the aqueous buffered medium. So, the lowering in the lifetime of the fluorophore in the protein environments is attributed to the enhanced nonradiative rates in the protein environments.
4. Conclusion The present work reports a study of the interaction of a biological photosensitizer, NHM, with BSA and HSA proteins. The photophysical behaviors of the drug are modified remarkably in these environments as compared to those in the aqueous phase. This has been exploited to explore the binding efficiency, the nature of the microenvironment around the drug, and the micropolarity at the binding site. The studies suggest that NHM binds with both BSA and HSA; the binding is, however, stronger with the latter. In this work, the denaturating action of urea toward the albumin proteins is demonstrated, throwing some light on the probable binding location of the drug in the proteineous environment. The most probable binding site of the drug is domain I for both serum albumins. Urea-induced protein unfolding studies indicate that the stability of the serum albumins is substantially enhanced upon binding with the photosensitizer.
Interaction of a Photosensitizer with SAs
Acknowledgment. Financial support from DST and CSIR, Government of India, is gratefully acknowledged. We appreciate the cooperation received from Professor S. Basak, Dr. K. Giri, and Dr. H. Chakraborty of SINP for their kind help in steadystate fluorescence anisotropy and circular dichroism studies. P.D. thanks CSIR for a research fellowship.
References and Notes (1) Min, H. X.; Carter, D. C. Nature 1992, 358, 209-215. (2) Peters, T. Serum albumin. AdVances in Protein Chemistry; Academic Press: New York, 1985; Vol. 37, pp 161-245. (3) Pavdridge, W. M. Am. J. Physiol. 1987, 252, 157-164. (4) Weber, G. In Light and Life; McElory, W. D., Glass, B., Eds.; Johns Hopkins: Baltimore, MD, 1961; pp 82-106. (5) Barreleiro, P. C. A.; Lindman, B. J. Phys. Chem. B 2003, 107, 62086213. (6) Demchenko, A. P. In Topics in Fluorescence Spectroscopy: Biochemical Applications; Lakowicz, J. R., Ed.; Plenum: New York, 1992; Vol. 3, p 65. (7) Cardenas, M.; Schille´n, K.; Pebalk, D.; Nylander, T.; Lindman, B. Biomacromolecules 2005, 6, 832-837. (8) Haldar, B.; Chakrabarty, A.; Mallick, A.; Mandal, M. C.; Das, P.; Chattopadhyay, N. Langmuir 2006, 22, 3514-3520. (9) Mallick, A.; Haldar, B.; Chattopadhyay, N. J. Phys. Chem. B 2005, 109, 14683-14690. (10) Varela, A. P.; Miguel, M. G.; Mac¸ anita, A. L.; Becker, R. S.; Burrows, H. D. J. Phys. Chem. 1995, 99, 16093-16100. (11) Reyman, D.; Pardo, A.; Poyato, J. M. L. J. Phys. Chem. 1994, 98, 10408-10411. (12) Henderson, B., Dougherty, T., Eds. Photodynamic Therapy: Basic Principles and Clinical Applications; Marcel Dekker Inc.: New York, 1992. (13) Chae, K. H.; Ham, H. S. Bull. Korean Chem. Soc. 1987, 7, 478479. (14) Beljanski, M.; Beljonski, M. S. IRCS Med. Sci. 1984, 50, 587-588. (15) Sakurovs, R.; Ghiggino, K. P. J. Photochem. 1982, 18, 1-8. (16) Reyman, D.; Vinas, M. H.; Poyato, J. M. L.; Pardo, A. J. Phys. Chem. A 1997, 101, 768-775. (17) Vert, F. T.; Sanchez, I. Z.; Torrent, A. O. J. Photochem. 1983, 23, 355-368. (18) Varela, A. P.; Burrows, H. D.; Douglas, P.; Miguel, M. G. J. Photochem. Photobiol., A 2001, 146, 29-36. (19) Dias, A.; Varela, A. P.; da Miguel, M.; Becker, R. S.; Mac¸ anita, A. L.; Burrows, H. D. J. Phys. Chem. 1996, 100, 17970-17977. (20) Wei, S.; Zhao, L.; Cheng, X.; Lin, J. M. Anal. Chim. Acta 2005, 545, 65-73. (21) Wang, H.; Zou, H.; Feng, A.; Zhang, Y. Anal. Chim. Acta 1997, 342, 159-165. (22) Mallick, A.; Chattopadhyay, N. Biophys. Chem. 2004, 109, 261270. (23) Mallick, A.; Haldar, B.; Chattopadhyay, N. J. Photochem. Photobiol., B 2005, 78, 215-221.
Biomacromolecules, Vol. 8, No. 3, 2007 927 (24) Benesi, M. L.; Hildebrand, J. H. J. Am. Chem. Soc. 1949, 71, 27032707. (25) Feng, X. Z.; Lin, Z.; Yang, L. J.; Wang, C.; Bai, C. Talanta 1998, 47, 1223-1229. (26) Shobini, J.; Mishra, A. K.; Sandhya, K.; Chandra, N. Spectrochim. Acta, Part A 2001, 57, 1133-1147. (27) Lakowicz, J. R. Principles of Fluorescence Spectroscopy; Plenum: New York, 1999. (28) Deepa, S.; Mishra, A. K. J. Pharm. Biomed. Anal. 2005, 38, 556559. (29) Deepa, S.; Subramanian, K.; Mishra, A. K. Chemosphere 2005, 61, 1580-1586. (30) Wetzel, R.; Becker, M.; Behlke, J.; Billwitz, H.; Bohm, S.; Ebert, B.; Hamann, H.; Krumbiegel, J.; Lasmann, G. Eur. J. Biochem. 1980, 104, 469-475. (31) Sakai, H.; Takeoka, S.; Wettstein, R.; Tsai, A. G.; Intaglietta, M.; Tsuchida, E. Am. J. Physiol.: Heart Circ. Physiol. 2002, 283, 11911199. (32) Mallick, A.; Chattopadhyay, N. Photochem. Photobiol. 2005, 81, 419-424. (33) Mallick, A.; Haldar, B.; Maiti, S.; Chattopadhyay, N. J. Colloid Interface Sci. 2004, 278, 215-223. (34) Mallick, A.; Haldar, B.; Maiti, S.; Bera, S. C.; Chattopadhyay, N. J. Phys. Chem. B 2005, 109, 14675-14682. (35) Macgregor, R. B.; Weber, G. Nature 1986, 319, 70-73. (36) Reichardt, C. Chem. ReV. 1994, 94, 2319-2358. (37) Mallick, A.; Bera, S. C.; Maiti, S.; Chattopadhyay, N. Biophys. Chem. 2004, 112, 9-14. (38) Sytnik, A.; Kasha, M. Proc. Natl. Acad. Sci. U.S.A. 1994, 91, 86278630. (39) Gonzalez-Jimenez, J.; Cortijo, M. J. Protein Chem. 2002, 21, 7579. (40) Sulkowska, A.; Bojko, B.; Rownicka, J.; Pentak, D.; Sulkowska, W. J. Mol. Struct. 2003, 651, 237-243. (41) Tayyab, S.; Sharma, N.; Khan, M. M. Biochem. Biophys. Res. Commun. 2000, 277, 83-87. (42) Ahmad, B.; Khan, M. K. A.; Haq, S. K.; Khan, R. H. Biochem. Biophys. Res. Commun. 2004, 314, 166-173. (43) Chattopadhyay, N. ACH Models Chem. 1997, 134, 129-140. (44) Dockal, M.; Carter, D. C.; Ruker, F. J. Biol. Chem. 2000, 275, 30423050. (45) Ahmad, B.; Parveen, S.; Khan, R. H. Biomacromolecules 2006, 7, 1350-1356. (46) Sengupta, B.; Sengupta, P. K. Biopolymers 2003, 72, 427-434. (47) Das, P.; Mallick, A.; Haldar, B.; Chakrabarty, A.; Chattopadhyay, N. J. Chem. Phys. 2006, 125, 044516/1-6. (48) Draxler, S.; Lippitsch, M. E. J. Phys. Chem. 1993, 97, 11493-11496. (49) Togashi, D. M.; Ryder, A. G. J. Fluoresc. 2006, 16, 153-160. (50) Chakraborty, A.; Seth, D.; Setua, P.; Sarkar, N. J. Chem. Phys. 2006, 124, 074512/1-10.
BM061084S