Business Cycles and the Behavior of Metals Prices Eugene F. Fama; Kenneth R. French The Journal of Finance, Vol. 43, No. 5. (Dec., 1988), pp. 1075-1093. Stable URL: http://links.jstor.org/sici?sici=0022-1082%28198812%2943%3A5%3C1075%3ABCATBO%3E2.0.CO%3B2-4 The Journal of Finance is currently published by American Finance Association.
Your use of the JSTOR archive indicates your acceptance of JSTOR's Terms and Conditions of Use, available at http://www.jstor.org/about/terms.html. JSTOR's Terms and Conditions of Use provides, in part, that unless you have obtained prior permission, you may not download an entire issue of a journal or multiple copies of articles, and you may use content in the JSTOR archive only for your personal, non-commercial use. Please contact the publisher regarding any further use of this work. Publisher contact information may be obtained at http://www.jstor.org/journals/afina.html. Each copy of any part of a JSTOR transmission must contain the same copyright notice that appears on the screen or printed page of such transmission.
The JSTOR Archive is a trusted digital repository providing for long-term preservation and access to leading academic journals and scholarly literature from around the world. The Archive is supported by libraries, scholarly societies, publishers, and foundations. It is an initiative of JSTOR, a not-for-profit organization with a mission to help the scholarly community take advantage of advances in technology. For more information regarding JSTOR, please contact
[email protected].
http://www.jstor.org Wed Jun 27 16:29:19 2007
THE JOURNAL O F FINANCE
.
VOL. XLIII, NO. 5
.
DECEMBER 1988
Business Cycles and the Behavior of Metals Prices EUGENE F. FAMA and KENNETH R. FRENCH* ABSTRACT The theory of storage says that the marginal convenience yield on inventory falls at a decreasing rate as inventory increases. The authors test this hypothesis by examining the relative variation of spot and futures prices for metals. As the hypothesis implies, futures prices are less variable than spot prices when inventory is low, but spot and futures prices have similar variability when inventory is high. The theory of storage also explains inversions of "normal" futures-spot price relations around business-cycle peaks. Positive demand shocks around peaks reduce metal inventories and, as the theory predicts, generate large convenience yields and price inversions.
THE THEORY OF STORAGE of Brennan [2], Telser [6], and Working [7] is the dominant model of commodity forward and futures prices. Following Brennan and Telser, many tests of the theory use inventory data to test the hypothesis that the marginal convenience yield on inventory falls a t a decreasing rate as aggregate inventory increases. Inventory data are always a problem in this approach. It is usually unclear how aggregate inventory should be defined. For example, how should one treat government stocks? Moreover, like the metals we study, many commodities are produced, consumed, and traded internationally, and the accuracy of aggregate inventory data is questionable. Our tests of the theory of storage are also based on the hypothesis that the marginal convenience yield declines a t higher inventory levels but a t a decreasing rate. Rather than test the hypothesis by examining the inventory-convenience yield relation directly, however, we test its implications about the relative variation of spot and futures prices. These implications can be viewed as refinements of Samuelson's [5] much-tested proposition that futures prices vary less than spot prices and that the variation of futures prices is a decreasing function of maturity. Thus, the theory of storage leads us to predict that futures prices are less variable than spot prices (the Samuelson hypothesis holds) when inventory is low. When inventory is high, however, the theory predicts that spot and futures prices have roughly the same variability. Using a simple proxy for the level of inventory, our tests on the industrial metals, aluminum, copper, lead, tin, and zinc, consistently support our refinement of the Samuelson proposition. The results are in contrast to the evidence on the simple version of the Samuelson hypothesis, which is often inconclusive. See Anderson [ I ] and the references therein. * Both authors from Graduate School of Business, University of Chicago. The comments of M. Hartzmark, a referee, and workshop participants a t the University of Chicago, the University of Michigan, and the University of Utah are gratefully acknowledged. This research is supported by the National Science Foundation (Fama) and the Center for Research in Security Prices (French).
1076
The Journal of Finance
The theory of storage and the concept of a declining marginal convenience yield on inventory were developed to explain the seasonal behavior of spot and futures prices for agricultural commodities-in particular, futures prices that are below spot prices before harvests, when inventories are low and the marginal convenience yield on inventory is high. Metal inventories and prices are not affected by such seasonals, but they are affected by general business conditions, at least during the 1972 to 1983 sample period. Our evidence suggests that metal production does not adjust quickly to positive demand shocks around businesscycle peaks. As a consequence, inventories fall, forward prices are below spot prices, and spot prices are more variable than forward prices around businesscycle peaks, all in the manner predicted by the theory of storage. The success of the theory in describing metals prices over the business cycles in our sample is interesting because the predicted price behavior is generated by general business conditions rather than by the harvest seasonals that motivated the development of the theory. Our data include the dramatic swing in the price of silver and the inversion of "normal" futures-spot price relations in 1979 and 1980, which many view as evidence of a squeeze in silver markets. We offer an alternative to the squeeze hypothesis, suggested by the similar behavior of other metals prices during the same period. In particular, the large price swing and the inversion of futuresspot price relations for silver may just reflect the workings of the theory of storage over the business cycle.
I. The Relation between Forward and Spot Prices: Theory Let F(t, T ) be the forward (or futures) price at time t for delivery of a commodity at T. Let S ( t ) be the spot price. The theory of storage says that the return from purchasing the commodity at t and selling it for delivery at T, F(t, T ) - S ( t ) , equals the interest foregone during storage, S(t)R(t, T), plus the marginal warehousing cost, W(t, T), minus the marginal convenience yield, C(t, T): F(t, T ) - S ( t ) = S(t)R(t, T )
+ W(t, T ) - C(t, T).
(1)
The intuition of the convenience yield is that an uncompensated carrying cost-a futures price that does not exceed the spot price by enough to cover interest and warehousing costs-implies that storers get some other return from inventory. For example, a convenience yield can arise when holding inventory of an input lowers unit output costs and replenishing inventory involves lumpy costs. Alternatively, time delays, lumpy replenishment costs, or high costs of short-term changes in output can lead to a convenience yield on inventory held to meet customer demand for spot delivery. The storage equation (1) implies that the difference between the basis, [F(t,T ) - S ( t ) ] / S ( t )and , the interest rate, R(t, T ) ,is [F(t, T ) - S ( t ) l l S ( t ) - R(t, T ) = [W(t, T )
- C(t, T)IIS(t).
(2)
We observe F(t, T), S ( t ) , and R(t, T). Thus, the observed quantity on the lefthand side of (2)-the interest-adjusted basis-is the difference between the relative warehousing cost, w(t, T ) = W(t, T)/S(t), and the relative convenience
Business Cycles and Metals Prices
1077
yield, c(t, T ) = C(t, T)/S(t), on the right. We use this observation to develop testable hypotheses about the convenience yield and the relative variation of spot and forward prices. We assume that marginal warehousing costs for metals are roughly constant over the relevant range of inventory, and variation in C(t, T) dominates variation in W ( t ,T). The relative convenience yield c(t, T ) falls with increases in inventory, but at a decreasing rate; dc/dI < 0 and d2c/d12> 0. Figure 1 shows c(t, T ) and the interest-adjusted basis as functions of inventory. At low inventory levels, the convenience yield c(t, T ) is larger than the warehousing cost w(t, T), and the interest-adjusted basis is negative. At higher inventory levels, c(t, T ) falls toward 0.0; the interest-adjusted basis becomes positive and rises toward w (t, T). The assumption of Figure 1that the marginal convenience yield declines with increases in inventory but at a decreasing rate is intuitive and common in empirical work on the theory of storage. (See, for example, Brennan [2] and Telser [6].) It allows us to make predictions about the impact of demand and supply shocks on spot and forward prices. For example, suppose there is a permanent (current and future) increase in some industry's demand for copper. Because the shock increases current and expected spot prices, other consumers progressively substitute away from copper and producers increase planned outputs of copper. (Demand and supply elasticRelative Convenience
Yield
Inventory
Interest-
Adjusted
Basis
/
0
Inventory
Figure 1. The Relative Convenience Yield and the Interest-Adjusted Basis as Functions of Inventory
1078
The Journal of Finance
ities increase with the horizon.) These demand and supply responses partly offset the effect of the shock on expected prices. Although the demand shock is permanent, the current spot price increases more than expected spot prices because anticipated supply and demand responses mean that part of the effect of the shock on the spot price is temporary. The relative impact of the permanent demand shock on current and expected spot prices also depends on inventory and the shape of the convenience-yield function for copper. At high inventory levels, the convenience-yield function is almost flat. There can be a large inventory response to the demand shock without a large change in the convenience yield or the interest-adjusted basis. The inventory response dampens the effect of the demand shock on the current spot price, and the change in the current spot price is not much larger than the changes in expected spot prices in forward prices. Most of the change in the spot price is anticipated to be permanent. In contrast, at low inventory levels, the convenience yield rises faster when inventory is used to meet an increase in demand. As a consequence, the inventory response is smaller, and the shock has a large impact on the current spot price. The change in expected spot prices in forward prices is smaller because the market anticipates future demand and supply responses. Thus, when inventories are low, less of the change in the spot price shows up in forward prices, and the spread of forward over spot prices is more variable than when inventories are high. French [4] develops formally the implications of the assumed shape of the convenience-yield function in Figure 1.Predictions about relative changes in spot and forward prices in response to (a) permanent (current and future) shocks to supply conditions or (b) temporary shocks that affect only current demand or supply are similar to those for a permanent demand shock. The shocks generate relatively larger changes in spot prices than in forward prices when inventory is low, but changes in spot and forward prices are roughly equal when inventory is high. Moreover, when inventory is high, the theory again predicts roughly equal changes in spot and forward prices in response to shocks that affect only future demand or supply. When inventory is low, however, shocks to future demand or supply cause larger changes in forward prices than in the current spot price. We assume throughout that, for the metals, shocks that affect only future demand or supply are rare relative to (a) permanent shocks to both current and future demand or supply and (b) temporary current shocks. We recognize that the assumption would be questionable for agricultural products where information about future supply-harvests-is more important. Our analysis refines Samuelson's [ 5 ] hypothesis about the relative variation of spot and forward prices. In essence, he shows that, if (a) the forward price is the expected spot price and (b) the spot price is a stationary (mean-reverting) process, then forward prices vary less than spot prices, and the variation of forward prices is a decreasing function of maturity. The theory of storage leads us to the hypothesis that the relative variation of spot and forward prices is also a function of inventory. The tracks of the Samuelson hypothesis that forward prices vary less than spot prices are likely to be more identifiable when inventory is low.
Business Cycles and Metals Prices
1079
11. Data
The data include daily observations from the London Metals Exchange (LME) on spot and three-month forward prices for aluminum, cooper, lead, tin, and zinc and spot, three-, six-, and twelve-month forward prices for silver. The sample also includes futures prices for copper and gold from the New York Commodity Exchange (Comex) and futures prices for platinum from the New York Mercantile Exchange (NYM). The futures prices are for maturities to twelve months. Prices are available from 1972 to 1983 for all commodities except aluminum, which begins in 1979, and gold futures, which being in 1975. The LME data have two advantages. First, there are no limits on LME spot and forward price changes. In futures markets, trading stops when price changes hit daily limits. We drop limit days from the futures data because quoted prices are not equilibrium prices. The second advantage of the LME data is that there aer simultaneous spot and forward prices, for fixed forward maturities, every business day. In contrast, a futures contract does not have a fixed maturity. Instead, there is a three- to four-week delivery period at the beginning of the maturity month. Also, good spot price quotes for the close of futures trading are not available. We use futures prices on maturing contracts as spot prices. For example, March spot prices are closing prices for contracts that mature in March. This solution to the spot price problem limits sample sizes since futures contracts do not mature every month.
111. Evidence on Demand and Supply Shocks and the Theory of Storage A natural approach would be to test directly the hypotheses about inventory and the variation of spot and forward prices. The metals we study are produced and consumed internationally, however, and the accuracy of data on short-term variation in aggregate inventory is questionable. We use a proxy for inventory suggested by the storage equation (2). When inventory is high, the marginal convenience yield on inventory is low and the interest-adjusted basis is positive. When inventory is low, the convenience yield is high and the interest-adjusted basis is negative. Thus, the sign of the interest-adjusted basis is a proxy for high (+) and low (-) inventory. A. The Variability of the Interest-Adjusted Basis For example, the theory of storage prediction that shocks produce more independent variation in spot and forward prices when inventory is low implies that the interest-adjusted basis is more variable when it is negative. This prediction is confirmed by the standard deviations of daily changes in the interestadjusted basis for the LME industrial metals (Table I). The standard deviations for aluminum, copper, lead, tin, and zinc are at least forty-five percent larger when the interest-adjusted basis is negative. F-tests (not shown) for the industrial
Table I
Standard Deviations of Daily Changes in the Interest-Adjusted Basis and Averages of Daily Values
of the Interest-Adjusted Basisa
Industrial Metals Positive
Precious Metals
Negative
All
Positive
Part A: Standard Deviations of Daily Changes in the Interest-Adjusted Basis Aluminum Copper Lead Tin Zinc Copper Copper Copper
3 Mo Fwd 3 Mo Fwd 3 Mo Fwd 3 Mo Fwd 3 Mo Fwd 3 Mo Fut 6 Mo Fut 12 Mo Fut
0.52 0.41 0.55 0.56 0.63
0.79 0.59 0.68 0.57 0.89
0.44 0.41 0.54
0.73 0.66 0.72
Gold Gold Gold
3 Mo Fut 6 Mo Fut 12 Mo Fut
Platinum Platinum Platinum
3 Mo Fut 6 Mo Fut 12 Mo Fut
Silver Silver Silver
3 Mo Fwd 6 Mo Fwd 12 Mo Fwd
Negative
All
Part B: Averages of Daily Values of the Interest-Adjusted Basis Aluminum Copper Lead Tin Zinc Copper Copper Copper
3 Mo Fwd 3 Mo Fwd 3 Mo Fwd 3 Mo Fwd 3 Mo Fwd 3 Mo Fut 6 Mo Fut 12 Mo Fut
Gold Gold Gold
3 Mo Fut 6 Mo Fut 12 Mo Fut
0.23 0.57 1.03
Platinum Platinum Platinum
3 Mo Fut 6 Mo Fut 12 Mo Fut
0.78 1.26 1.66
Silver Silver Silver
3 Mo Fwd 6 Mo Fwd 12 Mo Fwd
0.28 0.47 0.79 -
" Statistics are for all days (All), days when the interest-adjusted basis is positive, and days when the interest-adjusted basis is negative. Spot and three-month forward prices for aluminum, copper, lead, tin, and zinc, and spot, three-, six-, and twelvemonth forward prices for silver are from the London Metals Exchange (LME). The LME spot and forward prices are not subject to limits on daily changes. Futures prices for copper and gold are from the New York Commodity Exchange (Comex), and futures prices for platinum are from the New York Mercantile Exchange (NYM). The sample period is 1972 to 1983 for all commodities except aluminum, which begins in 1979, and gold, which begins in 1975. To put all prices in the same units, LME spot and forward prices are translated into dollars using spot and forward dollar/pound exchange rates (from the Federal Reserve Bank of New York, Data Resources, Inc., and International Monetary Market Exchange yearbooks). Spot and threemonth forward exchange rates are available for the 1972 to 1983sample period. The six- and twelve-month forward rates needed to translate six- and twelve-month LME forward prices for silver into dollars are not available until June 1973. The interestadjusted basis is a percentage of the spot price. Interest rates in the interest-adjusted basis are yields on U.S. Treasury bills, from the Federal Reserve Bank of New York. Metals prices are from Data Resources, Inc., Comex and NYM year books, the Wall Street Journal, and the Financial Times of London. Sample sizes are in Table 11.
1082
T h e Journal of Finance
metals reject the hypothesis that the variance of the interest-adjusted basis does not depend on its sign at the 0.995 probability level. The evidence for the precious metals is weaker. The standard deviations of the interest-adjusted basis for silver and platinum are only slightly larger when the interest-adjusted basis is negative. The interest-adjusted basis for gold is slightly more variable when it is positive than when it is negative. The precious metals produce weak results in all the tests. We leave the explanation until later.
B. T h e Relative Variability of Spot and Forward Prices The theory of storage and the assumed shape of the convenience-yield function in Figure 1predict that demand and supply shocks produce roughly equal changes in spot and forward prices when the interest-adjusted basis is positive (inventory is high), but shocks cause spot prices to change more than forward prices when the interest-adjusted basis is negative (inventory is low). This prediction is confirmed by the ratios of the standard deviation of daily percent forward price changes to the standard deviation of percent spot price changes for the LME industrial metals in Table 11. The ratios for aluminum, copper, lead, tin, and zinc are close to 1.0 (0.96 or greater) when the interest-adjusted basis is positive. The ratios are lower, from 0.78 (aluminum) to 0.91 (lead), when the interest-adjusted basis is negative. When the interest-adjusted basis is positive, the variances of spot price changes and three-month forward price changes for the industrial metals are never reliably different at the 0.95 probability level. The variances of spot and three-month forward price changes are always reliably different at the 0.99 probability level when the interest-adjusted basis is negative. The theory of storage also predicts that demand and supply shocks produce larger changes in near-term expected spot prices than in more distant expected spot prices because the shocks are progressively offset by demand and supply responses. The ratios of the standard deviation of futures price changes to the standard deviation of spot price changes for copper (the only industrial metal with more than one maturity) are roughly consistent with this prediction. The ratios for positive interest-adjusted bases fall from 1.02 at three months to 0.97 at six months and 0.92 at twelve months. The ratios for negative interest-adjusted bases are 0.92,0.93, and 0.85. The twelve-month ratios are reliably different from 1.0 at the 0.95 probability level. This evidence is consistent with Samuelson's [5] general proposition that the difference between the variability of spot and futures prices increases with the maturity of the futures price.
C. T h e Response of Forward Prices to Changes i n Spot Prices The theory of storage and the shape of the convenience-yield function in Figure 1 imply a more precise prediction about the response of spot and forward prices to demand and supply shocks. Consider the regression of the percent change in the forward price on the percent change in the spot price:
Table I1
Ratios of the Standard Deviation of Daily Forward (or Futures) Price Changes to the Standard Deviation of Daily Spot Price Changesa Industrial Metals Positive
Precious Metals Negative
All
Positive
Negative
All
Part A: Ratios of Forward Standard Deviation to Spot Standard Deviation Aluminum Copper Lead Tin Zinc Copper Copper Copper
3 Mo Fwd 3 Mo Fwd 3 Mo Fwd 3 Mo Fwd 3 Mo Fwd 3 Mo Fut 6 Mo Fut 12 Mo Fut
0.98 0.98 0.96 1.01 0.96
0.78* 0.88* 0.91* 0.86* 0.86*
0.88 0.92 0.92 0.86
0.89
Gold Gold Gold
3 Mo Fut 6 Mo Fut 12 Mo Fut
1.00 0.99 0.99
1.00
1.00
0.99
Platinum Platinum Platinum
3 Mo Fut 6 Mo Fut 12 Mo Fut
0.95 0.97 0.93
0.97
0.97
0.94
1.02 0.97 0.92**
0.92* 0.93* 0.85*
0.98 0.95
0.88 Silver Silver Silver
3 Mo Fwd 6 Mo Fwd 12 Mo Fwd
1.00 0.99 0.97
1.00
0.99 0.97
Part B: Number of Observations Aluminum Copper Lead Tin Zinc Copper Copper Copper
3 Mo Fwd 3 Mo Fwd 3 Mo Fwd 3 Mo Fwd 3 Mo Fwd 3 Mo Fut 6 Mo Fut 12 Mo Fut
689 1596 1215 91 1570
460 1222 1603 2727 1248
262 522 529
97 176 390
1149 2818 2818 2818 2818
Gold Gold Gold
3 Mo Fut 6 Mo Fut 12 Mo Fut
217 398 435
394 446 313
611 844 748
Platinum Platinum 359 Platinum 698 919 Silver Silver Silver
3 Mo Fut 6 Mo Fut 12 Mo Fut
243 233 48
208 219 178
451 452 226
3 Mo Fwd 6 Mo Fwd 12 Mo Fwd
1647 1513 1364
1176 982 1119
2823 2495 2483
"Statistics are for all days (All), days when the interest-adjusted basis is positive, and days when the interestadjusted basis is negative. Spot and three-month forward prices for aluminum, copper, lead, tin, and zinc, and spot, three-, six-, and twelve-month forward prices for silver are from the London Metals Exchange (LME). The LME spot and forward prices are not subject to limits on daily changes. Futures prices for copper and gold are from the New York Commodity Exchange (Comex), and futures prices for platinum are from the New York Mercantile Exchange (NYM). The sample period is 1972 to 1983 for all commodities except aluminum, which begins in 1979, and gold, which begins in 1975. To put all prices in the same units, LME spot and forward prices are translated into dollars using spot and forward dollar/pound exchange rates. Spot and three-month forward exchange rates are available for the 1972 to 1983 sample period. The six- and twelve-month forward rates needed to translate six- and twelve-month LME forward prices for silver into dollars are not available until June 1973. *, ** An F-test rejects the hypothesis that the variances of daily spot and forward price changes are equal a t the 0.95 (*) or 0.99 (**) probability level.
1084
The Journal of Finance
At high inventory levels, the marginal convenience yield in (2) is not sensitive to changes in inventory. Large inventory responses mean that shocks produce roughly equal changes in current and expected spot prices. The slope b in (3) is close to 1.0. At lower inventory levels, the convenience-yield function is steeper. Smaller inventory responses mean that shocks have a larger effect on the current spot price than on expected spot prices. Changes in the spot price are associated with less than one-for-one changes in the expected spot prices in forward prices because the market forecasts future production and demand responses to the shock. If we use the sign of the interest-adjusted basis to proxy for high and low inventory, the slope b in (3) should be smaller when the interest-adjusted basis is negative. The slopes for the LME industrial metals in Table I11 confirm this prediction. When the interest-adjusted basis is positive, the slopes range from 0.95 (lead and zinc) to 1.00 (tin). Moreover, spot and forward prices move almost in lock step; the regression R 2 ranges from 0.96 to 0.99. In contrast, when the interest-adjusted basis is negative, the slopes are much lower, ranging from 0.69 (aluminum) to 0.86 (lead). There is also more independent variation in spot and forward prices; the regression R 2 ranges from 0.77 to 0.92. The slope when the interest-adjusted basis is negative is always at least 5.0 standard errors smaller than when the interest-adjusted basis is positive. The behavior of spot and forward prices for the LME industrial metals is consistent with the theory of storage prediction that expected spot prices change roughly one for one with the current spot price when inventory is high, but expected spot prices move less than the current spot price when inventory is low. The theory of storage also predicts that shocks have less impact on longer maturity futures prices because demand and supply responses are larger for longer planning horizons. Thus, the slopes in (3) should be lower for longer maturity futures prices. The regressions for copper are roughly consistent with this prediction. The slopes when the interest-adjusted basis is positive fall from 1.00 at three months to 0.95 at six months and 0.90 at twelve months, and the six- and twelve-month slops are more than 5.0 standard errors from 1.0. The slopes when the interest-adjusted basis is negative are 0.83, 0.88, and 0.78.
D. The Precious Metals The regressions for the precious metals in Table I11 are less support for the theory of storage. Slopes and R2 in (3) for gold, platinum, and silver are close to 1.0, and they are not consistently lower when the interest-adjusted basis is negative. Likewise, spot prices for gold, platinum, and silver are not consistently more variable than futures (or forward) prices when the interest-adjusted basis is negative (Table 11), and the basis itself is about as variable when it is positive as when it is negative (Table I). A simple explanation is that storage costs for the precious metals that are low relative to value, and the demand for gold and silver as investment assets, lead to inventories sufficient to limit variation in convenience yields and thus in the interest-adjusted basis. The averages and standard deviations of the interestadjusted basis in Table I are consistent with this view. Differences between
'11 aIqe& u! ale saz!s a[dwes ' 8 ~ 6 1aunp 1!qun a[qel!eAe lou ale s l e ~ ~ ooqu! p laAl!s 103 sa3!1d p l e m o ~3 N 7 q'$uow-a~[amlpue -x!s alepueq 0%papaau sales p ~ e m oqj l u o w - a ~ ~ a m PUB l -X!S aq& 'popad a[dwes ~861037.~61aq? 103 a[qeI!eAe ale sales a2ueq3xa plemoj qluow-aa~qlpue lads .sale1 aSueq3xa punod/~el[oppIemoj PUB lads Bu!sn s~e[[opolu! palepuexl 7 awes aql u! sa3!1d [le lnd o& ' 9 ~ 6 1U! su!Saq q3!qm 'p1oS pue ' 6 ~ 6 1U! ale s a g ~ dplemoj pue lods 3 ~ 'sl!un supaq q3!qm 'wnu!wnle lda3xa sa!ypowmo3 118103 E86107 ~ ~ S! po!md 6 1 a[dwes aq& '(WAN)a%ueq3x3al!%ue31a~ y ~ MaN o aql ~ moq axe wnu!le[d 103 sa3!1d salnlnj pue '(xamo3) a%ueq3xxK$rpomuro3 y ~ o n maN aq? WOIJ axe plo% 7 .(3~7) pue laddo3 ~ osa3!1d j salnqnj .sa%ueq3L[!ep uo sq!ur![ ol pacqns lou axe sa3!1d plemoj pue lods 3 ~ aq& a%ueq3x3s [ e l a ~ yuopuo7 aql w o ~axe j I a q s 103 sa+d plemoj q?uow-a~~aml pue '-x!s '-aa~ql'lods pue '3u!z pue 'u!l 'peal '1addo3 'wnu!wnle 103 sa3!1d p ~ e m o qluom-aa~ql j p ue lads .a~!leSau s! s!seq palsncpe-lsala?~!aql uaqm sKep JOJ pue 'a~!q!sod s! s!seq pqsnfpe-lsa~alu!aql uaqm sKep lo3 '(11~)sKep Ile 103 palew!lsa ale suo!ssa~Sq, L6.0 86'0 66'0
€00'0 EOWO Z00'0
€96'0 9L6'0 P66'0
L6'0 86'0 66'0
900'0 POW0 EOO'O
896'0 8L6'0 966'0
L6'0 86'0 66'0
POW0 POOO ' Z00'0
FPK0 PL6'0 Z66'0
PMdONZ1 PMdON9 PMJONE
€6'0 96'0 96'0
L10'O 010'0 010'0
E06'0 8P6'0 096'0
E6'0 96'0 P6'0
810'0 P1O'O L10'O
€06'0 LP6'0 PZ6'0
16'0 96'0 L6'0
IPO'O 910.0 Z10'0
006'0 196'0 Z86'0
InJ ON ZI I n J ON 9 I n J ON E
86'0 66'0 00'1
900'0 €00'0 Z00'0
8L6'0 966'0 Z00'I
86'0 66'0 00'1
LOW0 POW0 €00'0
8L6'0 86'0 LOO'O 66'0 900'0 166'0 00'1 €00'1 POOO ' s1eqaN snopaxd
6L6'0 666'0 666'0
lnJoNZ1 lndoN9 lnd ON E
PI"3 PI03 PI03
88'0 €6'0 06'0
010'0 600'0 910'0
9Z8'0 616'0 9Z6'0
98'0 88'0 18'0
LIO'O PZO'O 1P0'O
Z8L'O 9L8'0 EE8'0
96'0 L6'0 96'0
600'0 800'0 ZI0'0
968'0 Z96'0 000'1
lnd ON Z1 I n J ON 9 I n J ON €
"add03 1addo3 1addo3
06'0 Z8'0 E6'0 P6'0 L8'0
900'0 LOO'O 900'0 POO.0 600'0
PP8'0 Z8L'O 068'0 888'0 ZZ8'0
88'0 28'0 16'0 Z6'0 LL'O
800'0 LOO'O LOW0 LOW0 810'0
908'0 LLL'O €98'0 6P8'0 L89'0
L6'0 96'0 L6.0 86'0 66'0
P00'0 OZO'O POW0 €00'0 POOO '
9P6'0 L66'0 6P6'0 696'0 OL6'0
PMJ ON E PMJ ON E PMdON€ PMd ON E PMJ ON E
mA1!S Ja"l!S nAl!S ""U!leld mnu!leId mnu!leld
3U!Z U!& Pea7 1addo3 mnU!mnlV
Slelam le!=?snpur Ztr
(q)s
IlV
q
z
(q)s
q
z
aa!leZa~
(q)s
q
ai\!q!sod
(?)a + [(r - ?)s/(?)s~uI q + w = [(T - J , 'T.- ?)JILL '?)BIuI .:saa!rd yods u! saSuey3 61pa s n o a u ~ ~ o d n r a ~ u o ~ uo saa!rd salnynd ro pJeMJod u! saSuey3 K1!ea 30 suo!ssa.G+!a~ I11 alq'u
1086
T h e Journal of Finance
average positive and average negative three-month interest-adjusted bases are all greater than 3.0 percent for the industrial metals. In contrast, average positive and negative three-month interest-adjusted bases for gold and silver differ by only 0.57 percent and 0.67 percent, and the difference for platinum is 1.99 percent. The standard deviation of daily changes in the three-month interestadjusted basis for gold for all days is less than one sixth that of any industrial metal. The three-month interest-adjusted basis for silver is about half as variable as those for the industrial metals. Thus, at least for gold and silver, there is less variation in convenience yields to be explained than for the industrial metals. The Table I11 regressions do provide some evidence that spot price changes for platinum and silver are not entirely permanent. If progressive production and consumption responses partly offset demand and supply shocks, the slopes in (3) should be smaller for longer maturity futures prices. The slopes for silver range from 1.00 at three months to about 0.95 (about ten standard errors from 1.0) at twelve months. The slopes for platinum drop from 0.95 at three months to 0.90 at twelve months. (All are at least 4.0 standard errors from 1.0.) Based on the point estimates, on average 95.0 percent and 90.0 percent of the changes in silver and platinum spot prices are permanent in the sense that they show up as changes in expected spot prices in twelve-month forward and futures prices.
E. Forward Prices and Forecast Power The slopes in (3) for the industrial metals indicate that forward prices respond less than spot prices to demand and supply shocks when the interest-adjusted basis is negative. We interpret this as evidence that, when inventory is low, the market forecasts that only part of a current spot price change shows up in expected spot prices in forward prices. It is interesting to test whether these market forecasts of future spot prices, inferred from contemporaneous changes in spot and forward prices, are rational (unbiased). Our attempts to test the rationality of market forecasts of spot prices have failed. The problem is familiar: variances of unexpected spot price changes are so large relative to variances of expected changes that we are unable reliably to extract expected changes from observed changes. (See Fama and French [3] for some details.) Thus, we are able to identify variation in forward prices due to market forecasts of spot prices, but we lack tests with power to infer whether the forecasts are rational.
IV. Price Inversions and the Business Cycle Tables I to I11 are consistent with theory-of-storage predictions about (a) the variation of the interest-adjusted basis and (b) the relative variation of spot and forward prices as a function of the level of inventory. This section describes how the price behavior that produces these results relates to the business cycles of the 1973 to 1982 sample period.
A. T h e Behavior of Spot Prices Table IV summarizes the behavior of spot prices around the business-cycle peaks, identified by the National Bureau of Economic Research as November
Table IV
Relative Spot Prices around 1973-1974 and 1979-1980 Business-Cycle Peaksa
1/3/72
1/2/73
11/1/73
Part A Maximum (Date)
7/1/74
1/2/75
6/2/75
1.97 2.26 2.31 2.84
1.17 2.24 1.97 1.89
1.17
1.42
1.90
1.96
3.23 1.79 3.41
3.94 1.53 3.23
3.66 1.46 3.23
5/1/80
7/1/82
12/1/82
1.49 1.57 1.20 1.45 1.22
0.74 1.03 0.79 0.98 1.30
0.77
1.16
0.67
0.98
1.27
3.00 3.64 2.47
1.83 1.38 1.18
2.53
2.12
2.08
Industrial Metals Copper Lead Tin Zinc
1.00 1.00 1.00 1.00
1.00 1.29 1.05 1.01
2.02 1.96 1.52 3.47
3.20 3.22 2.73 5.67
Gold Platinum Silver
1.00 1.00 1.00
1.48 1.34 1.48
2.20 1.56 2.06
1/3/78
1/2/79
9/4/79
Aluminum Copper Lead Tin Zinc
1.00 1.00 1.00 1.00
1.00 1.22 1.35 1.17 1.28
1.25 1.66 1.86 1.27 1.29
Gold Platinum Silver
1.00 1.00 1.00
1.29 1.79 1.25
1.87 3.29 2.25
(411174) (516174) (516174) (516174)
Precious Metals 4.06 (413174) 2.38 (413174) 4.94 (2126174) Part B Maximum (Date)
2. 0,
0,
'3
5 -
Industrial Metals 1.76 (2/11/80) 2.46 (2/11/80) 2.03 (9127179) 1.55 (3/6/80) 1.69 (2/15/80)
2
R
&
Precious Metals 4.81 (1/21/80) 4.77 (1/17/80) 10.17 (1/18/80)
" Spot prices for each metal in Part A are divided by the spot price on January 3,1972. Except for aluminum, the spot prices in Part B are divided by the spot price on January 3, 1978. The prices for aluminum are divided by the spot price on January 2, 1979. The maximum relative price is the highest closing price between November 1, 1973, and April 4, 1974, in Part A and between September 4, 1979, and May 1,1980, in Part B. Since platinum has only four maturing contracts each year, prices are reported for the following dates: 1/2/74, not 11/1/73; 10/1/79, not 9/4/79; 7/1/80, not 5/1/80; and 1/4/83, not 12/1/82. The spot prices for gold before 1975 are from Handy and Harmon.
CL
0
00
4
Table V
Average Values of Daily Interest-Adjusted Bases (Percent for Periods around 1973-1974 and 1979-1980 Business-Cycle Peaksa 1/72-12/72
1/73-10/73
11/73-6/74
Minimum (Mo.)
7/74-5/75
6/75-12/77
Industrial Metals Copper Lead Tin Zinc Copper Copper Copper
3 Mo Fwd 3 Mo Fwd 3 MoFwd 3 Mo Fwd 3 Mo Fut 6 Mo Fut 12 Mo Fut
0.38 -0.69 -1.11 0.38
-3.93 -1.03 -3.02 -2.93
-8.61 -1.99 -5.06 -10.66
-14.80 -8.99 -14.93 -14.95
(7312) (7501) (7409) (7402)
0.36 -5.07 -4.08 -4.22
0.96 1.31 1.22
-11.56 -6.51 -16.30
-18.22 -15.51 -26.41
-18.22 (7312) -19.06 (7309) -32.73 (7312)
0.87 0.96 1.91
0.52 1.46 2.42
0.87 1.51
0.01 0.19 0.03
0.07 (7201) 0.31 (7201)
1.45 2.28
0.62 1.14
-0.50 (7402) -1.19 (7402) -3.07 (7402)
-0.04 -0.01 0.09
0.02 0.20 0.56
0.61
0.48
-1.35
0.27
Precious Metals Gold Gold Gold Platinum Platinum Silver Silver Silver
3 Mo Fut 6 Mo Fut 12 Mo Fut 3 Mo Fut 6 Mo Fut
0.35 0.38
3 Mo Fwd 6 Mo Fwd 12 Mo Fwd
0.02
1.16 1.85 -0.05 -0.05 -0.53
0.75 1.12 -0.17 -0.68 -2.14
1178-12/78
1179-8/79
9179-4/80
Industrial Metals Aluminum Copper Lead Tin Zinc Copper Copper Copper
3 Mo Fwd 3 Mo Fwd 3 Mo Fwd 3 Mo Fwd 3 Mo Fwd 3 Mo Fut 6 Mo Fut 12 Mo Fut
-3.05 -1.66 -8.52 -5.24 0.33
-6.52
-2.49
-6.28
-5.00
-0.76
-2.42 -6.24
-3.31
-1.76
-8.26
Precious Metals Gold Gold Gold
3 Mo Fut 6 Mo Fut 12 Mo Fut
-0.15 -0.13 -0.08
Platinum Platinum Platinum
3 Mo Fut 6 Mo Fut 12 Mo Fut
-2.83 -4.84 -8.94
-1.10
-2.34
-5.90
Silver Silver Silver
3 Mo Fwd 6 Mo Fwd 12 Mo Fwd
-0.21 -0.64 -2.13
-0.98
-2.48
-5.96
0.14
1.23
2.43
Minimum (Mo.)
5180-12/80
1181-12/83
1090
T h e Journal of Finance
1973 and January 1980. There are large increases in the prices of all metals before the business-cycle peak of January 1980 and large declines thereafter. Gold and platinum prices grow to almost five times their January 1978 values and then fall by July 1982, gold to about forty percent and platinum to about thirty percent of peak values. Copper and lead prices double their January 1978 values and then fall to about forty percent of their peaks by July 1982. Silver has the largest price swing in the 1978-1982 period. The closing spot price on January 18, 1980 is more than ten times the price on January 3,1978. From January 18, 1980 to July 1, 1982, the spot price falls almost to its January 1978 value. There are similar price swings around the business-cycle peak of November 1973. All prices rise from January 1972 to November 1973, peak during the first half of 1974, and fall thereafter. The price of gold quadruples from January 3, 1972 to April 3, 1974 and then falls twenty percent from April to July. Silver peaks on February 26, 1974, a t about five times its January 1972 price, before falling to seventy percent of its peak value on July 1, 1974. Copper, lead, and tin peak at about three times their January 1972 values in April and May 1974 and then fall between fifteen percent and forty percent by July 1974. Zinc has the biggest price swing, peaking on May 6, 1974, at almost six times its January 1972 value, and then falling about fifty percent by July 1, 1974.
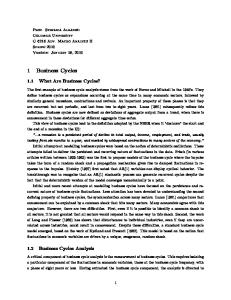
B. T h e Behavior of the Interest-Adjusted Basis The theory of storage and the pro-cyclical behavior of spot prices suggest that positive demand shocks near a business-cycle peak reduce inventories, raise convenience yields, and generate negative interest-adjusted bases. Table V shows that three-month interest-adjusted bases for the industrial metals, aluminum, copper, lead, tin, and zinc, are typically negative during both 1973-1974 and 1979-1980. The most extreme negative interest-adjusted bases tend to occur near the business-cycle peaks, November 1973 and January 1980. The plot of the three-month interest-adjusted basis for copper in Figure 2 (plots for other industrial metals are similar) shows that, during the 1973-1974 and 1979-1980 periods when the interest-adjusted basis is negative, it is persistently negative. This suggests that production does not adjust quickly to positive demand shocks around business-cycle peaks. The large price swings for the metals (and the demand for forward and futures markets) also suggest industries in which production does not adjust quickly to shocks. The periods around business-cycle peaks when interest-adjusted bases for the industrial metals are negative are the periods for which the regressions in Table I11 indicate that forward prices vary less than one for one with spot prices. Since spot price changes are on balance strongly positive during these periods, the market is apparently forecasting that the increases are in part temporary, to be reversed by future production and demand responses. Except for tin, there are also periods, for example, June 1975 to January 1978 and January 1981 to December 1983, when interest-adjusted bases for the industrial metals are typically positive or close to 0.0, implying that inventories are relatively high. These are the periods for which the Table I11 regressions indicate that changes in spot prices are mostly permanent: changes in spot prices on average show up one for one in forward prices.
1091
Business Cycles and Metals Prices
I 72
~ 73
~ 74
l
' 75
~
l 76
~ 77
~
l 78
'
'
l
79
~ 80
' 81
l
~ 82
'
l
83
Figure 2. Interest-Adjusted Basis for Copper
C. A Squeeze in Silver? Some claim that negative interest-adjusted bases (Table V) and the large spot price swing for silver in 1979 and 1980 (Table IV) are evidence of a squeeze. In a squeeze, colluding traders secretly take long nearby futures positions that exceed deliverable supply. As contract maturities approach and the market becomes aware of the squeeze, spot and nearby futures prices rise. Because the squeeze is temporary, there is an "inversion" of futures-spot relations; longer maturity futures prices are not sufficient to cover interest carrying costs. When the squeeze is over, the spot price falls and "normal" futures-spot relations return. Although the price swing for silver in 1979 and 1980 is dramatic, it is not unique. Table IV shows that such swings are common for metals prices around both the November 1973 and January 1980 business-cycle peaks. The inversions of forward-spot relations in Table V are also not unique to silver or the 19791980 period. Inversions of forward-spot relations are similar for silver and platinum (both precious metals) and generally smaller for silver than for the industrial metals. During the September 1979 to April 1980period, which includes the purported squeeze, the negative three-, six-, and 12-month interest-adjusted bases for silver are within 0.14 percent of those for platinum. The average value of the three-month interest-adjusted basis for silver from September 1979 to April 1980 is -0.98 percent. Among the industrial metals, only the average for
I
~
~
1092
The Journal of Finance
zinc (-0.76) is closer to 0.0 for this period. The averages for three of the five industrial metals are below -5.0 percent. Since we have no direct tests, we cannot infer that there was no squeeze attempt in silver in 1979 and 1980. However, Tables IV and V suggest an alternative explanation for the behavior of silver prices during this period; the large price swing and the inversion of forward-spot price relations reflect the workings of the theory of storage over the business cycle.
V. Conclusions Inventory responses spread the effects of demand and supply shocks between current and expected spot prices. The theory of storage predicts that, when inventory is high, large inventory responses to shocks imply roughly equal changes in current and expected spot prices. Thus, changes in spot prices are largely permanent; they show up one for one in forward prices. When inventory is low, smaller inventory responses mean that current shocks cause larger changes in spot prices than in forward prices. Expected spot prices in forward prices change less because the market forecasts progressive demand and supply responses to shocks. Tests on spot and forward prices for the industrial metals, aluminum, copper, lead, tin, and zinc, confirm these predictions. We use the sign of the interestadjusted basis to proxy for high (+) and low (-) inventory. When inventory is low (the interest-adjusted basis is negative), the interest-adjusted basis is more variable (Table I), spot prices are more variable than forward prices (Table 11), forward prices move less than one for one with changes in spot prices (Table 111), and there is more independent variation in spot and forward prices (Table 111). When inventory is high (the interest-adjusted basis is positive), the interestadjusted basis is less variable, forward prices move roughly one for one with spot prices, and changes in forward and spot prices are almost perfectly correlated. Results for gold, platinum, and silver are weaker. We suggest that low storage costs for the precious metals lead to inventories sufficient to keep convenience yields close to 0.0 and thus to ensure roughly one-for-one variation in spot and forward prices. During our sample period, the variation of spot and forward prices for metals has a strong business-cycle component. There are sharp rises and declines in the prices of all metals around the business-cycle peaks of 1973-1974 and 1979-1980. We suggest that the price rises reflect near-term supply responses that are insufficient to absorb positive demand shocks around business-cycle peaks. The theory of storage then predicts that the demand shocks reduce inventories and generate positive convenience yields and negative interest-adjusted bases. The evidence is consistent with this prediction. Interest-adjusted bases are negative for all metals but gold around the peak of 1979-1980 and for all metals but zinc around the peak of 1973-1974. An interesting future project is to check whether the behavior of prices over the business cycle observed in our sample is characteristic of other periods.
Business Cycles and Metals Prices
1093
REFERENCES 1. R. W. Anderson. "Some Determinants of the Volatility of Futures Prices." Journal of Futures Markets 5 (Fall 1985), 331-48. 2. M. J. Brennan. "The Supply of Storage." American Economic Review 48 (March 1958), 50-72. 3. E. F. Fama and K. R. French. "Commodity Futures Prices: Some Evidence on Forecast Power, Premiums and the Theory of Storage." Journal of Business 60 (January 1987), 55-74. 4. K. R. French. "Detecting Spot Price Forecasts in Futures Prices." Journal of Business 59 (April 1986, Part 2), S39-S54. 5. P. A. Samuelson. "Proof That Properly Anticipated Prices Fluctuate Randomly." Industrial Management Review 6 (Spring 1965), 41-49. 6. L. G. Telser. "Futures Trading and the Storage of Cotton and Wheat." Journal of Political Economy 66 (June 1958), 233-55. 7. H. Working. "The Theory of the Price of Storage." American Economic Review (December 1949), 1254-62.
http://www.jstor.org
LINKED CITATIONS - Page 1 of 2 -
You have printed the following article: Business Cycles and the Behavior of Metals Prices Eugene F. Fama; Kenneth R. French The Journal of Finance, Vol. 43, No. 5. (Dec., 1988), pp. 1075-1093. Stable URL: http://links.jstor.org/sici?sici=0022-1082%28198812%2943%3A5%3C1075%3ABCATBO%3E2.0.CO%3B2-4
This article references the following linked citations. If you are trying to access articles from an off-campus location, you may be required to first logon via your library web site to access JSTOR. Please visit your library's website or contact a librarian to learn about options for remote access to JSTOR.
References 2
The Supply of Storage Michael J. Brennan The American Economic Review, Vol. 48, No. 1. (Mar., 1958), pp. 50-72. Stable URL: http://links.jstor.org/sici?sici=0002-8282%28195803%2948%3A1%3C50%3ATSOS%3E2.0.CO%3B2-P 3
Commodity Futures Prices: Some Evidence on Forecast Power, Premiums, and the Theory of Storage Eugene F. Fama; Kenneth R. French The Journal of Business, Vol. 60, No. 1. (Jan., 1987), pp. 55-73. Stable URL: http://links.jstor.org/sici?sici=0021-9398%28198701%2960%3A1%3C55%3ACFPSEO%3E2.0.CO%3B2-E 4
Detecting Spot Price Forecasts In Futures Prices Kenneth R. French The Journal of Business, Vol. 59, No. 2, Part 2: Futures and Options Markets. (Apr., 1986), pp. S39-S54. Stable URL: http://links.jstor.org/sici?sici=0021-9398%28198604%2959%3A2%3CS39%3ADSPFIF%3E2.0.CO%3B2-Z
NOTE: The reference numbering from the original has been maintained in this citation list.
http://www.jstor.org
LINKED CITATIONS - Page 2 of 2 -
6
Futures Trading and the Storage of Cotton and Wheat Lester G. Telser The Journal of Political Economy, Vol. 66, No. 3. (Jun., 1958), pp. 233-255. Stable URL: http://links.jstor.org/sici?sici=0022-3808%28195806%2966%3A3%3C233%3AFTATSO%3E2.0.CO%3B2-P 7
The Theory of Price of Storage Holbrook Working The American Economic Review, Vol. 39, No. 6. (Dec., 1949), pp. 1254-1262. Stable URL: http://links.jstor.org/sici?sici=0002-8282%28194912%2939%3A6%3C1254%3ATTOPOS%3E2.0.CO%3B2-8
NOTE: The reference numbering from the original has been maintained in this citation list.