By Force of Nature: Explaining the Yield Spread on Catastrophe Bonds
Stephan Dieckmann *
March 1, 2010
Abstract This paper re-examines to which extent catastrophe bond prices can be explained via investor preferences. I show that cat bond spreads equal between two and three times expected losses after controlling for bond-specific characteristics. At the occurrence of Katrina, the model predicts a 1520% increase in the cost of capital of reinsurance companies and plausible degrees of comovement among different perils. The driving force behind the model is a habit process, in that catastrophes are rare economic shocks that could bring investors closer to their subsistence level. Such preferences may also explain why catastrophe bonds offer higher yield spreads compared to equally-rated corporate bonds.
*
Mailing address: Wharton Finance Department, University of Pennsylvania, 3620 Locust Walk, Philadel-
phia, PA 19104-6367, email:
[email protected]. I would like to thank seminar participants at Arizona State University, Barclays Global Investors, Ludwig Maximilians Universitaet, Temple University, Texas A&M University, BI Norwegian School of Management, University of Pennsylvania (the Finance Department and the Insurance and Risk Management Department at the Wharton School), and the Bachelier Finance Society Congress for comments. A special thank you to Frederic Abergel, David Cummins, Burton Hollifield, Morton Lane, Robert Marquez, Michael Melvin, Andreas Richter, Ed Schlee, Kent Smetters, and Mary Weiss for very useful discussions about this topic. Research assistance by Qinqing Wu is greatly appreciated. All shortcomings are my own responsibility.
By Force of Nature: Explaining the Yield Spread on Catastrophe Bonds
Abstract This paper re-examines to which extent catastrophe bond prices can be explained via investor preferences. I show that cat bond spreads equal between two and three times expected losses after controlling for bond-specific characteristics. At the occurrence of Katrina, the model predicts a 1520% increase in the cost of capital of reinsurance companies and plausible degrees of comovement among different perils. The driving force behind the model is a habit process, in that catastrophes are rare economic shocks that could bring investors closer to their subsistence level. Such preferences may also explain why catastrophe bonds offer higher yield spreads compared to equally-rated corporate bonds.
Keywords: Fixed Income, Insurance-Linked Security, Natural Disasters, Katrina, External Habit. JEL Classification: D51, D53, G12, G22.
1
Introduction
The catastrophe bond market is a laboratory allowing one to observe the price of risk for severe natural disasters. Investors might not to be rewarded for such risk above and beyond expected losses if the economic impact of natural disasters was negligible. Those bonds, however, typically securitize mega-catastrophes. For example, only one of the nine outstanding catastrophe bonds covering the Gulf region triggered due to hurricane Katrina. As pointed out by Cummins (2006), Katrina is the most severe natural disaster in the U.S. in terms of economic impact up to date, with a total economic cost between 100 and 200 billion dollars, and we should consider the possibility that catastrophe bonds are subject to some amount of systematic risk. Risk averse investors would therefore require a premium in addition to expected losses, and this paper re-examines the question to which extent catastrophe bond prices can be explained via investor preferences. As the catastrophe (cat) bond market is still a relatively young hybrid market, the first contribution of this paper is to establish some stylized facts prior to moving to the modeling stage. In the year 2005, cat-linked securities cover a variety of natural perils such as windstorms and earthquakes. Bonds linked to windstorm risks securitize events expected to occur roughly once every 40 years, those linked to non-windstorm risks once every 100 years. Four stylized facts stand out while analyzing yield spreads of secondary market prices: First, spreads equal between two and three times expected losses after controlling for several bond-specific characteristics, which is similar in magnitude to the properties discussed in Cummins and Weiss (2009). Second, the term structure of cat bond spreads is moderately upward-sloping. Third, investors appear to require an additional reward for the presence of indemnity triggers (as compared to parametric triggers.) Furthermore, I find that the market price of windstorm risk increased by more than 15% at Katrina. The increase was even stronger for non-windstorm related risk suggesting significant comovement in the market price of cat risks. To my knowledge, Bantwal and Kunreuther (2000) were among the first to point out the difficulties in reconciling cat bond prices with economic fundamentals based on standard investor preferences – the required economic shocks are simply too large. An exception to this would be
1
the economic impact of the 1923 Tokyo Earthquake, but we should not expect a similar magnitude in the case of U.S. demographics. In contrast, time non-separable preferences have become a workhorse in financial economics more recently. Within the family of preferences in which individuals do not measure their felicity with respect to the absolute level of consumption but with respect to a habit level, the specification proposed by Campbell and Cochrane (1999) has been successful in explaining several features of capital markets.1 Motivated by this, I find it relevant to explore to what extent such a preference specification can explain features of the catastrophe bond market. Specifically, I propose an equilibrium model in which individuals face rare events in their consumption process. A convenient way of modeling this is to incorporate Poisson risk as it captures the highly skewed law of motion in natural hazards.2 In addition, my model is also subject to normal economic risk, represented by a Brownian motion. I find that a potential negative shock of 1.9% in economic fundamentals for windstorm risk, and a negative shock of 2.5% for non-windstorm risk, would imply the pre-Katrina levels of cat bond spreads at the steady state. The calibration requires only a small amount of catastrophic risk relative to total economic risk. Specifically, 12% of total quadratic variation corresponds to risks stemming from catastrophes, the remaining 88% correspond to normal economic risk. Although such values are far more reasonable than those required under standard preferences, the magnitude of the shocks suggests that cat bond prices contain a ‘Peso problem’ in that a rare event triggering the market at large has not yet occurred. Given the steady state calibration, I then show different predictions that arise from the model. For example, once I inject an economic shock comparable in size to Katrina, can the model help explain the steep adjustment in the cost of capital along several perils? The prediction is that the market price of catastrophic risk would increase between 15% and 20% at Katrina. I also show that the price of non-windstorm risk would increase greater compared to windstorm risk, simply because the sensitivity of the risk premium increases with a larger impact size, and market participants appear to expect a larger impact size for earthquakes compared to hurricanes. A commonly held view is that economic agents might revise their estimates about the likelihood or impact at the occurrence of a catastrophe, see Born and Viscusi (2006), another source that could 1
This includes the level of the equity premium at various horizons, the excess volatility of the stock market, the
countercyclical nature of the Sharpe ratio, features of the term structure of interest rates as in Wachter (2006), or the uncovered interest rate parity puzzle as in Verdelhan (2008). 2 Several papers argue to incorporate rare events into traditional models in asset pricing, including Rietz (1988), Naik and Lee (1990), and more recently Longstaff and Piazzesi (2004).
2
produce comovement across different perils. While this could of course also matter in the context of Katrina, the purpose of this exercise is to illustrate what effects arise simply due to increased ‘effective’ risk aversion.3 In Zanjani (2002), the cost of capital is an important argument in his model on pricing and allocations in catastrophe insurance. In a setting in which a large loss increases the likelihood of default, he argues that capital costs can have a substantial impact on lines of insurance prices like cat risk. However, the goal of his paper is not to develop an equilibrium model where the cost of capital arises endogenously from economic primitives. From the perspective of a firm, a reinsurance company typically insures a portfolio of different catastrophic risks. Then my model is consistent with the view that a severe loss due to a hurricane will raise a reinsurer’s cost of capital for all insured perils, since risk premia are measured with respect to the same habit level. Hence, my work complements Zanjani (2002) in illustrating the possible economic nature of such capital costs. Another question is, what pricing differences between a cat bond and a corporate bond should we expect? Assuming that corporate bonds are subject to normal economic risk, I also derive the yield spread of a comparable corporate bond as shown in Chen et al. (2009). Holding expected losses constant across both types of bonds, I find that cat bond spreads can indeed be multiples of the equivalent corporate bond spread. For example, at the steady state the model predicts that the corporate bond spread equals 1.5 times expected losses, while the cat bond trades at 3 times expected losses. While it is not surprising that different sources of uncertainty and skewness can generate different spreads under such a preference specification, it is noteworthy that the implied magnitude is close to that observed in the data: In the year 2005, the average yield spread of a cat bond was 2.2 times the spread of a representative corporate bond with equal rating and time to maturity. The model is also consistent with an upward-sloping term structure for a large range of the state space. The actual level of steepness, however, would only be implied for extreme values of the state space, or for large values of mean reversion in surplus consumption. 3
The state variable in such a model would also correlate with cat bond spreads at other times, not only at the
occurrence of Katrina. Secondary market prices, however, are not yet available to compile a long time-series. Swiss Re, for example, provides holding period returns of a cat bond portfolio starting in 2002. Correlating the excess returns with the growth rates of U.S. real personal consumption expenditures between 2002 and 2009 reveals a magnitude larger than .20, which is almost identical to the correlation between consumption and the S&P 500 index for the same time period. While such a correlation is further motivation for the type of model at hand, more data is required to carry out a full time-series test.
3
We should not expect investor preferences to be the only sources for explaining cat bond spreads, as the market is subject to frictions that my model does not capture. For example, Froot (2001) points towards frictions that affect either the supply curve or the demand curve for insurance, such as market power, moral hazard and adverse selection issues, and behavioral factors. In fact, my empirical results lend support for the existence of a moral hazard problem, as investors appear to require an incremental reward of around 100 basis points for facing an indemnity trigger. In a related paper, Finken and Laux (2009) develop some positive theory for parametric (as opposed to indemnity-based) triggers in the cat bond market. The key insight of their model is the absence of an adverse selection problem that can arise among market participants while competing for the insurance premium. Compared to such papers, I completely abstract from differences in information or information gathering, and it is outside of the scope of this paper to explain the size, the existence, or certain contractual features of catastrophe bonds. The paper proceeds as follows. Section 2 presents stylized facts about the catastrophe bond market. Section 3 presents the model of a representative investor who has preferences subject to an external habit process, and faces catastrophic risks in her consumption stream. Section 4 discusses the model’s implications and shows a calibration exercise. I conclude in Section 5.
2
The Cat Bond Market
The cat bond market enables the transfer of cat risk exposure from the seller to the buyer of the bond. The key feature of a cat bond is a provision causing interest and/or principal payments to be lost in the event a specified catastrophe. The bond’s payoff is either linked to an indemnity trigger or to an index trigger. The indemnity trigger represents an actual loss value, whereas an index trigger links to an industry loss index or to a parametric index. Payoff cash flows can take on a step structure depending on the severity of the loss. Consequently, a cat bond might have a probability attached to a first loss, average loss, full loss, or a more complex conditional loss distribution. A cat bond origination typically involves a special purpose vehicle (SPV), and reinsurers are the dominant sponsors. A sponsor enters into a reinsurance contract with an SPV, and the SPV then hedges itself by issuing cat bonds to investors in the capital market. The proceeds from the sale of the securities are invested in high grade securities typically held in a collateral trust, minimizing credit risk in the transaction. Bondholders receive full payment if the stipulated event does not
4
occur. If the catastrophe does occur, however, the SPV makes a payment to the sponsoring company instead.4
2.1
Data
The data set is compiled from three sources. The main source are publications and trade notes by Lane Financial L.L.C. Those publications contain data of secondary market prices obtained from several different vendors, including Goldman Sachs, Lehman Brothers, Aon, and Cochran Caronia. Prices are represented as a yield spread in basispoints (prem); in this case as a per annum spread relative to the interest rate swap market, a typical representation in the interbank market. Spreads are reported end-of-quarter, mid-market, averaged over vendors, and are converted to a 365 days per year convention to make them comparable to an annual measure of expected losses. The same data source contains several bond specific characteristics. Those are merged with cat bond data available in publications by Guy Carpenter and Company L.L.C., and the online deal directory available through Artemis, www.artemis.bm. While merging all three sources I did not find inconsistencies. 1. Expected loss (expl). Expressed on a per annum basis, the expected loss is an estimate typically reported by a modeling agency with expertise in the bond-specific peril(s), the estimate is publicly available to investors through several sources including the bond’s prospectus. 2. Trigger. I classify whether the catastrophe bond is linked to an indemnity trigger or not. Indemnity triggers (indem) are based on the actual dollar loss of an insurer’s portfolio. Nonindemnity triggers represent the family of index triggers, they include parametric, modeled-loss, and industry-loss triggers. 3. Amount (amount). The amount of each bond is given by the face value expressed in million USD, two bonds in this data set are denoted in EUR currency. 4. Age (age) and time to maturity (ttm). Based on each bond’s issue date and maturity date, I construct the variables age and time to maturity, expressed in months. The maturity term is 4
Further background information on the cat bond market is provided by Bantwal and Kunreuther (2000), Cummins
et al. (2004), and Cummins and Weiss (2009).
5
equivalent to the bonds exposure term, i.e. the time period relevant for the bond’s embedded cat insurance claim. 5. Perils. The perils covered in this data set include hurricanes or more general windstorms, earthquakes, mortality risk as well as liability risk. A catastrophe bond can be a single-peril or multi-peril construction. I construct a dummy variable (wind) that equals one in case hurricane or windstorm risk is part of the underlying structure, and zero otherwise. In addition, I construct a dummy variable (multip) that equals one in case the bond is a multi-peril construction, and zero otherwise. 6. Region. The geographic regions in this data set include the United States and subregions, the Northern Atlantic, but also Europe, and Japan. A catastrophe bond can be a single-region or multi-region contract. I construct a dummy variable (multir) that equals one in case the bond is a multi-region structure, and zero otherwise. As an additional control variable, I construct a dummy variable (non-us) that equals one in case U.S. soil is not part of the stipulated region, and zero otherwise. 7. Rating. All catastrophe bonds in the data set have been assigned a rating by at least one of the three rating agencies S&P, Moodys, or Fitch. 8. Conditional loss distribution. The original data sources contain not only information about each bond’s expected loss, but also the probability of a first loss and the probability of the total exhaust of the bond. This allows the decomposition of expected losses into two components, i.e. the likelihood of occurrence of a catastrophe (pfl), and the expected loss given a catastrophe (loss gc) – similar to the separation of the likelihood of default and loss given default in the corporate bond literature. Since the probability of total exhaust is available, I can parameterize a two-point distribution for the loss size given a catastrophe. Suppose the exhaustion of a cat bond corresponds to a loss of 100% with probability (1-p), then the likelihood of a small loss size, κSL , is given by p=1 - probability of total exhaust/pfl; and the small loss size is given by κSL = (loss gc - 1 + p)/p. A requirement for a bond to be included in the data set is that it exists at Katrina’s landfall in August 2005. To keep the cross section of bonds relatively constant I only consider bonds that are alive and prices are recorded within three quarters prior and post to that event. Observations with a ratio of spread over expected losses (prem/expl) larger than 20 are excluded from the data set, 6
as I consider them as outliers. This affects 5 bonds, and could be due to erroneous recording of prices and/or expected losses. The only cat bond that triggered due to the occurrence of Katrina, Kamp Re 2005, is excluded from the data set.
2.2 2.2.1
Stylized Facts Univariate Results
The most basic univariate result shows that cat bond spreads yield on average 4.3 times expected losses, with a median value of 3.8. The average annual likelihood of a catastrophe is 2%, equivalent to an occurrence every 50 years. Given a catastrophe, investors expect to loose 78% of their investment. The average face value of a cat bond equals 58 million, the largest issue size is 300 million. The average age is 25 months, and the average remaining time to maturity is 18 months, which implies a life span between 3 and 4 years. The longest time to maturity observed in the data set is 52 months. These and other descriptive results are summarized in Table 1. A comparison to previous studies is possible based on relative measures like the ratio of spread versus expected losses. Cummins et al. (2004) report an average of 9.1 and median of 6.7 times expected losses for 32 cat bond transactions between 1997 and 2000. Hence, holding everything else constant, cat bond spreads appear to have decreased over the last decade based on the 61 cat bonds observed in 2005 and 2006, as recently confirmed by Cummins and Weiss (2009). The last 4 columns of Table 1 describe the data set along two dimensions. The 28 non-windstorm related bonds (21 earthquake risk, 4 mortality risk, and 3 liability risk) are not linked to any windstorm risk exposure, neither single-peril, nor through a multi-peril portfolio. Those bonds imply spreads equal to 5 times expected losses, versus windstorm risk at 3.8 times expected losses. The two groups also represent catastrophes with significantly different likelihoods, i.e. 2.79% for windstorms catastrophes (approx. once every 40 years) and 1.08% for non-windstorm related events (approx. once every 100 years). Another significant difference occurs with respect to the existence of an indemnity trigger (13 bonds.) Cat bonds linked to an indemnity trigger imply spreads equal to 6.3 times expected losses, compared to the complement at only 3.9 times expected losses.
7
2.2.2
Multiple Regressions
I move beyond the univariate setting and establish some stylized facts based on a multiple regression analysis. Table 2 shows estimation results of six different specifications with robust t-statistics below the point estimate. Expected losses are the by far most important determinant in explaining cat bond spreads, which is not surprising given that they are a measure of a bond’s inherent risk. Although univariate results have shown an average spread equal to 4.3 times expected losses, the simplest specification including an intercept indicates that 86 basispoints might be rewarded absent any risk. Allowing for this, the coefficient estimate on expected losses decreases to 2.54. It is possible, however, that the 86 basispoints represent a reward for additional bond-specific features. Therefore, I test several additional explanatory variables in specifications (2) and (3). First, I test whether the presence of an indemnity trigger is priced in the cat bond market above and beyond expected losses. It is likely that a trigger related to reported losses, thereby closely resembling traditional reinsurance, leads to a moral hazard issue possibly reflected in higher spreads, see Doherty and Richter (2002) or Froot (2001). The counterpart basis risk, of course, could be similarly reflected in cat bonds subject to non-indemnity triggers.5 The finding here is that cat bonds with indemnity triggers reward investors with more than 100 basispoints additional premium. Second, I test whether variables that relate to illiquid market conditions have explanatory power. Adapting hypotheses already tested in the corporate bond market, I follow the suggestions by Edwards et al. (2007) and measure liquidity by age and issue size. Issue size measures the availability of a bond or could serve as a proxy for search costs between buyer and seller, a similar argument can be made for age. I expect that a bond’s age (amount) and is positively (negatively) associated with cat bond spreads because investors require an additional reward for facing potentially illiquid market conditions. The finding is that neither (age) nor (amount) add any consistent explanatory power. 5
Cummins et al. (2004) impose the research question, to what extent the use of index-linked cat loss securities
leave the issuer exposed to basis risk. Based on 255 issuers active in the hurricane insurance market in Florida, their simulation exercise shows that index-linked cat loss securities have a high degree of hedging effectiveness for the largest insurers, though not a perfect hedge.
8
Third, the time to maturity of a cat bond can have explanatory power above and beyond expected losses. On one hand, market illiquidity could serve a channel for a term structure effect combined with investor’s cash flow preferences. On the other hand, the existence of a specific term structure can simply be rooted in the time-varying nature of risk premia. The results in Table 2 show support for an upward-sloping term structure, since the variable (ttm) is important in explaining cat bond spreads above and beyond expected losses. Every month of remaining time to maturity increases the level of spreads between 1.87 and 2.38 basispoints on average.6 In comparison to the simplest setting, the specification (2) leads to an insignificant intercept – suggesting that the presence of an indemnity trigger plus a time-to-maturity effect are important aspects in explaining cat bond spreads above and beyond expected losses. In specification (3), I add a battery of control variables without explicitly deriving hypotheses here. The multiple regressions in (4), (5) and (6) repeat the analysis using the natural logarithm of the premium as a dependent variables. The goal is to explore whether the event of a catastrophe and the uncertain impact given a catastrophe yield separate risk premia. Suppose the true pricing relation for (prem) was given by a function consisting of (expl) and a multiplicative error term. Then substituting (loss gc) times (pfl) for (expl) allows to derive an additive relation using the natural logarithm. I find that the specifications (5) and (6) indeed lend support for the existence of a risk premium related to both variables. Statistical significance, however, is stronger for (pfl) compared to (loss gc). 2.2.3
What Happened at Katrina?
The time period of this study was selected to include the event of hurricane Katrina. Holding the cross-section of bonds constant around the event, I test whether the occurrence of Katrina had a significant impact on the pricing relation in the cat bond market. To test this, I interact expected losses with an indicator variable (post kat) that equals one if the observation corresponds to post-Katrina times, and zero otherwise. By allowing for this shift in slope, I find that cat bond spreads increase from 2.36 times expected losses to 2.78 times expected losses, see Table 3. This adjustment is not only highly statistically significant, but even more so economically. It shows that 6
In comparison, we also have substantial evidence that the term structure of credit spreads is upward-sloping in
the corporate bond market, for investment-grade as well as speculative-grade issuers, see Helwege and Turner (1999) and references therein.
9
the cost of capital to insure a mega-catastrophe, holding other variables constant, has increased by approximately 20% at the occurrence of a Katrina.7 Similar to the specifications (4) - (6) in the general pricing scheme, I separately interact (post kat) with (pfl) and (loss gc). The goal is to examine whether the increase is mainly driven by an additional premium associated with the event likelihood, or it’s severity, or both. Unfortunately, these results do not allow for much additional insight. Table 3 shows that, if at all, the adjustment in spreads is associated with the likelihood of a loss; positive coefficient estimates of (post kat)(pfl) are weakly significant. Another round of tests explores an alternative channel: Since Katrina is a hurricane event, investors might change their perception about the likelihood of windstorm risk by observing such an event – possibly due to learning. Suppose this was the reason for an increase in spreads, then we should not expect a revision in prices linked to non-windstorm risk at the occurrence of Katrina. The results of a test interacting expected losses with an indicator for windstorm risk are shown in Table 4 specification (1). First, I find that non-windstorm risk yields a higher ratio of premium versus expected losses as compared to windstorm risk, confirming univariate results in Table 1. Second, the market price of non-windstorm risk increases at an even larger rate than windstorm risk, i.e. .86 times expected losses versus .49 times expected losses.8 In specification (2), I interact the presence of an indemnity trigger with expected losses, before and after Katrina. As expected, the adjustment in slope is stronger for indemnity triggered bonds, as compared to non-indemnity triggered bonds, confirming the results of the test that employ the indicator (indem) only. This suggests that reported losses due to Katrina could be the reason for higher spreads. However, I also isolate the effect of Katrina on non-indemnity and non-windstorm cat bonds since accruing losses due to Katrina can only occur in the category of windstorm-linked cat bonds. The test corresponds to specification (3) in Table 4, showing that the Katrina effect 7
The finding is robust while allowing for an adjustment in the pricing relation of the other two priced determinants,
(indem) and (ttm). 8 As a second (unreported) test for revision in beliefs, I test whether the cross section of cat bonds issued after Katrina displays different reported expected losses as compared to the cross section existing pre-Katrina. I find that the post-Katrina cat bond market covers windstorm risk for which expected losses are higher as compared to the pre-Katrina market. However, expected losses and event likelihoods are also higher in those bonds securitizing non-windstorm risk. This effect is mainly driven by the Swiss Re Successor program, which securitizes (windstorm and earthquake) risks with significantly higher attachment probabilities for the cat bond market as a whole.
10
on non-indemnity and non-windstorm cat bonds is identical to its complement. Specifically, the premium increases from 2.35 times expected losses to 2.77 times expected losses, an increase in spreads of 17.8%. It seems evident that an upward revision in beliefs and/or accruing losses are not the sole reasons for the increase in spreads at Katrina. Instead, I propose a channel in which an economic loss due to one peril increases the cost of capital across all perils. Suppose a firm insures portfolio of catastrophes. Then the occurrence of an economic shock in one specific peril will affect the price of risk for the portfolio, and thereby also the cost of capital for a seemingly unrelated line of risk. After formally modeling this channel in the next section, I will illustrate what patterns of comovement emerge.
3
The Model
I propose a dynamic equilibrium model and derive asset pricing implications specifically for the market price of catastrophic risk. The goal is to tie the model’s predictions to stylized facts in the catastrophe bond market, and to judge it’s validity with a calibration and perturbation exercise.
3.1
Exogenous Risk and Economic Primitives
Suppose a representative firm is subject to an exogenous dividend which is assumed to follow a random process given by 2
X dCt = µc dt + σc dB + κci dN (λi ) Ct−
t ∈ [0, ∞).
(1)
i=1
This dividend process is subject to multiple sources of uncertainty. First, regular economic risk enters through a standard Brownian motion B with a volatility parameter σc > 0, as typical in the continuous-time formulation of an exchange economy. Second, the economy is subject to two separate sources of catastrophic risk, i.e. windstorm risk and earthquake risk (or more generally non-windstorm risk.) Windstorm risk enters through a Poisson process with arrival intensity λ1 and impact size κc1 , non-windstorm risk enters through a Poisson process with arrival intensity λ2 and impact size κc2 . I assume all arrival intensities to be positive, no common occurrences among windstorm risk and non-windstorm risk, and impact sizes to be in the interval (−1, 0) to ensure that the dividend process remains positive. The deterministic growth rate of the economy is given by
11
µc . For simplicity, I assume all exogenous parameters to be constant values. For regular economic risk, this appears to be reasonable as time-variation of growth rates and volatility in economic fundamentals is difficult to detect. For natural perils, this assumption allows me to abstract from phenomena like seasonality in windstorm risk, or the evolution of faults and plates in case of earthquake risk. The surprise element of the occurrence of a catastrophe, however, is essential to the model. The assumed process in equation (1) nests a case in which the exogenous dividend is subject to only one type of catastrophic risk, but has a random impact size drawn from an independent two-point distribution. For example, suppose λ = λ1 + λ2 and p = λ1 /λ, then the dividend follows a process given by dCt = µc dt + σc dB + κc dN (λ), Ct−
(2)
and is subject to three sources of uncertainty, i.e. regular economic risk, catastrophic risk with the arrival intensity λ, and a random impact size κc . The impact of a catastrophe can be small with size κc1 and likelihood p, or large with size κc2 and likelihood 1 − p, assuming κc1 > κc2 without loss of generality. The main focus of this section will be the equilibrium characterization corresponding to the formulation in equation (1). However, I will also discuss asset pricing implications for the random impact size for which this mapping will be convenient. The economy is populated by educated and informed investors with external habit formation preferences as in Campbell and Cochrane (1999). This representative investor owns the firm and maximizes expected utility given by ·Z E
∞
0
e
−ρt (Ct
¸ − Xt )1−γ − 1 dt , 1−γ
(3)
where Ct is the investor’s level of consumption, Xt measures the habit level, γ is the risk aversion coefficient, and ρ is the subjective discount factor. As usual, it is convenient to characterize this economy in terms of the surplus consumption ratio defined as St =
C t − Xt , and st = ln(St ). Ct
The surplus consumption ratio has the assumed dynamics given by dst = φ(s − st )dt + θσc dB +
2 X i=1
12
κsi dN (λi ),
(4)
with a central tendency parameter given by s and a reverting rate of φ. While the process of st is standard with respect to normal economic risk as in Campbell and Cochrane (1999), catastrophic risk can also lead to changes in the investor’s (habit and) surplus consumption level. Essential to the solution of this problem is therefore the proper identification of the sensitivity parameters, i.e. θ for the case of normal economic risk, as well as κs1 and κs2 for the case of catastrophic risks. The investor is assumed to face a complete market of financial claims, and consumes the per period dividend in equilibrium. Suppose the state price density process is given by ! Ã 2 2 X X λQ dξt Q i = −rdt + (λi − λi )dt − ηdB + − 1 dN (λi ), ξt− λi i=1
(5)
i=1
Q where r is the riskless interest rate, η is the market price of (normal) economic risk, λQ 1 and λ2
are the risk-adjusted arrival intensities of catastrophic risks, respectively. As usual, the state price density can be found from the investor’s optimality conditions, and the equilibrium will be uniquely determined by comparing the state price density process with the marginal utility process resulting from equation (3), given the solution to the sensitivity parameters.
3.2
Endogenous Risk Premia and Sensitivity Parameters
Straightforward algebra leads to the following equilibrium characterization. The market price of normal economic risk is given by η = γσc (θ + 1),
(6)
which has the same functional form as in Campbell and Cochrane (1999). The addition of catastrophic risk leads to a market price of catastrophic risk given by −γ −γκsi λQ , i = λi (κci + 1) e
(7)
for i = 1, 2. Intuitively, the term e−γκsi not only induces time-variation, it also generates an amplification effect in risk premiums comparable to θ for the case of normal economic risk. The case of standard CRRA preferences is nested in this formulation. Suppose X(t) = 0, then θ and κsi are −γ identically zero, and the standard CRRA risk premiums emerge as η = γσc and λQ i = λi (κci + 1) .
As will be verified later, these are indeed the boundary solutions as the surplus consumption ratio approaches the maximal value of its distribution.
13
The expected value of the surplus consumption ratio converges to a steady-state as t → ∞ because of it’s mean-reverting nature, see Das (2002). Suppose κ bs1 and κ bs2 are the sensitivity parameters for catastrophic risk observed at the steady-state, then sb = s +
κ bs1 λ1 +b κs2 λ2 φ
corresponds to the
steady-state level of the surplus consumption ratio. The equilibrium in Campbell and Cochrane (1999) is derived under three key assumptions, i.e. a constant riskless interest rate, as well as a predetermined habit level at and near the steady-state. With only one source of uncertainty, this leads to three restrictions through which the equilibrium can be uniquely determined in terms of economic primitives. However, adding two sources of uncertainty adds a layer of complexity as outlined below. First, I adopt the assumption of a constant riskless interest rate as in Campbell and Cochrane (1999). The functional form is given by 1 r = ρ + γ(µc − σc2 ) + λ1 − λ1 (κc1 + 1)−γ + λ2 − λ2 (κc2 + 1)−γ + α + β1 + β2 , 2
(8)
where the parameters α, β1 , and β2 represent the degrees of freedom to obtain a constant value of r. Specifically, α will be associated with normal economic risk, β1 and β2 with catastrophic risk, respectively. Second, an equilibrium in this economy can be found by expanding the process of the surplus consumption ratio to dst = [(ν1 + ν2 − 1) + (1 − ν1 ) + (1 − ν2 )]φ(s − st )dt + [...]
(9)
where ν1 and ν2 are constants to be determined endogenously. Intuitively, the three sources of uncertainty can contribute separately (and possibly to a different extent) to the mean-reverting nature of the surplus consumption ratio. The sensitivity value for normal economic risk can be found as in the benchmark case. After solving for the functional form of θ, the values for α and sb are determined by the restrictions θ(b s) = e−bs − 1,
(10)
θ0 (b s) = −e−bs .
(11)
and
The former restriction leads to a predetermined habit level at the steady-state, and the latter to a predetermined habit in close proximity to the steady-state; the solutions for α and sb depend on 14
ν1 and ν2 . The maximal value of the distribution of s can be determined where the habit model collapses to the benchmark case without a habit, θ(smax ) = 0, given by µ ¶ √ γσc 1 γσc2 max √ s = − + ln √ . 2 2(ν1 + ν2 − 1)φ ν1 + ν2 − 1 φ
(12)
What remains to be determined are the sensitivity parameters for catastrophic risks. The functional form of the sensitivity parameter follows from the interest rate restriction, such that κsi solves βi − λi (κi + 1)−γ = (1 − νi )φγ(s − st ) − λi (κci + 1)−γ e−γκsi ,
(13)
for i = 1, 2. I adopt the same notion of predetermination, such that the occurrence of a catastrophe has no instantaneous effect on the habit level at sb, leading to eκsi (bs) = e−bs −
e−bs − 1 . (κci + 1)
(14)
However, I relax the assumption that the habit level is immune to the occurrence of a catastrophe in close proximity to the steady-state. An important gain of this relaxation is that a well-defined distribution can be preserved, where κt,s (b s) does not take on values larger than zero. Therefore, equivalent to equation (12), I assume the economy can be closed by solving for the remaining unknowns via κsi (smax ) = 0.
(15)
It can be shown this leads to a monotone function of κsi (s) taking on negative values only. The discussion and calibration in the next section shows that this relaxation only leads to a small impact of a catastrophe on the habit level in close proximity to the steady-state, and does not affect asset pricing implications to a large extent.
Lemma 1 An equilibrium in this economy exists. The market prices of normal economic risk and catastrophic risks are given by equations (6) and (7), respectively, at the riskless interest rate determined by equation (8). The equilibrium restrictions in equations (10) to (15) lead to the identification of the sensitivity parameters θ and κsi , as well as the parameter values for α, β1 , β2 , ν1 and ν2 . They preserve a distribution of the surplus consumption ratio with a steady-state sb and maximal value smax .
15
Proof of Lemma 1.
Since the habit is external, the investor’s intertemporal rate of substi-
tution equates to the state-price density in the form of ξt = e−ρt e−γs(t) e−γc(t) eγs(0) eγc(0) .
(16)
Applying Ito’s formula allowing for discontinuous innovations yields the process dξt = −ρξt dt − γξt dst + .5γ 2 ξt (dst )2 − γξt dct 2 X 2 2 2 +.5γ ξt (dct ) + γ ξ(dst dct ) + (ξt − ξt− )dN (λi ),
(17)
i=1
where dst corresponds to the continuous innovations of the log surplus consumption ratio, and dct to the continuous innovations of the log dividend. After substitution, the state-price density process yields dξt = −ρξt dt − γξt [φ(s − st ) + θσc dBt ] + .5γ 2 ξt θ2 σc2 dt
(18)
−γξt [(µc − .5σc2 )dt + σc dBt ] + .5γ 2 ξt σc2 dt + γ 2 ξθt σc2 dt 2 X + [(κci + 1)−γ e−γκsi − 1]ξt− dN (λi ), i=1
through which the riskless interest rate, the market price of (normal) economic risk in equation (6), and the market prices of catastrophic risk in equation (7) can be identified. Based on the assumption of a constant interest rate, the functional form of θ can follow from a = (ν1 + ν2 − 1)γφ(s − st ) − .5γ 2 θ2 σc2 − .5γ 2 σc2 − γ 2 θσc2 , which, together with the restrictions (10) and (11) pin down a and s. The implicit habit process can be found using the identity Xt = Ct (1 − St ). In addition to Brownian motion risk, I need to examine the sensitivity of the habit with respect to Poisson risks, i.e. dXt = (1 − St )Ct (µc dt + σc dBt ) − Ct St [(φ(s − st ) + .5θ2 σc2 )dt + θσc dBt ] 2 X + [Ct− (κci + 1)(1 − St− eκsi ) − Ct− (1 − St− )]dN (λi ).
(19)
i=1
If the habit level is immune to the occurrence of a catastrophe at the steady-state, this requires (κci + 1)(1 − est eκsi ) −1=0 (1 − est ) 16
(20)
for i = 1, 2 evaluated at s. For completeness, the equivalent to determine sensitivity around the steady-state is given by κ0si =
−κci e−st . κci e−st + 1
(21)
The latter property, however, is neglected to preserve a distribution for which the process for the surplus-consumption ratio is well-defined at smax . Analytically, κsi (smax ) = 0, simplifies to
σc +
√ √ ν1 +ν2√−1 φκci γ
σc + σc κci
−γ
−
γ(νi − 1)(γσc2 − (ν1 + ν2 − 1)φ)(1 + κci )γ = 1, 2(ν1 + ν2 − 1)λi
(22)
for i = 1, 2. Suppose that µ = ν1 + ν2 − 1, then the solution for νi can be expressed in terms of µ as à ! √ √ −2µ(1 + κci )−γ
1−
νi (µ) =
σc +
µ φκci √ γ
σc +σc κci
γ(µφ−γσc2 )(1+κci )γ 2λi
−
λi .
γ(µφ − γσc2 )
(23)
Upon substitution, an equilibrium follows from a fixed point as given by µ = ν1 (µ) + ν2 (µ) − 1, 2
which has a solution on the interval µ ∈ ( γσφc , 1]. For µ =
γσc2 φ
(24) + ² the difference between the rhs
µ and lhs ν1 (µ) + ν2 (µ) − 1 is strictly negative. It is continuous and increasing in µ with one root satisfying equation (24). At the solution for µ, it is verified that 1 − νi (µ), as given in equation (23), constitutes positive values smaller than one.
4
Calibration and Discussion
The goal of this calibration is fourfold. First, I illustrate what parameter choices are required to explain the level of spreads at the steady state. Second, based on calibrated levels, I will show the prediction on cat bond spread changes once I inject an economic shock comparable in size to Katrina. Third, what term structure effects does the calibrated model imply? Fourth, I will show model-implied differences between the cat bond market and the corporate bond market, and discuss more general properties of the equilibrium, such as the surplus consumption ratio sensitivities and the implied habit process. 17
4.1
Exogenous Parameters
I calibrate the exogenous parameters to U.S. data following Campbell and Cochrane (1999), see Table 6. I assume that the curvature parameter γ has the value 2 and the mean reversion parameter φ has the value .13 for all scenarios. Based on post-war data, I assume that total economic risk has a standard deviation of less than 1.5%. This amount of risk is composed of normal economic risk, as given by σc , and/or catastrophic risks. The reason for fixing an upper bound of total economic risk (measured as the sum of the respective standard deviations) is to not directly appeal to a Peso-problem by adding variation to the system. I assume that σc has a parameter value given by p 1.5% - κ2c1 λ1 + κ2c2 λ2 , which is slightly more conservative than fixing the level of total quadratic variation. I assume the (deterministic) dividend growth rate µc to be 1.89%, another typical value for post-war data. As in Campbell and Cochrane (1999), the subjective discount parameter ρ is used to match a desired riskless interest rate level, in my case 1%. I distinguish among three scenarios, A, B and C. Scenarios A and B are the version of the model in which the economy faces two sources of catastrophic risks, windstorm and non-windstorm risk. In Scenario C, the economy faces one source of catastrophic risk, but the severity of an occurrence is random and can be small or large. Based on the descriptive statistics in Table 1, I choose the arrival intensity for windstorm risk to be 2.79%, and 1.08% for non-windstorm risk. In scenario C, I allow the general arrival intensity to be 2.05%. Consistent with the data, I then assume the probability of a small impact to be 39.4%, corresponding to a loss of 43% in face value to the cat bond holder. To predict the change in spreads at the occurrence of Katrina, I first need to assess the impact of the hurricane on economic fundamentals. Katrina formed on August 23, 2005, and its final landfall as a category 3 storm took place on August 29, 2005. Direct estimates of the total economic cost of Katrina range between 100 and 200 billion dollars. For example, Risk Management Solutions estimates the total economic cost to be 125 billion dollars, which is between 1% and 1.5% of U.S. consumption. One economic channel through which the widespread nature on the aggregate economy can be explained is the destruction of several production technologies in the metropolitan areas of the northern golf coast. The hurricane disrupted oil refining activity and destroyed 10% of its U.S. capacity, such that, according to the Energy Information Administration, the price per
18
barrel of U.S. crude oil peaked in September 2005 with a 12% price increase relative to pre-Katrina levels. Obviously, the economic impact can be larger while measured on a slightly lesser aggregated level. For example, for the two month time period during which the hurricanes Katrina, Rita and Wilma hit U.S. soil, the stock market performance of associated reinsurance companies displays a negative return of 17.3%, compared to a negative return of the DJIA of 1.6%, see Lane (2006) and verified independently. To be conservative and more in line with recent measures corresponding to output or consumption, I will use a -1% shock to the dividend process while perturbing the equilibrium to generate a Katrina prediction.
4.2 4.2.1
Level of Cat Bond Spreads Scenario A
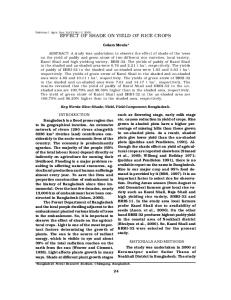
Scenario A is used to calibrate the model to the univariate results. I find that a negative shock of 3.9% for windstorm risk, and a negative shock of 4.45% for non-windstorm risk, implies the observed level of cat bond spreads at the steady-state value of .0811, see Figure 1. The reason that such moderate levels are required to match the data is the amplification effect caused by the habit. Individuals do not measure their felicity with respect to the absolute level of consumption, but with respect to a subsistence level causing a higher degree of effective risk aversion. At the maximal value of the surplus consumption ratio, .1334, the equilibrium nests the case of standard CRRA preferences in which observed spreads can not be explained by such moderate levels of economic shocks. For example, assuming a risk aversion coefficient of 2, a -50% shock to economic fundamentals would be required to generate a ratio of premium versus expected losses of 4. The model also predicts that cat bond spreads can be much larger for states of the economy weaker than the steady-state. For example, to insure the same type of catastrophic risks in a recessional state, the model implies that cat bond spreads can be equal to 10 or even 20 times expected losses. The lower graph of Figure 1 shows the result of the perturbation analysis. For example, the model predicts an increase in the market price of catastrophic risk of 17% for windstorm risk and of 19% for non-windstorm risk at the steady-state, respectively.
19
Why is this increase so steep for a relatively small decrease in the dividend, and why does the market price for non-windstorm risk increase stronger than the equivalent for windstorm risk? An explanation can again be found in the existence of the habit. A shock to fundamentals of -1% brings the investor closer to the habit. Hence, a future catastrophe with negative shock of 3.9% for windstorm risk, or a negative shock of 4.45% for non-windstorm risk, would bring the investor even closer to ruin. As a result, individuals are willing to pay a significantly larger price for insurance against such catastrophes as compared to the pre-Katrina state. A similar argument can be made to explain the difference in market reaction across perils, since 4.45% > 3.9%. To show this formally, suppose the economy is evaluated at the steady-state, then the ratio of risk-adjusted relative to physical catastrophe probabilities changes incrementally by ∂
λQ i λi
∂s
=
γκci (κci + 1)−γ
³
sκ 1+e−b ci κci +1
esb + κci
´−γ < 0.
(25)
However, this effect is weaker for a less negative impact size κci since Q
λ ∂ 2 λii
∂s∂κci 4.2.2
=
γ(κci + 1)−γ
³
sκ 1+e−b ci κci +1
´−γ
(esb + κci )2
(esb − γκci )
> 0.
(26)
Scenario B
Scenario B is used to calibrate the model to results obtained from the multiple regression analysis. What sizes of potential catastrophic shocks to the dividend are required to generate spreads that equal 3 times expected losses for non-windstorm risk, and 2 times expected for windstorm risk? I find that a negative shock of 1.9% for windstorm risk, and a negative shock of 2.5% for nonwindstorm risk, imply the level of cat bond spreads pre-Katrina at the steady-state. Such values also imply that 12% of total quadratic variation corresponds to Poisson risk, where as the remaining 88% correspond to normal economic risk. Given that only a single catastrophe bond triggered due to Katrina, we should expect a potential shock larger than 1% in order to affect the cat bond market as a whole. But since such a catastrophe has not yet occurred, we can only compare the implied values to experts’ predictions. For example, The Mid-America Earthquake Center estimates that a possible earthquake in the Midwest U.S. reaching 7.7 on the Richter scale, due to New Madrid Seismic Zone, could result in economic losses of up to 400 billion USD. According to the U.S. Geological Survey, Southern California plans for
20
a 7.8 earthquake, the San Andreas Fault, with an economic impact between 200 and 240 billion USD. Similarly, the Hayward Fault could affect Northern California with a 7.0 quake by up to 220 billion USD, according to Risk Management Solutions.9 Scenario B predicts the market price of catastrophic risk increases by 18% for windstorm risk at Katrina, and by 22.5% for non-windstorm risk, at the steady-state. The perturbation results for windstorm risk show that this effect is the strongest for values in close proximity to the steady-state. However, in case of non-windstorm risks the model predicts the increase can be even stronger (upto 25%) corresponding to values above the steady-state. 4.2.3
Scenario C
In this scenario, I calibrate cat bond spreads to the two-point distribution of impact sizes. The small (high) impact size corresponds to a cat bond loss of 43% (100%). Based on these values, I find that a small (high) impact size of 2% (3%) can generate a ratio of premium versus expected losses equal to 4 at the steady-state value, see Figure 3. While conditional loss values are expected to be 77% under the physical probabilities, the risk-adjusted expected loss given a catastrophe ranges between 78% and 88%. A decomposition of the total spread into the risk premium associated with the event and the random loss distribution shows that the major part of the total risk premium is due to the former, see the bottom graph. This could explain why the statistical significance found in empirical analysis is indeed stronger for the loading on the event itself, see variable (pfl) versus (loss gc) in Table 2.
4.3
Term Structure of Cat Bond Spreads
The variable (ttm) is important in explaining cat bond spreads. The longest time to maturity present in the data is 52 months, such that the term structure is moderately upward-sloping over a five year horizon. Hence, it is relevant to investigate the predictions of the calibrated model with respect to the term structure. Although there is substantial evidence that the average term structure of credit spreads in the corporate bond market is also upward-sloping, we should not assume the reasons for this are the same as those relevant in the cat bond market. For example, 9
Sources: Impact of Earthquakes on the Central USA, Mid-America Earthquake Center at the University of Illinois
at Champaign-Urbana, Report 2008; 1868 Hayward Earthquake: 140-Year Retrospective, RMS Special Report 2008.
21
leverage is a crucial determinant for the price of debt in the corporate bond market. The SPVs acting as issuing vehicles in the cat bond market, however, have a fixed degree of leverage. I determine the equilibrium value of a synthetic catastrophe bond, and plot the implicit spread above the riskfree interest rate against remaining time to maturity. Formally, the value of a (zerocoupon) catastrophe bond at time t with maturity in T and face value of one unit is given by · ¸ ξT [(1 − I(t,T ) ) + ω(T )I(t,T ) ] , (27) CB(t, T ) = Et ξt where I(t,T ) is an indicator function that equals one if the stipulated catastrophe has occurred between t and T , and zero otherwise. Contingent on a catastrophe, the bond pays a recovery rate of ω(T ) percent at time T . In general, the conditional expectation in equation (27) can be evaluated through simulation under the physical probability measure. However, for this problem it serves to be convenient to evaluate the expression under the risk-adjusted probability measure, see Chen et al. (2009) and Aydemir et al. (2007), such that discounting occurs at the riskfree interest rate. The problem reduces to finding the risk-adjusted likelihood of a catastrophe between t and T via numerical integration. After evaluating CB(t, T ), the implicit spread above the riskfree rate is given by
yCB (T ) = −
ln(CB(t, T )) − r. T −t
(28)
I perform the valuation exercise separately for wind versus non-wind catastrophes, assuming the parameter values in scenario B, plus a recovery rate of 20%, ω(0) = .2.10 The results of this valuation exercise are displayed in Figure 4. The general observation is that for values of the surplus consumption ratio larger than the steady-state (but strictly smaller than the maximal value) the term structure is upward-sloping, whereas it is downward sloping for values 10
To be able to compare this model to a benchmark model without a habit, I assume that the term structure
of cat bond spreads is flat at the maximal value of the surplus consumption ratio. The corresponding benchmark model without a habit does not generate time-variation in risk premiums, and the instantaneous value of λQ i equals λi (κci +1)−γ . A flat term structure over a longer (than instantaneous) horizon can be found with a slight modification of the recovery rate as given by Q
ω(T ) =
e−λ
T
Q
− e−λ (1−ω(0))T . e−λQ T − 1
(29)
Although intuitively appealing, the economic importance of ω(T ) as compared to using a T -invariant recovery rate of 20% is small. The use of ω(T ) implies a slightly decreasing term structure of recovery rates with values between 20% and 19% over a five year horizon.
22
smaller than the steady-state. This is due to the mean reverting tendency of the surplus consumption ratio being reflected in the dynamic process of λQ i . For example, in a realistic range of the surplus consumption ratio between .05 and .085 for which the model implies more reasonable levels of cat bond spreads, the model would also imply an increase in cat bond spreads over a five year horizon of 20 - 30 basispoints for non-wind catastrophes. At high values of the surplus consumption ratio, a steepness level of 40 basispoints (or 60 basispoints or more for wind catastrophes) can also be generated. I conclude that a value of surplus consumption ratio slightly larger than the steady-state value is consistent with a moderately upward-sloping term structure as observed in the data. The actual level of steepness, however, would only be implied for extreme values of the state variable, or for altered values of the mean reversion parameter φ.
4.4
Cat Bonds versus Corporate Bonds
While a cat bond construction should minimize credit risk, one might ask to which extent it’s risk/return profile compares to other fixed income investments. In Table 5, cat bond spreads are expressed relative to the spread derived from a representative corporate bond (issued by firms in the financial sector) with the same rating and the same time to maturity. The data source for corporate bond spreads is the Merrill Lynch fixed income database, containing ‘rating-specific’ constant-maturity yield curves, interpolated to match the ttm of the respective cat bond. The univariate result shows that cat bond spreads in our data set are 3.24 times the spread of comparable corporate bond spreads – a striking observation if one assumes a bond rating to be a valid diagnostic to compare risk across asset classes. The impact of expected losses as a pricing determinant does not entirely vanish, as shown in specifications (2) to (4); while statistically significant, this effect does not appear to be economically significant. After controlling for the same bond-specific characteristics as in earlier tests, the results show that cat bonds offer a yield spread approximately twice the size of equally rated corporate bonds in 2005. Under the assumption that corporate bonds are subject to normal economic risk, I also investigate what model-implied differences emerge. The numerical results in Figure 5 are based on the calibration scenario A, in which the economy is composed of roughly equal amounts of both types of risk as measured by their contribution to total quadratic variation. I then compute the state-dependent
23
price of a representative corporate bond using a constant default boundary for a given level of expected losses, as shown in Chen et al. (2009). The bottom graph in Figure 5 shows the ratio of risk-adjusted default probability relative to physical default probability, for the identical levels of expected losses as used in the cat bond analysis above. The model predicts that the corporate bond spread equals 1.6 times expected losses at the steadystate, a reasonable value for the market price of credit risk. As seen before, the same calibration generates spreads between 4 and 5 times expected losses in the cat bond market, and thereby a pricing difference close to that observed in real data. This exercise highlights another important feature of the model: The preference specification at hand implies distinctly different risk premia for different sources of uncertainty. Specifically, Poisson risk implies a higher reward for the investor per unit of expected losses compared to Brownian motion risk.
4.5
Further Technical Discussion
To construct an equilibrium subject to a Brownian motion and Poisson risks, I relaxed the assumption of a predetermined habit in close proximity to the steady-state. As a result of this it is possible that the dividend and the habit do not move in the same direction at the occurrence of a catastrophe. Therefore, I examine the characteristics of the implied habit process (dx/dc) to rule out implausible cases, see Figure 6. For scenario B no violation occurs. A small violation occurs for some values of the surplus consumption ratio in scenario A. However, the violation is very small, a -4.45% drop in the dividend leads to an increase in the habit level by only .18% in the worst case. I infer that relaxing the predetermined habit in close proximity to the steady-state does not lead to implausible characteristics. Finally, the probability densities of the surplus consumption ratio are shown in Figure 7. The densities shows a stronger negative skew as compared to the benchmark case with Brownian motion risk only, see for example Aydemir et al. (2007), which is the result of incorporating Poisson risk.
24
4.5.1
Alternative models
Alternative models could also help to explain features of the cat bond market; hence a discussion is desired to further strengthen the choice at hand: Within the class of CRRA preferences, Naik and Lee (1990) establish a benchmark case for Brownian motion risk and rare event risk. As mentioned earlier, their setting would require more unreasonable parameter values for the exogenous process to generate the level of cat bond spreads. It is possible of course that such extreme scenarios occur, as in the case of the 1923 Tokyo earthquake, but should not be expected for U.S. demographics. Liu et al. (2005) solve an equilibrium model in which a representative investor faces imprecise knowledge about the properties of rare events. The model delivers a rare-event premium for uncertainty aversion that helps to explain the stylized facts of option-implied volatility. Their motivation could be applied to the cat bond market in which statistical properties of rare events are also an important ingredient. However, their model would not deliver a prediction on the time-varying nature of spreads. Instead, I work with a unique estimate of expected losses and arrival intensities as reported to the cat bond investor and publicly available in the bond prospectus.11 Within the family of habit models, Chan and Kogan (2002) analyze a relative-habit model instead of the difference model considered here. The authors induce investor heterogeneity in risk aversion generating countercyclicality in risk premia. Further research is required to examine whether the endogenous wealth transfer in their model is sufficient to generate an effect comparable in size to the Katrina effect.
5
Conclusion
Some features of catastrophe bonds can be reconciled with investor preferences, in that catastrophes are rare economic shocks that could bring investors closer to their subsistence level. Although pertinent, Hurricane Katrina is of course only one observation of a large economic shock. Once longer-term data becomes available, it remains to be analyzed whether the model predicts realistic variation of cost of capital over the long-run, or whether we can explain the correlation observed between cat bonds and other asset classes during the recent financial crises. A stylized fact the model can not capture is the additional reward investors appear to require for the presence of an 11
Liu et al. (2005) briefly discuss alternative models to explain the option smirk. They mention the possibility
to investigate the case of habit formation in which rare events and normal economic risks can separately affect the investor’s habit process – precisely the modeling exercise I undertake in this paper.
25
indemnity trigger. I leave such an extension to include potential moral hazard issues for future work. Since reinsurance companies start securitizing a greater variety of perils, it should also become helpful to examine the market price of more endogenous hazards like terrorism or war.
26
prem expl prem / expl p loss loss gc p kappa kappa amount age ttm no bonds
mean
median
min
max
std dev
wind
no wind
indem
no indem
539.6 158.9 4.3 205.4 0.785 0.380 0.435 58.1 24.9 17.5 61
429.9 128.0 3.8 159.0 0.805 0.363 0.474 25.0 25.7 12.3 61
90.2 15.0 1.4 23.4 0.439 0.167 0.107 1.8 2.7 3.3 61
1870.6 486.0 20.2 597.0 0.917 0.841 0.544 300.0 92.6 52.3 61
397.7 147.1 2.3 189.2 0.088 0.127 0.090 60.9 13.9 11.5 61
692.9 219.0 3.8 279.0 0.785 0.384 0.450 54.1 22.3 18.3 33
344.8 82.5 5.0 107.8 0.785 0.374 0.416 63.3 28.3 16.6 28
544.6 115.7 6.3 174.3 0.731 0.424 0.340 127.3 12.0 22.6 13
538.5 168.6 3.9 210.2 0.797 0.370 0.456 42.6 27.8 16.4 48
Table 1: Descriptive Statistics. The table shows descriptive statistics of the cat bond data set for the variables: prem (annualized premium in basispoints), expl (annualized expected loss in basispoints), the ratio of prem/expl, p loss (annualized probability of a catastrophe leading to a loss), loss gc (expected loss given the occurrence of a catastrophe), p kappa (probability of a small impact given the occurrence of a catastrophe), kappa (small impact loss size), notional amount (in millions), age (in months), ttm (time to maturity in months). The panel includes 61 cat bonds observed between 3/31/2005 and 03/31/2006. Data sources are Lane Financial L.L.C., Guy Carpenter and Company L.L.C., and online directory Artemis.
27
intercept expl
(1)
(2)
(3)
(4)
(5)
(6)
86.14 6.92 2.54 64.11
42.02 1.45 2.58 51.89
35.26 1.19 2.57 27.99
2.65 25.70
2.66 23.40
2.68 21.51
0.33 1.12 0.69 38.56
0.69 2.41 0.70 41.77 0.20 2.31 0.00 -0.18 -0.01 -4.22 0.01 1.75
0.60 2.54 0.69 33.81 0.16 1.86 0.00 0.06 0.00 -2.56 0.01 2.22 0.13 1.27 -0.03 -0.30 -0.02 -0.55 -0.20 -4.39
0.83
0.86
0.87
ln(loss gc) ln(pfl) indem amount age ttm
124.50 3.44 -0.09 -0.67 -0.82 -2.18 1.87 2.09
103.58 3.02 0.00 -0.01 0.03 0.08 2.38 2.35 -78.13 -1.03 74.36 1.05 5.68 0.31 -68.55 -3.97
0.90
0.91
multi p multi c wind non-us R-squared
0.89
Table 2: Cat Bond Pricing - General Specification. The tables shows coefficient estimates of a multiple regression with t-statistics below the point estimate. Specifications (1), (2) and (3) contain prem as a dependent variable, specifications (4), (5) and (6) contain ln(prem) as a dependent variable. All specifications include time fixed effects. ln() denotes the natural logarithm.
28
expl expl * post kat
(1)
(2)
2.36 28.98 0.42 7.05
2.33 32.57 0.47 7.19
ln (loss gc) ln (loss gc) * post kat ln (pfl) ln (pfl) * post kat indem
103.58 3.15
0.00 -0.02 0.03 0.09 2.38 2.41 -78.13 -1.05 74.36 1.07 5.68 0.32 -68.55 -4.08
38.74 1.44 129.68 2.25 0.00 -0.02 0.03 0.10 2.38 2.40 -78.13 -1.11 74.36 1.13 5.68 0.33 -68.55 -3.97
0.92
0.93
indem * post kat amount age ttm multip multic wind non-us R-squared
(3)
(4)
0.89 2.78 -0.56 -1.15 0.67 32.68 0.04 1.71 0.16 1.87
0.00 0.06 0.00 -2.65 0.01 2.22 0.13 1.31 -0.03 -0.30 -0.02 -0.56 -0.20 -4.42
0.84 2.54 -0.47 -0.89 0.66 33.02 0.05 1.92 0.11 1.14 0.11 0.94 0.00 0.06 0.00 -2.67 0.01 2.22 0.13 1.32 -0.03 -0.30 -0.02 -0.56 -0.20 -4.39
0.89
0.90
Table 3: Cat Bond Pricing - Katrina Test 1. The table shows coefficient estimates of a multiple regression with t-statistics below the point estimate, using prem as a dependent variable in (1) and (2), and ln(prem) as a dependent variable in (3) and (4). ‘post kat’ is an indicator variable that equals one if the observation corresponds to post-Katrina, zero otherwise. All specifications include an intercept and time fixed effects. ln() denotes the natural logarithm.
29
expl expl * (1-wind)
(1)
(2)
(3)
2.21 33.72 0.68 2.44
1.95 11.07
2.35 25.33
expl * (1-indem)
0.42 2.46
expl * (1-wind) * (1-indem) expl * post kat expl * post kat * (1-wind)
0.49 6.44 0.86 1.76
expl * post kat * (1-indem)
1.31 2.69
-0.92 -1.95
expl * post kat * (1-wind) * (1-indem) indem amount age ttm multip multic wind non-us R-square
0.09 0.51 0.42 6.86
81.39 2.73 0.18 0.87 -0.26 -0.62 1.70 1.97 -65.35 -1.11 79.13 1.26 103.41 2.55 -79.67 -4.46
98.85 2.43 0.00 0.01 0.01 0.04 2.35 2.63 -77.88 -1.15 74.10 1.15 5.56 0.32 -68.56 -4.06
-0.02 -0.08 104.62 3.31 0.02 0.09 -0.01 -0.03 2.30 2.12 -79.71 -1.09 76.51 1.12 12.21 0.45 -68.86 -4.07
0.93
0.94
0.94
Table 4: Cat Bond Pricing - Katrina Test 2. The table shows coefficient estimates of a multiple regression with t-statistics below the point estimate, using prem as a dependent variable. ‘post kat’ is an indicator variable that equals one if the observation corresponds to post-Katrina, zero otherwise. All specifications include an intercept and time fixed effects.
30
intercept
(1)
(2)
(3)
(4)
3.24 17.25
2.61 8.88 0.01 3.44
2.00 8.73 0.01 4.20 2.25 3.99
2.14 4.86 0.01 3.83 2.29 3.88 -0.01 -0.47
0.00
0.09
0.27
0.27
expl indem ttm R-squared
Table 5: Cat Bond Premium relative to Corporate Bond Premium. Cat bond spreads are expressed relative to an equivalent corporate bond (issued by the firms in the financial sector) with same rating and same time to maturity. The table shows coefficient estimates of a multiple regression with t-statistics below the point estimate, using cat prem / corp prem (relative to swap yield) as a dependent variable. The data source for corporate bond spreads is the Merrill Lynch fixed income database, containing ‘rating-specific’ constant-maturity yield curves, interpolated to match the ttm of the respective cat bond.
31
assumed parameters patience phi gamma div. growth rate sigma lambda no-wind kappa no-wind lambda wind kappa wind
implied parameters interest rate S steady S max
scenario A
scenario B
0.0543 0.13 2 0.0189 0.0070 0.0108 -0.0445 0.0279 -0.0390
0.0703 0.13 2 0.0189 0.0109 0.0108 -0.0250 0.0279 -0.0190
scenario A
scenario B
0.0100 0.0811 0.1334
0.0100 0.0570 0.0938
assumed parameters patience phi gamma div. growth rate sigma lambda p (small impact) kappa small impact kappa large impact small loss on cat bond exhaust on cat bond implied parameters interest rate S steady S max
scenario C 0.0788 0.13 2 0.0189 0.0112 0.0205 0.39 -0.0200 -0.0300 0.43 1.00 scenario C 0.0100 0.0571 0.0939
Table 6: Calibration Parameters. Scenarios A and B are calibration exercises in which the economy faces two sources of catastrophic risk, wind and non-wind risk. Scenario C is a calibration exercise in which the economy faces one source of catastrophic risk, but the impact of an occurrence is random and can be small or large.
32
market price of catastrophe risk 0.8 cat risk no−wind cat risk wind
0.7
risk−adjusted lambda
0.6 0.5 0.4 0.3 0.2 0.1 0 0
0.02
0.04 0.06 0.08 0.1 surplus consumption ratio S
0.12
0.14
ratio premium / expected losses 40 cat risk no−wind cat risk wind
ratio premium / expected losses
35 30 25 20 15 10 5 0 0
0.02
0.04 0.06 0.08 0.1 surplus consumption ratio S
0.12
0.14
sensitivity of risk premia to −1% drop in consumption
ratio post/pre shock
1.25
1.2
1.15
1.1
1.05 cat risk no−wind cat risk wind 1 0
0.02
0.04 0.06 0.08 0.1 surplus consumption ratio S
0.12
0.14
Figure 1: Market Price of Catastrophic Risks - Scenario A. The figures display the market price of catastrophic risks, the ratio of premium versus expected losses, and the sensitivity of the market price to a 1% drop in consumption, as a function of the surplus consumption ratio.
33
market price of catastrophe risk 0.35 cat risk no−wind cat risk wind
risk−adjusted lambda
0.3 0.25 0.2 0.15 0.1 0.05 0 0
0.01 0.02 0.03 0.04 0.05 0.06 0.07 0.08 0.09 surplus consumption ratio S
0.1
ratio premium / expected losses 25
ratio premium / expected losses
cat risk no−wind cat risk wind 20
15
10
5
0 0
0.01 0.02 0.03 0.04 0.05 0.06 0.07 0.08 0.09 surplus consumption ratio S
0.1
sensitivity of risk premia to −1% drop in consumption
ratio post/pre shock
1.25
1.2
1.15
1.1
1.05 cat risk no−wind cat risk wind 1 0
0.01 0.02 0.03 0.04 0.05 0.06 0.07 0.08 0.09 surplus consumption ratio S
0.1
Figure 2: Market Price of Catastrophic Risks - Scenario B. The figures display the market price of catastrophic risks, the ratio of premium versus expected losses, and the sensitivity of the market price to a 1% drop in consumption, as a function of the surplus consumption ratio.
34
market price of cat risk risk−adjusted likelihood of small impact risk−adjusted lambda
q and risk−adjusted lambda
0.5
0.4
0.3
0.2
0.1
0 0
0.01 0.02 0.03 0.04 0.05 0.06 0.07 0.08 0.09 surplus consumption ratio S
0.1
risk−adjusted expected loss given cat
risk−adjusted expected loss given cat
0.88
0.86
0.84
0.82
0.8
0.78 0
0.01 0.02 0.03 0.04 0.05 0.06 0.07 0.08 0.09 surplus consumption ratio S
0.1
market price of cat risk 30 risk−adjusted cat likelihood / cat likelihood premium / expected loss 25
ratio
20
15
10
5
0 0
0.01 0.02 0.03 0.04 0.05 0.06 0.07 0.08 0.09 surplus consumption ratio S
0.1
Figure 3: Market Price of Catastrophic Risks - Scenario C. The figures display q and the riskadjusted likelihood of a catastrophe, the risk-adjusted expected loss given a catastrophe, and the ratio of premium versus expected losses, as a function of the surplus consumption ratio.
35
Term Structure / Non−Wind Catastrophes 450
cat bond spread in bp
400 350 300 250 200 150 100 0
10
20
30 ttm
40
50
60
50
60
Term Structure / Wind Catastrophes 700 650
cat bond spread in bp
600 550 500 450 400 350 300 250 0
10
20
30 ttm
40
Figure 4: Term Structure of Catastrophe Bond Spreads. The figures display the yield to maturity of a catastrophe bond in basis points, for three values of the surplus consumption ratio. The x-axis shows the time to maturity. Parameter values correspond to scenario B, dotted line S = .04, solid line S = .065, dashed line S = .09.
36
market price of normal economic risk 0.6
0.5
sharpe ratio
0.4
0.3
0.2
0.1
0 0
0.02
0.04 0.06 0.08 0.1 surplus consumption ratio S
0.12
0.14
0.12
0.14
sensitivity of habit 1.2
1
dx/dc
0.8
0.6
0.4
0.2
0 0
0.02
0.04 0.06 0.08 0.1 surplus consumption ratio S corporate bond spread
physical default likelihood 1.08% physical default likelihood 2.79%
ratio risk−neutral/physical prob.
3.5
3
2.5
2
1.5
1 0
0.02
0.04 0.06 0.08 0.1 surplus consumption ratio S
0.12
0.14
Figure 5: Market Price of Normal Economic Risk. The figures display the market price of normal economic risk, the sensitivity of the habit level with respect to normal economic risk, and the ratio of riskneutral relative to physical default probabilities of a hypothetical corporate bond, as a function of the surplus consumption ratio. All graphs correspond to scenario A.
37
sensitivity of habit − Scenario A 0.005 0
cat risk no−wind cat risk wind
−0.005 −0.01
dx/dc
−0.015 −0.02 −0.025 −0.03 −0.035 −0.04 −0.045 0
0.02
0.04 0.06 0.08 0.1 surplus consumption ratio S
0.12
0.14
sensitivity of habit − Scenario B 0.005 0
cat risk no−wind cat risk wind
dx/dc
−0.005 −0.01 −0.015 −0.02 −0.025 −0.03 0
0.01 0.02 0.03 0.04 0.05 0.06 0.07 0.08 0.09 surplus consumption ratio S
0.1
Figure 6: Sensitivity of Habit Level. The figures display the sensitivity of the habit level (dx/dc) at the occurrence of a catastrophe, as a function of the surplus consumption ratio.
38
with catastrophic risk (Scenario A) 0.08 0.07 0.06
density
0.05 0.04 0.03 0.02 0.01 0 0
0.02
0.04
0.06
0.08
0.1
0.12
0.14
S with catastrophic risk (Scenario B) 0.06
0.05
density
0.04
0.03
0.02
0.01
0 0
0.02
0.04
0.06 S
0.08
0.1
0.12
Figure 7: Density of the Surplus Consumption Ratio. The figure displays the density of the surplus consumption ratio, corresponding to scenarios A and B, respectively.
39
References Aydemir, A., M. Gallmeyer, and B. Hollifield, 2007, “Financial Leverage and the Leverage Effect A Market and Firm Analysis,” working paper, Carnegie Mellon University. Bantwal, V., and H. Kunreuther, 2000, “A Cat Bond Premium Puzzle,” Journal of Psychology and Financial Markets, 1, 76–91. Born, P., and W. K. Viscusi, 2006, “The Catastrophic Effects of Natural Disasters on Incurance Markets,” Journal of Risk and Uncertainty, 33, 55–72. Campbell, J., and J. Cochrane, 1999, “By Force of Habit: A Consumption-Based Explanation of Aggregate Stock Return Behaviour,” Journal of Political Economy, 107, 205–251. Chan, Y., and L. Kogan, 2002, “Catching Up with the Joneses: Heterogeneous Preferences and the Dynamics of Asset Prices,” Journal of Political Economy, 110, 1255–1285. Chen, L., P. Collin-Dufresne, and R. Goldstein, 2009, “On the Relation between the Credit Spread Puzzle and the Equity Premium Puzzle,” Review of Financial Studies, 22, 3367–3409. Cummins, D., and M. Weiss, 2009, “Convergence of Insurance and Financial Markets: Hybrid and Securitized Risk Transfer Solutions,” Journal of Risk and Insurance, 76, 493–545. Cummins, J., 2006, “Should the Goverment Provide Insurance for Catastrophes,” Federal Reserve Bank of St. Louis Review, 88, 337–379. Cummins, J., D. Lalonde, and R. Phillips, 2004, “The Basis Risk of Catastrophic-Loss Index Securities,” Journal of Financial Economics, 71, 77–111. Das, S., 2002, “The Surprise Element: Jumps in Interest Rates,” Journal of Econometrics, 106, 27–65. Doherty, N., and A. Richter, 2002, “Moral Hazard, Basis Risk, and Gap Insurance,” Journal of Risk and Insurance, 69, 9–24. Edwards, A. K., L. E. Harris, and M. S. Piwowar, 2007, “Corporate Bond Market Transaction Costs and Transparency,” Journal of Finance, 62, 1421–1451.
40
Finken, S., and C. Laux, 2009, “Cat Bonds and Reinsurance:
The Competitive Effect of
Information-Insensitive Triggers,” Journal of Risk and Insurance, 76, 579–605. Froot, K. A., 2001, “The Market for Catastrophe Risk: A Clinical Examination,” Journal of Financial Economics, 60, 529–571. Helwege, J., and C. Turner, 1999, “The Slope of the Credit Yield Curve for Speculative-Grade Issuers,” Journal of Finance, 54, 1869–1883. Lane, M., 2006, “What Katrina Hath Wrought,” working paper, Lane Financial L.L.C. Liu, J., J. Pan, and T. Wang, 2005, “An Equilibrium Model of Rare-Event Premia and Its Implication for Options Smirks,” Review of Financial Studies, 18, 131–164. Longstaff, F., and M. Piazzesi, 2004, “Corporate Earnings and the Equity Premium,” Journal of Financial Economics, 74, 401–421. Naik, V., and M. Lee, 1990, “General Equilibrium Pricing of Options on the Market Portfolio with Discontinuous Returns,” Review of Financial Studies, 3, 493–521. Rietz, T. A., 1988, “The Equity Risk Premium,” Journal of Monetary Economics, 22, 117–131. Verdelhan, A., 2008, “A Habit-Based Explanation of the Exchange Rate Premium,” Journal of Finance, forthcoming. Wachter, J., 2006, “A consumption-based model of the term structure of interest rates,” Journal of Financial Economics, 79, 365–399. Zanjani, G., 2002, “Pricing and Capital Allocation in Catastrophe Insurance,” Journal of Financial Economics, 65, 283–305.
41