Cah. Biol. Mar. (2005) 46 : 241-251
Bacterioplankton growth on extracellular organic carbon from marine microalgal cultures Konstantinos Ar. KORMAS* Department of Zoology – Marine Biology, School of Biology, University of Athens, 157 84 Panepistimiopoli, Athens, Greece * Present address: Department of Animal Production & Aquatic Environment, School of Agricultural Sciences, University of Thessaly, 383 34 N. Ionia, Volos, Greece Tel.: +30-242-109-3082, Fax: +30-242-109-3157, E-mail:
[email protected] Abstract: Marine bacterial growth on extracellular organic carbon (EOC) of Chlorella minutissima, Dunaliella tertiolecta and Chaetoceros gracilis was studied. EOC was retrieved after filtration of optimum growing algal cultures at the middle of the exponential growth phase and the stationary phase. The filtrates were inoculated with natural marine bacterial assemblages. The batch cultures were monitored for dissolved organic carbon (DOC) concentrations, bacterial yield, biomass and oxygen respiration over a period 3.5-10 days. The overall bacterial response was statistically different between the algal species origin of EOC and between the two growth phases for each species. These differences were also found for DOC normalised values suggesting that they were due to qualitative differences of the EOC. The highest bacterial yield was induced by the EOC originating from D. tertiolecta and the lowest by the C. minutissima EOC. Oxygen respiration followed the same pattern with significantly higher values in the cultures with D. tertiolecta and C. gracilis stationary phase EOC. DOC degradation rate, utilisable DOC, bacterial growth rate and bacterial growth efficiency was different between the EOC from the exponential and stationary phase of algal growth, only in the case of C. gracilis. Of all the algal species studied here, it seems that the exponential C. gracilis EOC is more labile for marine bacteria. Résumé : Croissance de bactéries marines à partir du carbone organique extracellulaire de cultures phytoplanctoniques. La croissance de bactéries marines à partir du carbone organique extracellulaire (EOC) de Chlorella minutissima, Dunaliella tertiolecta et Chaetoceros gracilis a été étudiée. L’EOC a été obtenu après filtration d’algues cultivées en conditions optimales, pendant la phase exponentielle de croissance et pendant la phase stationnaire. Les filtrats ont été inoculés avec des assemblages naturels de bactéries marines. Dans les cultures ont été mesurées les concentrations du carbone organique dissous (COD), la croissance bactérienne, la biomasse et la respiration (oxygène) sur une période 3,5-10 jours. La réponse bactérienne globale à l’EOC diffère significativement selon les espèces d’algues et les phases de croissance. Des différences significatives ont été également trouvées pour les valeurs normalisées de COD, ce qui suggère qu’elles pourraient être dues aux différences qualitatives de l’EOC. De plus fortes abondances bactériennes ont été induites par l’EOC de D. tertiolecta et les plus faibles par l’EOC de C. minutissima. La respiration suit le même schéma avec des valeurs sensiblement plus élevées avec l’EOC des cultures en phase stationnaire de D. tertiolecta et de C. gracilis. Le taux de dégradation de COD, le COD utilisable, le taux de croissance bactérienne et l’efficacité bactérienne de croissance sont différents entre l’EOC de la phase exponentielle et de la phase stationnaire de croissance des algues, seulement pour C. gracilis. De toutes les espèces étudiées ici, il semble que l’EOC de la phase exponentielle de C.gracilis soit la plus labile pour les bactéries marines. Keywords: Dissolved organic carbon, Bacteria, Phytoplankton, Mediterranean. Reçu le 20 octobre 2004 ; accepté après révision le 4 mai 2005. Received 20 October 2004; accepted in revised form 4 May 2005.
242
MARINE BACTERIAL GROWTH ON MICROALGAL DOM
Introduction It is now known that the answer to Sharp’s (1977) question if healthy phytoplankton cells release exudates is yes (Bjørnsen, 1988; Williams, 2000 and references therein). The release of extracellular organic carbon (EOC) by phytoplankton is a part of algal physiology that takes place in maximum rates and under stress growth conditions as well (Sharp, 1977; Bjørnsen, 1988). Under sufficient light and low nutrient concentration, as is the case in for the greatest part of the oceans, carbon fixation may exceed incorporation into cell material, resulting in extracellular release (overflow) of photosynthate (Nagata, 2000; Dubinsky & Berman-Frank, 2001). Typical EOC include, but are not limited to, carbohydrates, nitrogenous substances, organic acids, lipids, phosphates and other enzymes (Myklsestad, 2000; Nagata, 2000). The amount and nature of exuded products depends on several factors. The taxon of the alga dictates the composition of compounds released (e.g. Hellebust, 1974). Environmental conditions and algal age also may significantly affect exudate release (Watanabe & Oishi, 1985). The importance of phytoplankton EOC in the aquatic environment is multiple. These substances can be metal chelating agents (Rhee & Thompson, 1992); they can inhibit or attract some types of bacteria (Casamatta & Wickstrom, 2000); under certain conditions, they can form microscopic and macroscopic aggregates of various sizes (Kaltenböck & Herndl, 1992, Corzo Amorillo & Rodriguez, 2000) or can inhibit copepod grazing activity (Malej & Harris, 1993), thus having an impact on the structure of the dominant food web type. Perhaps, the most important role of EOC in the aquatic environment is that of a carbon/energy source for bacteria (Nagata, 2000). Bacterial degradation is believed to be the most important process controlling dissolved organic carbon (DOC) removal, possibly aided by photochemical transformations (Williams, 2000). Although many other sources of DOC exist for bacterial utilization, the primary labile DOC source for bacteria is considered to be recently produced photosynthetic products of phytoplankton (Cole et al., 1988 and references therein). Bacteria are the primary assimilators of dissolved organic carbon in aquatic ecosystems (Azam et al., 1993). The bacterioplankton may respond to different types of carbon compounds products by altering their metabolic pathways and rates of growth and activity (Wehr et al 1999), or the bacteria may be unable to use or withstand the compounds, resulting in their decline and eventual loss from the community. It is generally accepted that 50% of primary production passes through dissolved organic matter (DOM) (Anderson & Ducklow, 2001), with higher values in oligotrophic envi-
ronments than in more nutrient-rich areas (Teira et al., 2001). However, careful contemporary studies suggest values as low as 2% and as high as 130%. In part this variability reflects the insufficient database on heterotrophic processes in the global ocean. A similar large variation applies for the available data on the amount of primary production that is channelled via EOC to bacterial uptake in aquatic environments. In spite of the numerous studies and array of environments studied, values vary from 3% up to 90% (e.g. Lignell, 1990; Witek et al., 1997). Existing data regarding the percent extracellular release of DOC relative to total primary production for many algal species (see Fig. 1 in Nagata, 2000) is disproportionate to this on how much of this DOC is taken up and how it is utilized (biomass and respiration) by bacteria. In this paper, the growth and respiration of marine bacteria on EOC from three marine phytoplanktic algae were investigated. The aim of the study was to examine if the different cell size, taxonomic group and stage of growth phase have an effect on the utilisation of EOC by marine bacteria.
Materials and methods Phytoplankton cultures Non-axenic cultures of the marine phytoplanktic species Chlorella minutissima Fott & Nováková (Chlorophyceae) (1.0-3.5 µm diameter), Chaetoceros gracilis Schütt (Baccilariophyceae) (6-10 µm length), Dunaliella tertiolecta Butcher (Chlorophyceae) (9-11 µm length) were grown in sterile 4 L flasks in Walne (1966) medium under a light:dark cycle of 14:10 h under illumination of “cool white” light with a photosynthetic active radiation (PAR) of 180 µmol.m-2.s-1, at 23 ± 1ºC, and constant sterile (0.2 µm filtered) air bubbling. The species inocula were obtained from The Culture Collection of Algae at the University of Texas at Austin, USA. Bacterial cultures About 4 L of phytoplankton culture was filtered twice through precombusted (500ºC, 4 h) Whatman GF/F filters (0.7 µm nominal pore size) under low vacuum (< 100 mm Hg) at the middle of the exponential growth (ca. 10 days) and at the stationary phase (ca. 20 days). To insure that organic matter did not leach from cells trapped on the filters, filters were not allowed to dry and were changed frequently, before clogging. DOC in filtrate, before and after filtration was not significantly different (data not shown). This filtrate contained 0.9-1.4 x 10³ bacterial cells.ml-1. The filtrate was mixed with fresh sea water filtrate (Whatman GF/F) at a ratio of approximately 9:1, which was collected from the open Saronikos Gulf at 5 m a few days before the
K.A. KORMAS
243
initiation of the experiments and kept in the dark at 4ºC until inoculation. This dilution ensured that the natural bacterial populations in sea water were also present in the experimental samples. No protists were found in the cultures during the course of the incubations. Triplicate 500 ml conical flasks containing filtrate from the phytoplankton cultures were run in parallel with each treatment.
where L is the length (µm) in and W is the width (µm) of the cells. A total of 200-700 cells was measured per triplicate sample. The carbon content (C) of the cells was calculated from BV using the formula (Thiel-Nielsen & Søndergaard, 1998):
Laboratory measurements
Bacterial specific growth rate (µ) was calculated as the slope of the Ln transformed bacterial numbers versus time during the exponential growth phase. The lag portion of the curves was omitted and the end of the logarithmic growth was defined by the highest value before the curve reached the plateau phase. Bacterial productivity (BP) was calculated from the difference in biomass during the exponential growth phase.The bacterial growth efficiency (BGE) was calculated by the formula (Coffin et al., 1993):
Oxygen consumption was determined by measuring the decrease of dissolved oxygen in Winkler bottles over time. Approximately two litres of the culture media of the above described batch cultures medium was bubbled with sterile (0.2 µm filtered) air to increase dissolved oxygen concentration but for less than one hour to avoid flocculation. Then, triplicate 60 ml Winkler bottles were filled to the point of overflowing, capped with no head space and kept in a water bath under the same conditions as the batch cultures. In each time point, triplicate Winkler bottles were withdrawn and the concentration of dissolved oxygen was determined according to Carpenter (1965). Variation of triplicate samples never exceeded 3.2%. Samples for dissolved organic carbon (DOC) measurements were collected directly in pre-combusted glass vials, two drops of 37% HCl were added and the samples were stored in the dark at 4ºC until analysis (< 1 week). DOC was measured by high-temperature catalytic combustion (Sugimura & Suzuki, 1988) in a Dohrmann DC-190 analyser. The stored samples were filtered through 25 mm acidwashed and well-rinsed with Milli-Q water PTFE filters of 0.2 µm pore size (Millipore). From the filtrate, three to five replicates (injections of 100 µl) for each sample were analysed. Standard error for replicate injections varied from 1.2 to 8,8%. Blank samples (Milli-Q water) ranged from 0.063 to 0.092 mM DOC. Calculation of carbon concentrations was made using sucrose as a standard. In this paper, utilisable DOC (UDOC) is defined as the amount of DOC removed by bacteria from the beginning of the exponential growth until the end of the exponential growth phase. It is expressed as % of total DOC. DOC degradation rate was calculated from the DOC concentration difference during exponential growth phase divided by the respective time difference. Bacterial counts were measured using epifluorescence microscopy as described in Turley (1993). Biovolume (BV) of bacterial cells were measured at the beginning and the end of the exponential growth phase and were determined as described by Massana et al. (1997). Cells were classified either as cocci (spheres) or rods. The biovolume (µm3) of the rods was calculated according to the formula by Bratbak (1985): BV = π4.W2.(L – W/3)
(1)
C = 243.BV0.56
BGE = ∆B/ (∆B+R).100
(2)
(3)
where ∆B is the change in bacterial biomass during the exponential growth phase and R is the CO2 production rate calculated from the oxygen consumption during the same time period. A respiratory quotient of 1 is assumed for these calculations. One-way Analysis of Variance (ANOVA) was used to detect significant statistical differences between treatments (Zar, 1984). All statistical analyses were performed with the STATISTICA software package.
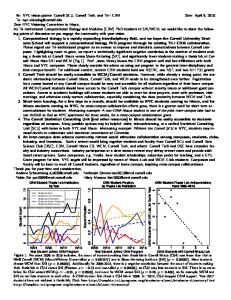
Results Bacterial yield (Fig. 1) in the batch cultures with filtrate from the stationary phase of the microalgal species as growth medium (Stationary Batch Cultures, SBC) was higher than in batch cultures with filtrate from the exponential phase of the microalgal species (Exponential Batch Cultures, EBC). The difference in maximum bacterial yield between SBC and EBC was the highest for Chlorella minutissima (x 4.7 times) and the lowest for Dunaliella tertiolecta (x 1.2 times). DOC concentrations (Fig. 1) followed an opposite trend to bacterial yield, at least for the first time points. Statistically significant differences in the maximum bacterial yield between EBC and EBC were found for C. minutissima (ANOVA: F = 16.3, P = 0.027) and Chaetoceros gracilis (ANOVA: F = 22.7, P = 0.009). DOC degradation rate (Fig. 2) ranged from 0.12 to 1.22 mM.d-1. Only for C. gracilis the EBC was significantly higher than SBC (ANOVA: F = 58.4, P = 0.005). There were also significant differences between species for EBC (ANOVA: F = 23.6, P = 0.001) and SBC (ANOVA: F = 8.7, P = 0.024). Utilisable DOC ranged from 8.6 to 38.1% and was equal or higher in the EBC. Statistically significant differences between the EBC and SBC was found only for C.
244
MARINE BACTERIAL GROWTH ON MICROALGAL DOM
Figure 1. Dissolved organic carbon (DOC) concentrations (dashed line) and bacterial abundance changes (solid line) of marine bacterial batch cultures, using the extracellular organic carbon (EOC) from the exponential (EBC) and stationary (SBC) phase of three marine microalgal species as growth medium. Bars indicate standard error. Figure 1. Variations des concentrations de carbone organique dissous (DOC – ligne discontinue) et de l’abondance bactérienne (ligne continue) dans les cultures bactériennes se développant sur le carbone organique extracellulaire (EOC) des phases exponentielle (EBC) et stationnaire (SBC) des trois espèces phytoplanctoniques. Les barres indiquent l’erreur standard.
K.A. KORMAS
245
Figure 2. Dissolved organic carbon (DOC) degradation rate (a) and the percentage of utilisable DOC (UDOC) of marine bacterial batch cultures using the extracellular organic carbon from the exponential (EBC) and stationary (SBC) phase of three marine microalgal species as growth medium. Bars indicate standard error. Figure 2. Taux de dégradation (a) du carbone organique dissous (DOC) et pourcentage (b) de DOC utilisable (UDOC) mesurés dans les cultures bactériennes se développant sur le carbone organique extracellulaire des phases exponentielle (EBC) et stationnaire (SBC) des trois espèces phytoplanctoniques. Les barres indiquent l’erreur standard.
246
MARINE BACTERIAL GROWTH ON MICROALGAL DOM
Figure 3. Bacterial specific growth rate (µ) of marine bacterial batch cultures, using the extracellular organic carbon from the exponential (EBC) and stationary (SBC) phase of three marine microalgal species as growth medium. Bars indicate standard error. Figure 3. taux de croissance (µ) des cultures bactériennes se développant sur le carbone organique extracellulaire des phases exponentielle (EBC) et stationnaire (SBC) des trois espèces phytoplanctoniques. Les barres indiquent l’erreur standard.
Figure 4. Bacterial productivity of marine bacterial batch cultures, using the extracellular organic carbon from the exponential (EBC) and stationary (SBC) phase of three marine microalgal species as growth medium. Bars indicate standard error. Figure 4. productivité des cultures bactériennes se développant sur le carbone organique extracellulaire des phases exponentielle (EBC) et stationnaire (SBC) des trois espèces phytoplanctoniques. Les barres indiquent l’erreur standard.
K.A. KORMAS
247
Table 1. Results of Analysis of Variance (ANOVA) of parameters from bacterial batch cultures growing with extracellular organic carbon originating from exponential (EBC) and stationary (SBC) growth phases of Chaetoceoros gracilis, Dunalilella tertiolecta and Chlorella minutissima batch cultures. * p < 0.05, ** p < 0.01, *** p < 0.001. Tableau 1. Résultats des analyses de variance (ANOVA) des paramètres mesurés dans les cultures bactériennes se développant sur le carbone organique extracellulaire des phases exponentielle (EBC) et stationnaire (SBC) des cultures de Chaetoceoros gracilis, Dunalilella tertiolecta et Chlorella minutissima. * p < 0,05, ** p < 0,01, *** p < 0,001.
Dissolved organic carbon (DOC) degradation rate Utilisable DOC Bacterial production Specific growth rate Bacterial growth efficiency Oxygen consumption rate
Between growth phases
Between species
C. gracilis *** C. gracilis ** C. gracilis C. gracilis *** C. gracilis ** D. tertiolecta *** C. gracilis **
EBC ***, SBC * SBC * EBC *, SBC *** EBC ***, SBC *** EBC **, SBC ** EBC *, SBC ***
gracilis (ANOVA: F = 48.9, P = 0.006) as well. Differences between species was found only for SBC (ANOVA: F = 7.0, P = 0.035). Bacterial growth rate (Fig. 3) was lower for C. minutissima (0.28-0.33 d-1) than for the other two species. Statistically significant difference between EBC and SBC was found only for C. gracilis (ANOVA: F = 227170.5, P < 0.001) which had the highest growth rate (0.95 d-1). Significant statistically differences were also found for all species between EBC (ANOVA: F = 2758.6, P < 0.001) and SBC as well (ANOVA: F = 37.7, P = 0.001). The same pattern was also observed for BP (Fig. 4), with lowest values for C. minutissima (75-203 µg.l-1.d-1). Only in C. gracilis there was a significant difference between EBC and SBC (ANOVA: F = 9.8, P = 0.012), while BP was different for between EBC (ANOVA: F = 9.3, P = 0.011) and SBC (ANOVA: F = 38.7, P = 0.001) for all species. Bacterial growth efficiency (Fig. 5) ranged between 19.0-79.4%. Only for C. gracilis there was significant differences between EBC and SBC (ANOVA: F = 113, P = 0.002), while all species had significant different BGE in the EBC (ANOVA: F = 11, P = 0.007) and SBC (ANOVA: F = 20.5, P = 0.004) as well. The decrease in dissolved oxygen (Fig. 6) followed the same decreasing trend but the consumption rate was different in the batch cultures. The highest oxygen consumption rates were measured in D. tertiolecta cultures (0.13 and 0.26 mmol.L-1.d-1 in EBC and SBC respectively) and the lowest in C. minutissima (0.008 and 0.009 mmol.L-1.d-1 in EBC and SBC respectively). Overall statistical results are shown in Table 1. In order to assess for any effects due to different initial DOC concentrations between the two types of cultures, values of some of the bacterial were normalised for the initial DOC concentrations (Hopkinson et al., 1998). Normalised DOC degradation rate ranged between 28.4 ±
6.8-351.9 ± 80.9 µgC.mgDOC-1.d-1. Statistically significant differences between EBC and SBC were found only for C. gracilis EOC (ANOVA: F = 158.8, P < 0.001) and between all species for both the EBC (ANOVA: F = 25.5, P = 0.001) and SBC (ANOVA: F = 14.6, P = 0.005). Normalised µ ranged from 0.009 to 0.026 d-1.mgDOC-1.L-1 and statistically significant differences between EBC and SBC were found only for C. gracilis EOC (ANOVA: F = 732.4, P < 0.001) and between species for both the EBC (ANOVA: F = 115.8, P < 0.001) and SBC (ANOVA: F = 42.5, P < 0.001). Normalised BP ranged from 2.5 ± 0.9 to 67.9 ± 20.2 µgC.mgDOC-1.d-1. Statistically significant differences between EBC and SBC were found only for C. gracilis EOC (ANOVA: F = 8.7, P = 0.042) and between all species for both the EBC (ANOVA: F = 7.7, P = 0.022) and SBC (ANOVA: F = 55.9, P < 0.001). Normalised OC rate ranged between 0.003-0.078 d-1. Statistically significant differences between EBC and SBC were found for D. tertiolecta (ANOVA: F = 19.4, P < 0.05) and C. gracilis (ANOVA: F = 23.2, P < 0.01) and between all species for both the EBC (ANOVA: F = 159.8, P < 0.001) and SBC (ANOVA: F = 75.4, P < 0.001).
Discussion In this paper, the degradation and uptake by natural marine bacteria of EOC produced by three microalgal species in batch cultures of different growth phase was investigated. Although the relationship between algal EOC and bacteria is significant for the carbon budget in the marine environment, the majority of the related studies focus in field measurements. However, in natural populations, both algal release of DOC and bacterial utilisation occur simultaneously which renders the accurate interpretation of algal
248
MARINE BACTERIAL GROWTH ON MICROALGAL DOM
Figure 5. Bacterial growth efficiency (BGE) of marine bacterial batch cultures, using the extracellular organic carbon (filtrate) from the exponential (EBC) and stationary (SBC) phase of three marine microalgal species as growth medium. Bars indicate standard error. Figure 5. Efficacité de croissance (BGE) des cultures bactériennes se développant sur le carbone organique extracellulaire des phases exponentielle (EBC) et stationnaire (SBC) des trois espèces phytoplanctoniques. Les barres indiquent l’erreur standard.
Figure 6. Oxygen consumption rate of marine bacterial batch cultures, using the extracellular organic carbon (filtrate) from the exponential (EBC) and stationary (SBC) phase of three marine microalgal species as growth medium. Bars indicate standard error. Figure 6. Taux de consommation d’oxygène des cultures batériennes se développant sur le carbone organique extracellulaire des phases exponentielle (EBC) et stationnaire (SBC) des trois espèces phytoplanctoniques. Les barres indiquent l’erreur standard.
K.A. KORMAS
EOC uptake by bacteria rather difficult. Also, bacteria in the marine environment experience often and sudden shifts in the available DOC due to other sources (e.g. terrestrial input of DOC, transport of water masses with more/less refractory DOC), thus masking the real effect of phytoplankton EOC. However, the use of degradation experiments with batch cultures has some disadvantages. Since the algal cultures were not axenic, some of the attached bacteria might be important in abundance and/or activity. Thus, in non-axenic cultures the filtrate is not the real EOC release, but rather some of DOC released that is not fully utilized by these bacteria. However, in the present study, the abundance of free bacteria in the algal cultures was low. Finally, some caution on the interpretation of the results should be taken into account as the calculation of parameters, such as BGE, based on indirect measurments like DOC degradation and oxygen consumption rates instead of direct biomass measurments, can lead to overestimation of these paremeters. Bacterial yield, growth rate, production and growth efficiency in cultures containing EOC came from either the exponential or the stationary algal growth phase were significantly different between the studied species. These bacterial parameters, when normalised for the initial DOC concentrations, were still different. This suggests that the observed differences in bacterial activity occurred from the qualitative differences of the phytoplankton DOC and not from the differences in the initial EOC concentrations. The different chemical composition of algal cells as well as factors regulating release rates are most likely to be the cause of such differences (Myklestad, 2000). Of all three species studied, only the bacterial cultures growing on EOC from the Chaetoceros gracilis cultures showed different response between the EOC coming from the exponential growth phase and the EOC from the stationary phase. In particular, it was found that the oxygen consumption rate was higher in the SBC but bacterial growth rate and BGE were lower in the SBC than in the EBC. It is known that in the initial stages of phytoplankton cultures, most of the EOC consists of low molecular weight (LMW) DOC while high molecular weight (HMW) dominates EOC at late stages (Itturiaga & Zsolnay, 1983). LMW EOC seems to be more assimilable by bacteria than HMW (Malej & Harris, 1993; Maurin et al., 1997). The lower bacterial utilisation of EOC from the algal stationary phase could be due to the more complex nature of the HMW (e.g. polysaccharides) and the increased susceptibility to coagulation. Also, it is known that the genus Chaetoceros has a relatively higher extracellular production than other genera also when compared with several other algal classes (Myklestad, 2000). This increased release rate would produce more refractory material in the stationary phase than in the exponential. For example, in Chaetoceros affinis the
249
ratio of exponential to stationary photosynthetic extracellular release was between 17.2-78.4% (Obernosterer & Herndl, 1995). Overall, the values BGE reported here are higher than those from natural systems with sources of organic matter other than EOC. Although there are discrepancies in the calculation of BGE by differenet ways (Anderson & Turley, 2003), the higher BGE reflects the higher lability of phytoplankton EOC (del Giorgio & Cole, 1998). In this study, although the labile EOC ranged between 8.6 to 38.1%, only in the case of Dunaliella tertiolecta in both the EBC and SBC and Chaetoceros gracilis in the SBC the oxygen consumption was rapid and oxygen concentrations reached close to analytical zero in a few days. This suggests that the EOC from these two species might be more labile than that of Chlorella minutissima. One important aspect of phytoplankton EOC is the cell size. It is believed that small cells release EOC at a higher rate than larger cells due to a higher surface to volume ratio (Malinsky-Rushansky & Legrand, 1996). But does this difference affect subsequent bacterial utilisation of EOC? In the present study, this was obvious only in the respiration of the EOC where the largest of the three species, Dunaliela tertiolecta, had the highest oxygen consumption rates and the smallest, Chlorella minutissima, the lowest. However, this trend was not followed for the bacterial activity parameters implying that that the respiration and utilisation of EOC are not coupled. This is also supported by the DOC normalised values of the measured parameters. In the field, most phytoplankton cells and for most of the year live under suboptimal conditions. Under such conditions the release rate of EOC is increased and the quality of EOC is also different (e.g. Malej & Harris, 1993; Obernosterer & Herndl, 1995; Teira et al., 2001). It is believed that high photosynthetic extracellular release is a feature of the ultra-oligotrophic Mediterranean Sea (Anderson & Turley, 2003). The contribution of such labile carbon by certain algal species, like the ones of the present study, and its susequent utilisation by bacterioplankton may facilitate the contrusction of more accurate carbon budget models. In conclusion, the EOC produced by Chaetoceros gracilis during the exponential growth phase caused a higher bacterial activity than the EOC of the stationary growth phase. Dunaliela tertiolecta and C. gracilis caused a more intense bacterial response with their exponential growth phase EOC while for the stationary phase EOC, most of the measured bacterial parameters were higher for D. tertiolecta bacterial cultures. Acknowledgments The author would like to thank Eleftheria Kastrissiou and Triantafillos Tafas for their valuable help on the phyto-
250
MARINE BACTERIAL GROWTH ON MICROALGAL DOM
plankton cultures. This work was supported by a post doctoral fellowship awarded to the author by the Greek Foundation of State Scholarships (IKY).
References Anderson T.R. & Ducklow H.W. 2001. Microbial loop carbon cycling in ocean environments studied using a simple steadystate model. Aquatic Microbial Ecology, 26: 37-49. Anderson T.R. & Turley C.M. 2003. Low bacterial growth efficiency in the oligotrophic Mediterranean Sea: a modelling analysis. Journal of Plankton Research, 25: 1011-1019. Azam F., Smith D.C., Steward G.F. & Hagström Å. 1993. Bacteria–organic matter coupling and its significance for oceanic carbon cycling. Microbial Ecology, 28: 167-179. Bjørnsen P.K. 1988. Phytoplankton exudation of organic matter: Why do healthy cells do it? Limnology and Oceanography, 33: 151-154. Bratbak G. 1985. Bacterial biovolume and biomass estimations. Applied and Environmental Microbiology, 49: 1488-1493. Carpenter J.H. 1965. The Chesapeake Bay Institute technique for the Winkler dissolved oxygen method. Limnology and Oceanography, 10: 141-143. Casamatta D.A. & Wickstrom C.E. 2000. Sensitivity of two disjunct bacterioplankton communities to exudates from the cyanobacterium Microcystis aeruginosa Kützing. Microbial Ecology, 40: 64-73. Coffin R.B., Connolly J.P. & Harris P.S. 1993. Availability of dissolved organic carbon to bacterioplankton examined by oxygen utilization. Marine Ecology Progress Series, 101: 9-22. Cole J.J., Findlay S. & Pace M.L. 1988. Bacterial production in fresh and saltwater ecosystems: a cross-system overview. Marine Ecology Progress Series, 43: 1-10. Corzo Amorillo J.A. & Rodríguez S. 2000. Production of transparent exopolymer particles (TEP) in cultures of Chaetoceros calcitrans under nitrogen limitation. Aquatic Microbial Ecology, 23: 63-72. del Giorgio P.A. & Cole J.J. 1998. Bacterial growth efficiency in natural aquatic systems. Annual Reviews of Ecology and Systematics, 29: 503-41. Dubinsky Z. & Berman-Frank I. 2001. Uncoupling primary production from population growth in photosynthesizing organisms in aquatic ecosystems. Aquatic Sciences, 63: 4-17. Hellebust J.A. 1974. Extracellular products. In: Algal physiology and biochemistry (W. Stewart ed.), pp. 838–859. Blackwell: Oxford. Hopkinson C.S., Buffam I., Hobbie J., Vallino J., Perdue M., Eversmeyer B., Prahl F., Covert J., Hodson R., Moran M.A., Smith E., Baross J., Crump B., Findlay S. & Foreman K. 1998. Terrestrial inputs of organic matter to coastal ecosystems: an intercomparison of chemical characteristics and bioavailability. Biogeochemistry, 43: 211-234. Itturiaga R. & Zsolnay A. 1983. Heterotrophic uptake and transformation of phytoplankton extracellular products. Botanica Marina, 26: 375-381. Kaltenböck E. & Herndl J.G. 1992. Ecology of amorphous aggregations (marine snow) in the Northern Adriatic Sea. IV.
Dissolved nutrients and the autotrophic community associated with marine snow. Marine Ecology Progress Series, 87: 147-159. Lignell R. 1990. Excretion of organic carbon by phytoplankton: its relation to algal biomass, primary productivity and bacterial secondary productivity in the Baltic Sea. Marine Ecology Progress Series, 68: 85-99. Maurin N., Amblard C. & Bourdier G. 1997. Phytoplanktonic excretion and bacterial reassimilation in an oligomesotrophic lake: molecular weight fractionation. Journal of Plankton Research, 19: 1045-1068. Malej A. & Harris R.P. 1993. Inhibition of copepod grazing by diatom exudates: a factor in the development of mucus aggregates? Marine Ecology Progress Series, 96: 33-42. Malinsky-Rushansky N.Z. & Legrand C. 1996. Excretion of dissolved organic carbon by phytoplankton of different sizes and subsequent bacterial uptake. Marine Ecology Progress Series, 132: 249-255. Massana R., Gasol J.M., Bjørnsen P.K., Blackburn N., Hagström Å., Hietnanen S., Hygum B.H., Kuparinen J. & Pedrós-Alió C. 1997. Measurement of bacterial size via image analysis of epifluoresence preparations: description of an inexpensive system and solutions to some of the most common problems. Sciencia Marina, 61: 397-407. Myklestad S.M. 2000. Dissolved organic carbon from phytoplankton. In: The handbook of environmental chemistry vol. 5 Part D. Marine chemistry (P. Wangersky ed), pp. 111-148. Springer-Verlag: Berlin. Nagata T. 2000. Production and mechanisms of dissolved organic matter. In: Microbial ecology of the oceans (Kirchman ed.), pp. 121-152. John Wiley & Sons: New York. Obernosterer I. & Herndl G.H. 1995. Phytoplankton extracellular release and bacterial growth: dependence on the inorganic N:P ratio. Marine Ecology Progress Series, 116: 247-257. Rhee G.Y. & Thompson PA. 1992. Sorption of hydrophobic organic contaminants and trace metals on phytoplankton and implications for toxicity assessment. Journal of Aquatic Ecosystems Health, 1: 175-191. Sharp J.H. 1977. Excretion of organic matter by marine phytoplankton: do healthy cells do it? Limnology and Oceanography, 22: 381-399. Sugimura Y. & Suzuki Y. 1988. A high-temperature catalytic oxidation method for the determination of non-volatile dissolved organic carbon in seawater by direct injection of a liquid sample. Marine Chemistry, 24: 105-131. Teira E., Pazo, M.J., Serret P. & Fernandez E. 2001. Dissolved organic carbon production by microbial populations in the Atlantic ocean. Limnology & Oceanography, 46: 1370-1377. Thiel-Nielsen J. & Søndergaard M. 1998. Bacterial carbon biomass calculated from biovolumes. Archives of Hydrobiology, 141: 195-207. Turley C.M. 1993. Direct estimates of bacterial numbers in seawater samples without incurring cell loss due to sample storage. In: Handbook of methods in aquatic microbial ecology, (P.F. Kemp, B.F. Sherr, E.B. Sherr & J.J. Cole eds), pp. 143148. Lewis Publishers: Boca Raton. Walne P.R. 1966. Experiments in the large scale culture of the larvae Ostrea edulis. Fishery Investments London Series II, 25, 53 pp.
K.A. KORMAS
Watanabe M. & Oishi S. 1985. Effects of environmental factors on the toxicity of a Cyanobacterium (Microcystis aeruginosa) under culture conditions. Applied and Environmental Microbiology, 49: 1342-1344. Wehr J.D., Petersen J. & Findlay S. 1999. Influence of three contrasting carbon sources on planktonic bacterial metabolism in a mesotrophic lake. Microbial Ecology, 37: 23-35. Williams P.J. le B. 2000. Heterotrophic bacteria and the dynamics of dissolved organic material. In: Microbial ecology of the oceans, (Kirchman ed.), pp. 153-200. John Wiley & Sons:
251
New York. Witek Z., Ochocki S., Maciejowska M., Pastuszak M., Nakonieczny J., Podgorska B., Kownacka J.M., Mackiewicz T. & Wrzesinska-Kwiecien M. 1997. Phytoplankton primary production and its utilization by the pelagic community in the coastal zone of the Gulf of Gdansk (southern Baltic). Marine Ecology Progress Series, 148: 169-186. Zar J.H. 1998. Biostatistical analysis. Prentice Hall: Engelwood Cliffs, 929 pp.