Social Networks North-Holland
13 (1991) 141-154
141
Centrality in valued graphs: A measure of betweenness based on network flow Linton C. Freeman a, Stephen and Douglas R. White a
P. Borgatti
b
I School of Social Sciences, University of California, Irvine, CA 92717, USA .’ Department
of Soc~ologv, University of South Carolina, Columbia,
SC 29208, USA
A new measure of centrality, C,, is introduced. It is based on the concept of network flows. While conceptually similar to Freeman’s original measure, Ca, the new measure differs from the original in two important ways. First, C, is defined for both valued and non-valued graphs. This makes C, applicable to a wider variety of network datasets. Second, the computation of C, is not based on geodesic paths as is C, but on all the independent paths between all pairs of points in the network.
1. Introduction Concern with centrality stems from two quite different structural intuitions. First there are those who view a person as central in a social network to the extent that he or she is somehow close to everyone else in the network (Bavelas 1950; Katz 1953; Shaw 1954; Harary 1959; Faucheux and Moscovici 1960; Garrison 1960; Beauchamp 1965; Pitts 1965; Hubbell 1965; Mackenzie 1966; Sabidussi 1966; Bonacich 1972, 1987; Coleman 1973; Nieminen 1973, 1974; Moxley and Moxley 1974; Rogers 1974; Czepiel 1974; Kajitani and Maruyama 1976; Burt 1982; Mizruchi, Mariolis, Schwartz and Mintz 1986; Stephenson and Zelen 1989; Friedkin 1991). This view of centrality is motivated by the idea that a person who is close to others will have access to more information (Leavitt 1951; Sabidussi 1966; Stephenson and Zelen 1989) have higher status (Katz 1953; Hubbell 1965), have more power (Coleman 1973; Bonacich 1987), have greater prestige (Burt 1982) or have greater influence (Friedkin 1991) than others. 037%8733/91/$03.50
0 1991 - Elsevier Science Publishers
B.V. All rights
reserved
142
L.C. Freeman et al. / Centrality m valued graphs
The second intuition grows out of the idea that people are somehow central to the degree they stand between others on the paths of communication (Bavelas 1948; Shimbel 1953; Shaw 1954; Cohn and Marriott 1958; Anthonisse 1971; Freeman 1977; Friedkin 1991). Such people can facilitate or inhibit the communication of others and are, therefore, in a position to mediate the access of others to information, power, prestige or influence. The present paper is intended as a contribution to the betweennessbased conception of centrality. In particular, we will introduce a new measure of centrality C, that is designed to overcome some of the limitations of existing measures. In the next section we will begin with a review of the earlier betweenness-based measures.
2. The C, family of betweenness-based
measures
A family consisting of three betweenness-based measures of centrality were introduced by Freeman (1977). These measures are grounded in graph theory. Consider anordinarygraphG=(P, E). Let P={x,, x,, . ..} bea finite non-empty set containing n points, that here represent people. Pairs of points are linked by an irreflexive symmetric relation E, that defines edges linking pairs of points in S. For present purposes we may consider that a pair of points is linked by an edge, (x1, xi) E E, if and only if x, and xj interact with each other or are somehow socially linked. Two points in such a graph are said to be adjacent if they are linked by an edge. A walk is an alternating sequence of points and edges where each edge is linked to both the preceding and succeeding point. A walk begins and ends with a point. If every point and edge in a walk is distinct (different) it is a path. Points that are linked by a path are said to be reachable. Moreover, a path that begins and ends with the same point is called a cycle. Finally, the length of a path is the number of edges it contains, and a geodesic is any shortest path linking two points. The measures of betweenness are based on the assumption that information is passed from one person to another only along the shortest paths linking them. The betweenness C,( x1) of a point x1, therefore, requires an examination of the geodesics linking pairs of
L. C. Freeman ei al. / Centrality in valued graphs
143
other points. If g,k is the number of geodesics linking points xj and xk in a graph, and gjk( xi) is the number of such paths that contain point xi, then b,k(x,)
=
!!!&A I
is the proportion of geodesics linking xi and xk that contain xi. To determine the centrality of point xi, we sum all these values for all unordered pairs of points where j < k and i #j # k
This provides a measure of the overall centrality of point x, in the graph. This measure may be normalized by dividing cB( xi) by its maximum possible value. Freeman (1977) proved that, for any graph containing n points, that maximum is n2 -3n+2
2
.
Therefore,
cL(x;) =
2cd4
(4
n2 -3n+2
is a normalized measure that varies between 0 and 1. An overall index of the centralization of a graph C, was also defined. It is based on the intuition that a graph is centralized to the degree that is communication flow is overwhelmingly dominated by a single point. The measure was defined as the average difference between the normalized centrality of the most central point CL< p* ) and the normalized centralities of all other points in the graph:
2
c,=
-
E(P*>
i=l
n-1
GXPAI
(3)
144
L.C. Freeman et al. / Centrahty in valued graphs
These three measures have been used in a number of applications (see, in particular, Pitts 1979 and Hage and Harary 1981; Knoke and Burt 1983; Bolland 1988). But, from the beginning, it was apparent that they contained two unfortunate restrictions. In the first place, these measures are defined only for simple graphs. While conceptually elegant, as representations of human relationships, such binary structures leave something to be desired. As Peay (1976, p. 56) put it, binary modeling flies in the face of common sense in that: . . . it encompasses only qualitative relationships. This precludes the possibility of considering such variables as strength of relationship [or] amount of social interaction ...
Peay’s view is widely held. Since the 1940s structural analysts have questioned the binary approach (Festinger 1949; Levi-Strauss 1963; Hubbell 1965; Doreian 1969; Lorrain and White 1971; Alba 1973; Peay 1974, 1980; Seidman and Foster 1978; Yee 1980; Marsden and Laumann 1984; Yan 1988). The consensus is that binary representations fail to capture any of the important variability in strength displayed in actual interpersonal relationships. There measures are also restricted, and potentially misleading, as a consequence of their exclusive focus on geodesic paths. As Stephenson and Zelen (1989) suggested, there is no reason to believe that communication between a pair of persons takes place only on the shortest paths linking them. As they put it: It is quite possible that information will take a more circuitous route either by random communication or may be intentionally channeled through many intermediaries ... These measures, then, are probably unrealistic in their characterization of human communication. In the next section we will introduce a less restricted alternative to C,, based on Ford and Fulkerson’s (1956, 1957, 1962) model of network flows.
3. Valued graphs, network flow and betweenness A valued graph begins with the ordinary graph G = (P, E) defined above. A numeric value is associated with each edge in E by defining a
L.C. Freeman et al. / Centrality in valued graphs
145
function, or mapping, C from the Cartesian product S X S to some subset of the non-negative integers. This function can be used to represent a measure of social proximity between pairs of persons. Its values indicate the strength of the social linkage connecting each pair of individuals in S. For any pair of individuals i and j, the magnitude of cii may reflect their amount of interaction, the time they spend in one another’s company, the range of different social settings in which they interact or any other reasonable index of the strength of the social linkage between them. This proximity function C is governed by two rules:
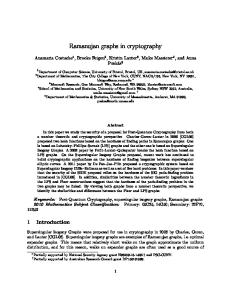
(2) c,, = C/I. Thus, a pair of points have a proximity of 0 if and only if they are not connected by an edge in E. And, since we are dealing somehow with interaction the proximity of a point xi with another xi is always equal to the proximity of x, to xi. A valued graph based on hypothetical social proximities is shown in Figure 1. If we think of the edges of the graph as channels of communication linking pairs of people, then the value of the connection linking two people determines the capacity of the channel linking them, or the maximum amount of information that can be passed between them. A pair of individuals who are socially close are connected by a channel of
Fig. 1. A valued graph.
146
L.C. Freeman et al. / Centralit); in valued graphs
large capacity. Pairs who are less close are connected by channels of channels. And a pair with no social lower capacity - “ narrower” connection have no channel through which to pass information. Information is assumed to flow along these channels. If f,, is the amount of information passing on a channel linking x, directly to x,, then
and the amount of information flowing along a channel that directly links adjacent points cannot exceed the capacity of that channel. And, of course, if x and y are not adjacent, then the capacity of the channel linking them directly is zero, and there can be no direct flow from one to the other. We are concerned here, not with direct flow between adjacent points, but with the overall flow between pairs of points along all the paths that connect them. If we choose some point xi as an information source, or transmitter, and another point x, as an information sink, or receiver, information from X, may reach xJ by flowing along an edge linking x, directly to x, and along any and all indirect paths that begin at x,, pass through one or more intermediate points, and end at x,. Thus, as it is conceived here, the flow between two points is a global phenomenon; it depends, not just on the capacity of the channel linking the points directly, but on the capacities of all the channels on all the paths - both direct and indirect - that connect the two. Ford and Fulkerson (1956, 1957, 1962) introduced a model designed specifically to assess this kind of network flow. Their model defines a flow from a source x, to a sink x,. Flow is constrained only by the channel capacities and by two additional conditions: (1) the flow out of x, must be equal the flow into x,, and (2) the flow out of each intermediate point on any indirect path connecting x, to x, must be equal to the flow into that point. Given these conditions, Ford and Fulkerson provide a way to determine the maximum possible flow from any source x, to any sink x,. To do so we need to find the i-j cut sets. An i-j cut set E,, is a subset of edges in E such that every path from x, to xj contains an edge in El,. It is called an i-j cut set because if the edges in E,, were “Cut,” or removed from the graph, x, would no longer be reachable
L.C. Freeman et al. / Ceniraliiy in valued graphs
Fig. 2. Maximum
flow from a to c in the graph
147
of Fig. 1
from x,. Any set of edges in E that meet this condition is an i-j cut set. In Figure 1, for example, the set of all edges, if removed, would make communication between point a and point c impossible; they are an u-c cut set. But so are the three edges (a, b), (a, d) and (a, c), as well as the three (d, c), (b, c) and (a, c). Any collection of edges that cut a off from c are an u-c cut set. The capacity of a cut set is the sum of the capacities of the individual edges making up the set. Thus, the capacity of the cut set consisting of all the edges in Figure 1 is 13, and the capacity of the (a, b), (a, d), (a, c) cut set is 6. The minimum cut capacity from xi to xi is the smallest capacity of any of the i-j cut sets. It is apparent that no flow from xi to x, can be greater than the minimum cut capacity from x, to xi. And Ford and Fulkerson (1962) in their famous min-cut, mux-flow theorem, proved that the maximum flow from xi to xi is exactly equal to that minimum cut capacity. The maximum flow from point a to point c in the graph of Figure 1 is shown in Figure 2. Several algorithms for calculating the maximum flow between two points in a valued graph exist (Ford and Fulkerson 1957; Dinic 1970; Karzanov 1974). This ability to determine maximum flows suggests a natural extension of the measure of centrality discussed above. In extending the betweenness model to valued graphs a point xi will be seen as standing between other points to the degree that the maximum flow between those points depends on x,. Let mjk be the maximum flow from a point xi to another xk. And let mjk(xI) be the
148
L.C. Freeman et al. / Centrality in valued graphs
maximum flow from x, to xk that passes through point x,. Then the degree to which the maximum flow between all unordered pairs of points depends on x,, where j
G(x,> = t t m.;kbJ.
(1’)
l
If we divide the flow that passes through x, by the total flow between all pairs of points where x, is neither a source nor a sink, we can determine the proportion of the flow that depends on x,
kfm,k(X,) G(A)
=
“‘,”
n
cc
(2’) mJk
.
.i
This produces a measure that varies between 0 and 1. We can also determine the centralization of the valued graph exactly as it was done in the unvalued case. If Cb( p * ) is the normalized centrality of the most central point, then
i [G(P*> - G(PJl c,= r=l n-l
(3’)
is the average difference between the centrality of the most central point and that of all other points. To illustrate, let us consider the flows through point b in Figure 1. The maximum flow from a to c is already shown in Figure 2. It is 6 units. To achieve this maximum, 3 units must flow through b. The flow from a to d is, by the same reasoning, 4 units. Two units flow directly on the (a, d) link. One unit may flow from a to c to d, but in order to get the maximum, at least 1 unit must pass through b. Two units pass from a to e, but b is not required for their flow. Four units flow from c to d, and again, b is required to pass at least 1 unit. Point b, however, is not involved in the 2 units that flow from c to e, nor in the 2 units that flow from A to e.
L.C. Freeman et al. / Centrality Table 1 Centralities
of points
in the graph
in valued graphs
149
of Fig. 1
Point
Max flow between all other points
a b
20 20
7 5
0.35 0.25
fi e
24 20 30
136 0
0.25 0.65 0.00
CAP,)
G(P,)
Thus, the total maximum flow between all pairs of points (where b is neither a source nor a sink) is 6 + 4 + 2 + 4 + 2 + 2 = 20 units. Of these, 3 + 1 + 0 + 1 + 0 + 0 = 5 must pass through b and C,(b) = 5. Point b, then is necessary for the flow of 5/20 = 0.25 of the flow among pairs of other points and Ci( b) = 0.25. If we use this same procedure to calculate the flows through all points in the graph of Figure 1, we can determine both C,( p,) and Cf( pi) for every point in the graph. This produces the flow-based centralities shown in Table 1. Thus, c is the most central point. The average difference between the relative centrality of c and that of the other points is C, = 0.43 which provides the required index of the centralization of the valued graph of Figure 1.
4. Relating C, to C, The flow-based measures of centrality can be applied to ordinary non-valued graphs by assigning all edges the uniform value of 1. The C, measures will not yield the same results as the C, indices except in the special case where set of paths linking each pair of points is equal to the set of geodesic linking those points. Consider, for example, an ordinary graph without cycles. Whenever a graph contains no cycles, every pair of points in that graph is either (1) reachable by a single path, or (2) unreachable. When a single path links a pair of points then that path is necessarily a geodesic. C,( x,) in that case is simply a count of the number of geodesics linking all pairs of points that contain xi. And CL(x,) is the proportion of geodesics that contain xi_
150
L.C. Freeman et al. / Centrality in valued graphs
Fig. 3. A five point star graph
Now let that ordinary acyclic graph be a valued graph with the values of all edges set uniformly to 1. When the capacities of all channels in a an acyclic valued graph are uniformly set at 1, the maximum flow between any reachable pair of points must be exactly 1. The maximum flow, therefore, is equal to the number of geodesics in the graph, and C,(x,) = cr(xi) and CL(x,) = CA(x,). Consider, for example, the star of Figure 3. The flow-based centralities for the star are shown in Table 2. These centralities are the same as those calculated from the betweenness-based measures (Freeman 1977). In general, the C, measures will be equal to the C, measures only for graphs where the number of edge-independent paths linking any two points is equal to the number of geodesics. Such graphs cannot contain cycles since any adjacent points in a cycle will be linked by two edge-independent paths but only one geodesic. Connected graphs without cycles (i.e., trees) have only one path - a single geodesic linking any pair of points. When there are no alternate paths, the
Table 2 Centralities
of points
in the star of Fig. 3
Point
Max flow between all other points
CAP,)
CA PI)
(I h
6 6
6 0
1.00 0.00
zi r
6 6
0 0
0.00 0.00
L.C. Freeman et al. / Centrality in oalued graphs
151
counts tabulated by the betweenness measures must equal the flows of the flow-based measures. When cycles are present, however, C, and C, will differ. That is because the C, measures record flow only along geodesics, while the C, measures are responsive to all (edge-independent) paths along which information can flow. Therefore, the two kinds of measures will produce different results for any graph that contains any cycles.
5. Summary and conclusions In summary, this paper has introduced three new flow-based measures of centrality. These new measures differ from the earlier C, family of measures in two important ways. First, the C, measures restrict the analysis of centrality to data on interpersonal linkages that can be represented in binary terms. In contrast, the measures introduced here permit the use of valued data that record the strengths of people’s social connections. The new measures, then, are responsive to subtle differences in the strengths of the relationships linking various pairs of individuals. Second, the C, measures focused exclusively on the shortest paths, or geodesics, linking pairs of individuals. Instead, the measure introduced here determine flows on the basis of all the independent paths in the network. Since there is no reason to believe that people restrict their communication to the shortest paths in their networks, the new measures are probably more realistic in depicting network structure. While the new flow-based measures may be used with binary data, they will generally produce somewhat different results than those yielded by the older binary measures. The two kinds of measures will produce the same results when they are both applied to graphs without cycles. But when cycles are present, the flow-based measures will determine betweenness in terms of all the paths connecting pairs of points, while the earlier binary measures will arrive at an index based only on the geodesic paths. Users will have to decide which kind of model is appropriate in each particular application.
152
L.C. Freeman et al. / Centrality in oalued graphs
References Alba, Richard D. 1973 “A graph theoretic definition of a sociometric clique.” Jotuna/ o/Mathemattcal Sociology 3: 113-126. Anthonisse, J.M. 1971 The Rush in a Graph. Amsterdam: Mathematisch Centrum. Bavelas, Alex 1948 “A mathematical model for small group structures.” Human Organiratmn 7: 16-30. Bavelas, Alex 1950 “Communication patterns in task oriented groups.” Journal of the Acourttcal Society of Amertca 22: 271-282. Beauchamp, Murray A. 1965 “An improved index of centrality.” Behavioral Science IO: 161-163. Bolland, John M. 1988 “Sorting out centrality: An analysis of the performance of four centrality models in real and simulated networks.” Social Networks 10: 233-253. Bonacich, Phillip 1972 “Factoring and weighting approaches to status scores and clique identification.” Journal of Mathematical Sociology 2: 113-120. Bonacich, Phillip American Journal of Socioiow 92: 1987 “Power and centrality: A family of measures.” 1170-1182. Burt, Ronald S. 1982 Toward a Structural Theory of Action. New York: Academic Press. Cohn, B.S. and M. Marriott 1958 “Networks and centres of integration in Indian civilization.” Journal of Social Research I: 1-9. Coleman, James S. 1973 The Mathematics of Collective Action. Chicago: Aldine. Czepiel, J.A. 1974 “Word of mouth processes in the diffusion of a major technological innovation.” Journal of Marketing Research 1 I: 172-l 80. Dinic. E.A. 1970 “Algorithm for the solution of a problem of maximum flow in a network with power estimation.” Soviet Math. Doki. II: 1277-1280. Doreian, Patrick 1969 “A note on the detection of cliques in valued graphs.” Sociometry 32: 237-242. Faucheux, C. and S. Moscovici 1960 “Etudes sur la creativite des groupes thches, structures des communications et performances des groupes,” Bulletin du C.E. R.P. 9: 11-22. Festinger, Leon 1949 “The analysis of sociograms using matrix algebra.” Human Relations IO: 153-158. Ford, L.R. and D.R. Fulkerson 1956 “Maximal flow through a network.” Canada Journal of Mathematics 8: 399-404. Ford, L.R. and D.R. Fulkerson 1957 “A simple algorithm for finding maximal network flows and an application Hitchcock problem.” Canada Journal of Mathematics 9: 210-218. Ford, L.R. and D.R. Fulkerson 1962 Flows in Networks. Princeton, NJ: Princeton University Press.
to the
L.C. Freeman et al. / Centrality in valued graphs
153
Freeman, Linton C. 1977 “A set of measures of centrality based on betweenness.” Sociometry 40: 35-41. Friedkin, Noah E. 1991 “Theoretical foundations for centrality measures.” American Journal of Sociology (in press). Garrison, William L. 1960 “Connectivity of the interstate highway system.” Papers and Proceedings of the Regional Science Association 6: 121-137. Hage, Per and Frank Harary 1981 “Mediation and power in Melanesia.” Oceania 52: 124-135. Harary, Frank 1959 “Status and contrastatus.” Sociometry 22:23-43. Hubbell, Charles H. 1965 “An input-output approach to clique identification.” Sociometry 28: 377-399. Kajitani, Y. and T. Maruyama 1976 “Functional expression of centrality in a graph - an application to the assessment of communication networks.” Electronics and Communication in Japan 59-A: 9-17. Karzanov, A.V. 1974 “Determining the maximal flow in a network by the method of preflows.” Soviet Math. Dokl. 15: 434-437. Katz, Leo 1953 “A new status index derived from sociometric analysis.” Psychometrika 18: 39-43. Knoke, David and Ronald S. Burt 1983 “Prominance,” in: R.S. Burt and M.J. (eds.) Applied Network Analysis. Newbury Park, CA: Sage. Leavitt, Harold J. 1951 “Some effects of communication patterns on group performance.” Journal of Abnormal and Social Psychology 46: 38-50. Levi-Strauss, Claude 1963 Structural Anthropology. New York: Basic Books. Lorrain, Franqois P. and Harrison C. White 1971 “Structural equivalence of individuals in social networks.” Journal of Mathematical Sociology I: 49-80. Mackenzie, Kenneth D. 1966 “Structural centrality in communications networks.” Psychometrika 31: 17-25. Marsden, Peter V. and Edward. 0. Laumann 1984 “Mathematical ideas in social analysis.” Journal of Mathematical Sociology IO: 271-294. Mizruchi, Mark S., Peter Mariolis, Michael Schwartz and Beth Mintz 1986 “Techniques for disaggregating centrality scores in social networks” in: N.B. Tuma (ed.) Sociological Methodology, 1986. San Francisco: Josey-Bass. Moxley, R.L. and N.F. Moxley 1974 “Determining point-centrality in oncontrived social networks.” Sociometry 37: 122-130. Nieminen, J. 1973 “On the centrality in a directed graph.” Social Science Research 2: 371-378. Nieminen, J. 1974 “On centrality in a graph.” Scandinavian Journal of Psychology 15: 322-336. Peay, Edmund R. 1974 “Hierarchical clique structures.” Sociometv 37: 54-65. Peay, Edmund R. 1976 “A note concerning the connectivity of social networks.” Journal of Mathematical Sociology 4: 319-321.
154
L.C. Freeman et al. / Centrality in oalued graphs
Peay, Edmund R. 1980 “Connectedness in a general model for valued networks.” Social Networks 2: 385-410. Pitts, Forrest R. 1965 “A graph theoretic approach to historical geography.” The Professional Geographer 17: 15-20. Pitts, Forrest R. 1979 “The medieval river trade network of Russia revisited.” Social Networks I: 285-292. Rogers, D.L. 1974 “Sociometric analysis of interorganizational relations: Application of theory and measurement.” Rural Sociology 39: 487-503. Sabidussi, G. 1966 “The centrality index of a graph.” Psychometrika 31: 581-603. Seidman, S.B. and B.L. Foster 1978 “A graph-theoretic generalization of the clique concept.” Journal of Mathematical Sociology 6: 139-154. Shaw, Marvin E. 1954 “Group structure and the behavior of individuals in small groups.” Journal of Psychology 38: 139-149. Shimbel, A. 1954 “Structural parameters of communication networks.” Bulletin of Mathematical Biophysics IS: 501-507. Stephenson, Karen and Marvin Zelen 1989 “Rethinking centrality: Methods and examples.” Social Networks I I: l-37. Yan, Xiaoyan Journal of Mathematical Sociology 13: 359-389. 1988 “On fuzzy cliques in fuzzy networks.” Yee, Leung 1980 “A fuzzy set analysis of sociometric structure.” Journal of Mathematical Sociology 7: 159-180.