Changes in antimicrobial susceptibility in a population of Escherichia coli isolated from feedlot cattle administered ceftiofur crystalline-free acid T. Courtney Lowrance, BS; Guy H. Loneragan, BVSc, PhD; David J. Kunze, MS; Tammy M. Platt, MS; Samuel E. Ives, DVM, PhD; H. Morgan Scott, DVM, PhD; Bo Norby, Cand Med Vet, PhD; Alejandro Echeverry, MS; Mindy M. Brashears, PhD Objective—To determine effects of administration of ceftiofur crystalline-free acid (CCFA) on antimicrobial susceptibility of Escherichia coli in feedlot cattle. Animals—61 feedlot steers. Procedures—A cohort study was conducted. Steers were housed in pens (5 pens with 10 steers and 1 pen with 11 steers). Five steers in each pen were administered CCFA, and 5 served as control steers (1 pen had 6 control steers). The CCFA administration included a single-dose regimen (6.6 mg/kg, SC, on day 0), two-thirds–dose regimen (4.4 mg/kg, SC, on day 0), and 3-dose regimen (6.6 mg/kg, SC, on days 0, 6, and 13). Fecal samples were collected on days 0, 2, 6, 9, 13, 16, 20, and 28. Fecal samples were collected immediately before CCFA administration. Minimum inhibitory concentrations of 15 antimicrobials were determined for 3 E coli isolates/fecal sample. Escherichia coli were enumerated by use of direct-plating techniques. Results—Resistance to 1 or more antimicrobials was detected in 986 of 1,441 (68.4%) isolates recovered. Administration of CCFA was associated with a transient increase in the population of ceftiofur-resistant isolates. Susceptibility returned to day 0 values (ie, samples collected immediately before CCFA administration) approximately 2 weeks after completion of CCFA administration. Agreement between ceftiofur resistance and coresistance to ampicillin, chloramphenicol, streptomycin, sulfisoxazole, and tetracycline was almost perfect (κ, 0.97). We did not detect variation in susceptibility of E coli recovered from commingled control steers. Conclusions and Clinical Relevance—Administration of CCFA provided selection pressure that favored transient expansion of multiple-resistant variants. (Am J Vet Res 2007;68:501–507)
I
t is generally accepted that antimicrobial use provides a selection pressure that favors survival of resistant bacteria. Regardless of the various mechanisms by which bacteria achieve clinically consequential resistance, the public health burden of resistant bacteria is self evident and appears to be increasing.1 Resistant bacteria are associated with treatment failure increased morbidity,2 duration of illness, fatalities,3,4 and health-care costs, relative to outcomes for susceptible bacteria.5,6 In addition, some multiple-resistant variants, such as Salmonella serovars Received October 31, 2006. Accepted November 30, 2006. From the Feedlot Research Group, Department of Agricultural Sciences, College of Agriculture, Science and Engineering, West Texas A&M University, Canyon, TX 79016 (Lowrance, Loneragan, Kunze, Platt); Cactus Feeders, 2209 W 7th St, Amarillo, TX 79106 (Ives); the Department of Veterinary Integrative Biosciences, College of Veterinary Medicine, Texas A&M University, College Station, TX 77843 (Scott, Norby); and the International Center for Food Industry Excellence, College of Agricultural Sciences and Natural Resources, Texas Tech University, Lubbock, TX 79409 (Echeverry, Brashears). Supported by The Beef Checkoff program through the Cattlemen’s Beef Board and by the National Research Initiative of the USDA Cooperative State Research, Education and Extension Service grant no. 2004-35212-14864. Address correspondence to Dr. Loneragan.
ESBL CCFA BRD MIC ACSSuT
Abbreviations Extended-spectrum β-lactam Ceftiofur crystalline-free acid Bovine respiratory disease Minimum inhibitory concentration Ampicillin, chloramphenicol, streptomycin, sulfamethoxazole, and tetracycline
Typhimurium and Newport, appear to be associated with a more severe disease manifestation than is evident for their susceptible counterparts.2,3,7 This is problematic because multiple resistant bacteria are more likely to cause disease with more severity and they are also more likely to survive first-line therapeutic interventions than broadly susceptible variants.8,9 Reduced susceptibility to ESBLs among Salmonella serovars is of substantial concern to public health officials. These ESBLs, such as ceftriaxone (a third-generation cephalosporin), are first-line therapeutic options for treating children with salmonellosis when antimicrobial intervention is indicated.8-10 In 1 report,9 administration of ceftiofur (also a third-generation cephalosporin) to cattle was implicated, albeit controversially, with disease caused by ceftriaxone-resistant Salmonella Typhimurium in a child.
AJVR, Vol 68, No. 5, May 2007
501
In the United States, CCFA is a relatively newly approved single-dose formulation of ceftiofur. It is labeled for use in cattle to treat and control BRD.11 This formulation has a relatively long duration of activity (approx 6 days or longer against BRD pathogens), compared with durations for other ceftiofur formulations.12 The extended duration of CCFA provides substantial opportunities to improve production efficiencies within feedlots in that the antimicrobial only has to be administered once, compared with multiple administrations for other ceftiofur formulations. The long-acting properties of CCFA improve animal health and reduce animal handling and associated labor.13 It has been proposed14 that because ceftiofur is rapidly metabolized in the gastrointestinal environment, there is minimal risk for exposure of enteric bacteria. Even though ceftiofur is metabolized rapidly within the gastrointestinal tract, data reported in another study15 appear to indicate that there may in fact be a detectable effect of ceftiofur on the susceptibility of enteric bacteria. In that study, investigators reported a herd-level association between short-acting ceftiofur and reduced susceptibility to ceftriaxone in Escherichia coli. Therefore, it is possible that the extended duration of efficacious concentration of ceftiofur in plasma following CCFA administration may increase the effective selection pressure on bacteria within the gastrointestinal tract. If so, CCFA administration may select for ceftiofur-resistant bacteria and facilitate their expansion within and among animals. The most immediate public health concern associated with resistance of bacteria to third-generation cephalosporins is resistance to ceftriaxone among Salmonella serovars. Because of the unpredictable prevalence of Salmonella organisms in cattle and the limited within-animal genetic diversity, studies to evaluate the effect of ceftiofur administration on resistance to cephalosporin in Salmonella serovars are not straightforward and would require substantial numbers of animals. It is likely that E coli may serve as a model for the potential effect of CCFA administration on Salmonella serovars because E coli and Salmonella serovars are closely related, the genetic determinants of resistance they may harbor are frequently identical, and their mechanisms of genetic dissemination are similar. Because E coli can be recovered from essentially all cattle and there is substantial within-animal genetic diversity, studies of the effect of ceftiofur administration on E coli require fewer animals to achieve the same statistical power. Therefore, the objective of the study described here was to determine the extent and duration of effects of CCFA administration on antimicrobial susceptibility of non– type-specific E coli in feedlot cattle. Materials and Methods Animals—Sixty-one steers were used in a prospective cohort study. Steers were allocated to 6 pens (5 pens contained 10 steers each, and 1 pen contained 11 steers). All procedures used were reviewed and approved by the Amarillo-Area Cooperative Research, Education, and Extension Triangle Animal Care and Use Committee (protocol No. 2006-02). 502
Four cohorts were included in the study. Cohort 1 comprised 10 steers (5 steers in each of 2 pens); these steers were administered CCFAa as a single-dose regimen (6.6 mg/kg, SC, on day 0). Cohort 2 comprised 10 steers (5 steers in each of 2 pens) administered CCFA as a two-thirds–dose regimen (4.4 mg/kg, SC, on day 0). Cohort 3 comprised 10 steers (5 steers in each of 2 pens) administered CCFA as a 3-dose regimen (6.6 mg/kg, SC, on days 0, 6, and 13). Cohort 4 comprised 31 steers (5 steers in each of 5 pens and 6 steers in the remaining pen) that served as untreated control animals. Procedures—Commercially prepared CCFA was procured and administered in accordance with label instructions, except that a reduced dosage (4.4 mg/kg) was administered to steers of cohort 2. The CCFA for each treatment was administered SC in the middle third of the caudal aspect of the ear. No products (CCFA, other injectable antimicrobial, or control solution) were administered to control steers during the study. Steers were moved through an animal handling facility on days 0, 2, 6, 9, 13, 16, 20, and 28. Fecal samples were collected directly from the rectum of each steer, placed in labeled cups, and stored on wet ice. All samples were transported to the laboratory for additional processing on the day of sample collection. Microbiologic analysis—A direct-plating method was used to determine the number of CFUs of non–typespecific E coli per gram of feces. In brief, a 25-g portion of fecal matter was aseptically transferred into 225 mL of buffer peptone water. The mixture was shaken for 1 minute. To enumerate E coli, serial dilutions were spirally platedb onto MacConkey agar plates. Plates were incubated at 37oC for 48 hours, and typical colonies were then counted by use of an automated colony counter.c Three separate colonies were selected from each plate with distinct colonies for further characterization. Because biochemical confirmation offered little additional advantage over simply selecting typical colonies from MacConkey agar plates, only a proportion of the isolates were subjected to automated biochemical confirmationd to verify that they were E coli. Susceptibility testing was performed on all isolates by use of microbroth dilution with a panel of antimicrobialse (Appendix).16,17 Three distinct colonies/sample were transferred onto tryptic soy agar plates and incubated at 37.3oC for 24 hours. Three to five clearly isolated colonies were subsequently selected from each tryptic soy agar plate and placed into 4 mL of sterile deionized water; these solutions were then adjusted to a 0.5 McFarland standard. A portion (10 µL) of the suspension was transferred into Mueller-Hinton broth and mixed on a vortex. An automated inoculatorf was used to inoculate 96-well microbroth dilution plates. Plates were incubated at 37.3oC for 18 to 24 hours; results were then manually determined. The MIC was reported as the lowest concentration of antimicrobial that inhibited visible growth, as determined in accordance with the manufacturer’s instructions (Appendix). When an isolate grew at the greatest concentration of an antimicrobial, the MIC was arbitrarily set at double the greatest concentration. Isolates were classified as susceptible or resistant on the basis of guidelines esAJVR, Vol 68, No. 5, May 2007
tablished by the Clinical Laboratory Standards Institute.16 No breakpoint has been established for ceftiofur by the Clinical Laboratory Standards Institute. As described by the National Antimicrobial Resistance Monitoring System for Enteric Bacteria,17 ≥ 8 µg of ceftiofur/mL was used to determine phenotypic resistance. Additionally, isolates that grew at concentrations ≥ 2 µg of ceftriaxone/mL were characterized as having reduced susceptibility. Statistical analysis—Data were entered into an electronic database. The MICs were logarithmically transformed by use of log base 2, whereas estimates of the number of E coli per gram of feces were logarithmically transformed by use of log base 10. Descriptive statistics were generated. Estimates of the concentration of ceftiofur-resistant bacteria in fecal samples were calculated by multiplying the proportion of resistant isolates within a sample by the concentration (untransformed value) of E coli within the sample. Estimates were then logarithmically transformed by use of log base 10. Data were imported into a commercially available software packageg for subsequent analysis. Outcome measures (ie, log2 MIC, log10 CFUs of E coli/g of feces, and log10 CFUs of resistant E coli/g of feces), proportion of resistant isolates, and proportion of susceptible isolates were analyzed by use of linear or logistic regression techniques, when appropriate. An interaction between administration status and time was evaluated. When significant (P ≤ 0.05) values were detected, only pairwise evaluations of within-day and within-administration means were performed. Dependency within an animal over time was modeled by use of first-order autoregressive covariance matrices.18 Results We recovered 1,441 isolates. Confirmatory biochemical assays were performed on 953 (66.1%) iso-
lates, and 952 (99.9%) isolates were confirmed as E coli. Resistance to 1 or more antimicrobials was detected in 986 (68.4%) isolates. The most common antimicrobials to which E coli isolates were resistant were sulfisoxazole (901 [62.5%] isolates), tetracycline (586 [40.7%]), streptomycin (475 [33.0%]), chloramphenicol (335 [23.3%]), and ampicillin (302 [21.0%]; Table 1). Four hundred fifty-five (31.6%) isolates were susceptible to all drugs. The distribution of MICs was determined (Table 2). On the basis of the number of antimicrobials to which isolates were resistant, a bimodal distribution in the proportion of isolates was evident (Figure 1). The 2 modes were attributable to bacteria typically being resistant to no antimicrobials or to 8 antimicrobials. The bimodal distribution was most pronounced for those cattle administered 3 doses of CCFA at 6.6 mg/kg and least pronounced for the control steers. Phenotypic expression of ceftiofur resistance was observed in 289 (20.1%) isolates. The mean number of antimicrobials to which ceftiofur-resistant isolates were resistant was 8.2, whereas the typical number of antimicrobial drugs to which ceftiofur-susceptible isolates were resistant was 1.1. Agreement was almost perfect between ceftiofur resistance and coresistance to ACSSuT (κ, 0.97). Similarly, nearly perfect agreement (κ, 0.97) was detected between ceftiofur resistance and an MIC of ≥ 2 µg of ceftriaxone/mL. A significant (P = 0.01) interaction was detected between exposure status and day for the likelihood of recovering a ceftiofur-resistant isolate (Figure 2). The likelihood of recovering a ceftiofur-resistant isolate did not differ significantly (P = 0.20) between cohorts on day 0 or 28. Significant (P = 0.01) differences among cohorts were detected on remaining days. In addition, a significant (P = 0.01) effect of day was detected for each of those cohorts administered ceftiofur; however, a
Table 1—Percentage of isolates classified as resistant in fecal samples collected from feedlot steers on the basis of cohort of steers and antimicrobial.
Cohort*
Antimicrobial
1 (240)
2 (240)
3 (238)
4 (723)
Amikacin Gentamicin Kanamycin Streptomycin Ampicillin Amoxicillin and clavulanic acid Cefoxitin Ceftiofur Ceftriaxone Resistant Reduced susceptibility† Ciprofloxacin Nalidixic acid Sulfisoxazole Trimethoprim and sulfamethoxazole Chloramphenicol Tetracycline
0 0.83 1.25 35.00 19.20 17.90 18.80 19.20 0.42 19.60 2.50 10.80 62.10 3.75 21.30 43.80
0 0 1.67 40.80 32.10 30.40 31.70 31.30 4.17 31.70 0 4.17 72.90 2.08 34.20 53.80
0 0.42 2.94 67.60 58.00 56.70 56.70 57.10 5.46 56.70 0.42 5.88 87.00 2.94 61.80 70.20
0.14 0 0.41 18.30 5.67 4.29 4.56 4.43 0.97 4.84 0.14 2.49 51.20 0.55 7.61 25.60
Numbers in parentheses represent number of isolates. *Cohort 1 comprised 10 steers (5 steers in each of 2 pens); these steers were administered CCFAa as a single-dose regimen (6.6 mg/kg, SC, on day 0). Cohort 2 comprised 10 steers (5 steers in each of 2 pens) administered CCFA as a two-thirds–dose regimen (4.4 mg/kg, SC, on day 0). Cohort 3 comprised 10 steers (5 steers in each of 2 pens) administered CCFA as a 3-dose regimen (6.6 mg/kg, SC, on days 0, 6, and 13). Cohort 4 comprised 31 steers (5 steers in each of 5 pens and 6 steers in the remaining pen) that served as untreated control animals; these steers were commingled with steers of cohorts 1 through 3. † 2 µg/mL. AJVR, Vol 68, No. 5, May 2007
503
Table 2—Percentage of isolates recovered from fecal samples collected from feedlot steers on the basis of the MIC ratio.
MIC ratio*
Antimicrobial
0
1
2
3
4
5
6
7
8
Lowest concentration tested (µg/mL)
Amikacin Gentamicin Kanamycin Streptomycin Ampicillin
0.30 2.71 86.30 67.00 14.90
3.30 38.51 9.40 3.90 34.40
41.60 40.18 3.10 29.10 28.90
38.70 12.42 0.60 — 0.60
10.60 4.58 0.60 — 0.10
4.50 1.39 — — 0.20
1.10 0.21 — — 20.80
0.10 — — — —
— — — — —
0.5 0.25 8.0 32.0 1.0
Amoxicillin and clavulanic acid Cefoxitin Ceftiofur Ceftriaxone Ciprofloxacin
10.60
25.70
40.70
3.20
0.30
19.20
0.40
—
—
1.0 and 0.5
0 5.00 79.30 75.40
1.90 14.80 0.20 19.20
19.30 52.30 0.10 0.90
40.50 6.50 0.10 0.60
17.50 0.60 0.40 1.90
0.70 0.80 2.20 1.20
4.20 1.80 8.70 0.10
15.90 18.30 6.70 0.10
— — 2.20 0.60
0.60 11.50 72.70
8.80 11.50 16.60
58.40 13.80 8.80
25.00 0.70 0.10
1.90 0.20 1.60
0.60 62.30 0.10
0.80 — —
4.00 — —
— —
0.5 16.0 0.12 and 2.38
2.40 56.10
16.90 3.30
49.40 0.60
8.10 10.10
0.60 29.90
22.70 —
— —
— —
— —
2.0 4.0
Nalidixic acid Sulfisoxazole Trimethoprim and sulfamethoxazole Chloramphenicol Tetracycline
0.5 0.12 0.25 0.015
*Within each antimicrobial, each MIC was divided by the lowest concentration of antimicrobial tested. This ratio was then transformed (log base 2) to develop a comparable index. When an isolate grew at the greatest concentration tested, the MIC was arbitrarily assigned the value of the subsequent serial dilution. — = Value greater than the MIC of the panel.
similar effect of day was not detected (P = 0.68) for the control cohort. Recovery of ceftiofur-resistant isolates was significantly (P = 0.01 for all within-day pairwise comparisons) more likely on days 2 through 20 from steers administered 3 doses of CCFA at 6.6 mg/kg, compared with recovery for control steers. A ceftiofur-resistant isolate was significantly (P = 0.03 for all within-day pairwise comparisons) more likely to be recovered on days 2, 6, 9, and 16 from steers administered 1 dose of CCFA at 6.6 or 4.4 mg/kg, compared with recovery for control steers. On day 13, only isolates recovered from steers administered either 3 doses of CCFA at 6.6 mg/kg (P = 0.01) or 1 dose of CCFA at 4.4 mg/kg (P = 0.02) were more likely to be resistant to ceftiofur than isolates recovered from control animals. With few exceptions, similar patterns were observed for coresistance to ACSSuT, an MIC of ≥ 2 µg of ceftriaxone/mL, and log2 MIC of β-lactam antimicrobials (data not shown). Exposure was significantly (P = 0.01) associated with a time-dependent impact on E coli concentration in feces. The E coli concentration in all cohorts administered CCFA was significantly lower on days 2 and 6 (P = 0.02 for all within-day pairwise comparisons), compared with the concentration in control steers (Figure 3). On day 9, only cohorts administered 3 doses of CCFA at 6.6 mg/kg (P = 0.01) or 1 dose of CCFA at 4.4 mg/kg (P = 0.01) had lower E coli concentrations than control steers. We did not detect significant (P = 0.15) within-day variation on days 0, 13, 16, 20, or 28. Administration of CCFA was associated with a significant (P = 0.01) time-dependent increase in the estimated concentration of ceftiofur-resistant E coli (Figure 3). Estimated concentration of ceftiofur-resistant E coli varied significantly (P = 0.02) on days 6, 9, 13, 16, and 20. Cohorts administered CCFA had greater numbers of ceftiofur-resistant E coli per gram of feces, compared with results for the control steers. The most pronounced 504
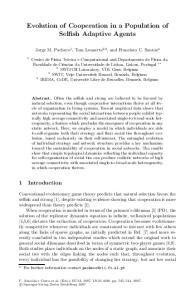
Figure 1—Proportion of Escherichia coli isolates, on the basis of the number of antimicrobials to which they were resistant, recovered from fecal samples collected from control steers (A); steers administered 6.6 mg of CCFA/kg, SC, once on day 0 (B); steers administered 4.4 mg of CCFA/kg, SC, once on day 0 (C); or steers administered 6.6 mg of CCFA/kg, SC, on days 0, 6, and 13 (D). AJVR, Vol 68, No. 5, May 2007
(extent and duration) effect was evident in the cohort administered 3 consecutive doses of CCFA at 6.6 mg/kg; on days 13, 16, and 20, only the ceftiofur-resistant population of the 3-dose cohort was significantly (P = 0.02) greater than that of the control cohort.
Figure 2—Proportion of isolates resistant to ceftiofur that were recovered from fecal samples collected on various days from control steers (black circles), steers administered 6.6 mg of CCFA/kg, SC, once on day 0 (white circles); steers administered 4.4 mg of CCFA/kg, SC, once on day 0 (inverted black triangles); or steers administered 6.6 mg of CCFA/kg, SC, on days 0, 6, and 13 (inverted white triangles). Error bars represent the SE of the proportion.
Figure 3—Total E coli concentration (A) and estimated concentration of ceftiofur-resistant E coli (B) in fecal samples collected from various cohorts of feedlot steers on various days. Notice that the scale on the y-axis differs between the 2 portions of this figure. Error bars represent the SE of the geometric mean. See Figure 2 for remainder of key.
Discussion Subcutaneous administration of CCFA exerted a detectable selection pressure within the gastrointestinal tract that favored transient expansion of ceftiofur resistance among non–type-specific E coli. The decrease in population susceptibility to ceftiofur after administration of CCFA generally returned to preadministration values approximately 13 to 15 days after CCFA administration. Because prevalence and within-animal genetic diversity of Salmonella serovars is considerably lower than that of E coli, we used E coli as a model for the effect of ceftiofur administration on Salmonella serovars because the study described here had insufficient power to evaluate an effect of CCFA administration on Salmonella serovars. Despite the expected similarity in response of Salmonella serovars and E coli, a degree of caution should be used when generalizing our results beyond E coli. Administration of CCFA also transiently facilitated expansion of isolates that were resistant to multiple antimicrobials. This phenomenon resulted because those isolates that phenotypically had ceftiofur resistance also had coresistance (or had reduced susceptibility) to other sometimes unrelated antimicrobials. Furthermore, ceftiofur-susceptible isolates were typically only resistant to approximately 1 antimicrobial, compared with ceftiofur-resistant isolates, which were typically resistant to approximately 7 other antimicrobials. This clustering of resistance patterns as broadly susceptible or broadly resistant was responsible for the bimodal distribution in number of antimicrobials to which the isolates were resistant; hence, the distribution was most pronounced in isolates recovered from steers administered 3 consecutive doses of CCFA (Figure 2). Because ceftiofur resistance was so intimately associated with resistance to other antimicrobials and administration of CCFA facilitated expansion of ceftiofur resistance, administration of CCFA led to the more pronounced bimodal distribution observed in isolates recovered from steers of the CCFA-administered cohorts. Agreement was nearly perfect between ceftiofur resistance and coresistance to ACSSuT, and reduced susceptibility to ceftriaxone was evident in the data. Although not explicitly stated, a similar phenotype cluster was observed in ceftiofur-resistant isolates reported elsewhere.15 The ACSSuT coresistance phenotype has been described for Salmonella Typhimurium DT10419 and multiply drug-resistant Salmonella Newport that produces an AmpC b-lactamase (designated S Newport MDR-AmpC).20,21 In the former, the integron complex that houses the genetic determinants responsible for coresistance to ACSSuT is chromosomally integrated,22 whereas in the latter, it is a plasmid-mediated event.23 The consequence of this is that genetic elements are more likely to be disseminated horizontally when housed on a plasmid than when housed on a bacterial chromosome.24 Additional studies are needed to determine whether the detected time-dependent increase in resistance was attributable to clonal expansion of specific isolates, such as for Salmonella Typhimurium DT104, or to nonspecific dissemination of resistance determinants housed on mobile genetic elements, such as for a conjugative plasmid. If the latter is true, then
AJVR, Vol 68, No. 5, May 2007
505
similar (or identical) plasmids harbored within multiple unrelated E coli genotypes would be expected. The most likely determinant conferring ceftiofur resistance as well as reduced susceptibility to ceftriaxone is the blaCMY gene.8,25 It is not certain in the study reported here how, or whether at all, this gene may be linked to those conferring the coresistance ACSSuT pattern. It is possible that they are all housed on a single mobilizable or conjugative plasmid. Additional molecular characterization of the isolates from our study is required to better describe genetic determinants, transferability of resistance, and similarity of isolates. Ostensibly, it would appear that more isolates recovered from those animals administered 4.4 mg/kg were resistant than were recovered from animals administered a single 6.6 mg/kg regimen (Figure 3). However, when the proportion of ceftiofur-resistant isolates recovered on days 0, 2, and 6 was compared between the 4.4 mg/kg cohort and cohorts 1 and 3, no difference was observed. Consequently, it is unlikely that a causal CCFA dose effect was evident in our study. In other words, detected variation between cohorts 1 and 2 was more likely attributable to within-pen factors than to varying selection pressures. A herd-level association between ceftiofur use and ceftiofur resistance has been reported in another study.15 In that study, investigators did not detect an animal-level association between treatment and recovery of ceftiofur-resistant E coli. It is not completely clear as to the reasons we detected an animal-level response and those investigators did not. However, in that study,15 the investigators included ceftiofur treatments administered within the preceding 6 months in their analyses. Because the within-animal effect is relatively transitory, it may be difficult to detect an animal-level effect beyond a few days in many cases. The detection of a herd-level effect is interesting and may represent a treatment-dependent shift in baseline over time. Even though CCFA provided selective pressure favoring expansion of multiply resistant E coli, the return to baseline values within approximately 2 weeks after completion of administration of CCFA indicated reduced bacterial fitness associated with maintenance of resistance determinants. Moreover, we did not detect an effect of day within the control cohort, despite the fact that they were commingled in pens with steers administered CCFA. Thus, the ceftiofursusceptible variants (those broadly susceptible) appeared to have the greatest fitness for the feedlot conditions in the study reported here when there was no ceftiofur selection pressure. Consequently, ongoing CCFA administration may be a prerequisite for dissemination of ceftiofur resistance in non–type-specific E coli. Therefore, prudent use of CCFA in animal health programs may prevent E coli from becoming an important reservoir of genetic determinants that encode ceftiofur resistance. Additional studies are required to determine whether an apparent fitness disadvantage is also evident among Salmonella serovars and whether it is possible to exploit differing metabolic fitness to mitigate resistance in situations where the burden of ceftiofur resistance has increased to become problematic within defined cattle populations. 506
a. b. c. d. e. f. g.
Excede, Pharmacia & Upjohn Co, Division of Pfizer Inc, New York, NY. Autoplate 4000, Spiral Biotech Inc, Norwood, Mass. QCount, Spiral Biotech Inc, Norwood, Mass. Vitek 2, bioMérieux Inc, Durham, NC. Sensititre gram-negative NARMS plate, catalogue No. CMV1AGNF, TREK Diagnostic Systems, Cleveland, Ohio. Sensititre autoinoculator, TREK Diagnostic Systems, Cleveland, Ohio. SAS, version 9.1.3, SAS Institute Inc, Cary, NC.
Appendix Dilution ranges and breakpoints16,17 used to determine resistance of Escherichia coli isolates to selected antimicrobials. Antimicrobial
Dilution range (µg/mL) Minimum
Maximum
Breakpoint (µg/mL)
Amikacin 0.5 64.0 64.0 Gentamicin 0.25 16.00 16.00 Kanamycin 8 64 64 Streptomycin 32 64 64 Ampicillin 1 32 32 Amoxicillin and 1.0 and 0.5 32.0 and 16.0 32.0 and 16.0 clavulanic acid Cefoxitin 0.5 35.0 32.0 Ceftiofur 0.12 8.00 8.00 Ceftriaxone 0.25 64.00 64.00 Ciprofloxacin 0.015 4.000 4.000 Nalidixic acid 0.5 32.0 32.0 Sulfisoxazole 16 256 256 Trimethoprim 0.12 and 2.38 4.00 and 76.00 4.00 and 76.00 and sulfameth- oxazole Chloramphenicol 2 32 32 Tetracycline 4 32 16
References 1.
Helms M, Ethelberg S, Molbak K. International Salmonella Typhimurium DT104 infections, 1992–2001. Emerg Infect Dis 2005;11:859–867. 2. Varma JK, Molbak K, Barrett TJ, et al. Antimicrobial-resistant nontyphoidal Salmonella is associated with excess bloodstream infections and hospitalizations. J Infect Dis 2005;191:554–561. 3. Helms M, Vastrup P, Gerner-Smidt P, et al. Excess mortality associated with antimicrobial drug-resistant Salmonella typhimurium. Emerg Infect Dis 2002;8:490–495. 4. Edmond MB, Ober JF, Dawson JD, et al. Vancomycin-resistant enterococcal bacteremia: natural history and attributable mortality. Clin Infect Dis 1996;23:1234–1239. 5. Bach PB, Malak SF, Jurcic J, et al. Impact of infection by vancomycin-resistant Enterococcus on survival and resource utilization for patients with leukemia. Infect Control Hosp Epidemiol 2002;23:471–474. 6. Pelz RK, Lipsett PA, Swoboda SM, et al. Vancomycin-sensitive and vancomycin-resistant enterococcal infections in the ICU: attributable costs and outcomes. Intensive Care Med 2002;28:692–697. 7. Varma JK, Greene KD, Ovitt J, et al. Hospitalization and antimicrobial resistance in Salmonella outbreaks, 1984–2002. Emerg Infect Dis 2005;11:943–946. 8. Whichard JM, Joyce K, Fey PD, et al. Beta-lactam resistance and Enterobacteriaceae, United States. Emerg Infect Dis 2005;11:1464–1466. 9. Fey PD, Safranek TJ, Rupp ME, et al. Ceftriaxone-resistant Salmonella infection acquired by a child from cattle. N Engl J Med 2000;342:1242–1249. 10. Herikstad H, Hayes PS, Hogan J, et al. Ceftriaxone-resistant Salmonella in the United States. Pediatr Infect Dis J 1997;16:904–905. 11. Label: Excede ceftiofur crystalline-free acid sterile suspension. NADA No. 141-209. New York: Pfizer Inc. Available at www. excede.com. Accessed Oct 23, 2006. 12. Washburn K, Johnson R, Clarke CR, et al. Penetration of ceftAJVR, Vol 68, No. 5, May 2007
13. 14. 15.
16.
17.
18.
iofur into sterile vs. Mannheimia haemolytica-infected tissue chambers in beef calves after subcutaneous administration of ceftiofur crystalline free acid sterile suspension in the ear pinna. J Vet Pharmacol Ther 2005;28:247–251. Booker CW, Schunicht OC, Guichon PT, et al. An evaluation of the metaphylactic effect of ceftiofur crystalline free acid in feedlot calves. Vet Ther 2006;7:257–274. Hornish RE, Kotarski SF. Cephalosporins in veterinary medicine—ceftiofur use in food animals. Curr Top Med Chem 2002;2:717–731. Tragesser LA, Wittum TE, Funk JA, et al. Association between ceftiofur use and isolation of Escherichia coli with reduced susceptibility to ceftriaxone from fecal samples of dairy cows. Am J Vet Res 2006;67:1696–1700. Clinical and Laboratory Standards Institute. Methods for dilution antimicrobial susceptibility tests for bacteria that grow aerobically: approved standard. CLSI document M7-A7. 7th ed. Wayne, Pa: Clinical and Laboratory Standards Institute, 2006. CDC. National Antimicrobial Resistance Monitoring System for Enteric Bacteria (NARMS): 2003 human isolates final report. Washington, DC: US Department of Health and Human Services, CDC, 2006;11. Littell RC, Henry PR, Ammerman CB. Statistical analysis of repeated measures data using SAS procedures. J Anim Sci 1998;76:1216–1231.
19. Glynn MK, Bopp C, Dewitt W, et al. Emergence of multidrug-resistant Salmonella enterica serotype typhimurium DT104 infections in the United States. N Engl J Med 1998;338:1333–1338. 20. Varma JK, Marcus R, Stenzel SA, et al. Highly resistant Salmonella Newport-MDRAmpC transmitted through the domestic US food supply: a FoodNet case-control study of sporadic Salmonella Newport infections, 2002–2003. J Infect Dis 2006;194:222–230. 21. CDC. Outbreak of multidrug-resistant Salmonella Newport— United States, January–April 2002. MMWR Morb Mortal Wkly Rep 2002;51:545–548. 22. Schmieger H, Schicklmaier P. Transduction of multiple drug resistance of Salmonella enterica serovar typhimurium DT104. FEMS Microbiol Lett 1999;170:251–256. 23. Zhao S, Qaiyumi S, Friedman S, et al. Characterization of Salmonella enterica serotype Newport isolated from humans and food animals. J Clin Microbiol 2003;41:5366–5371. 24. Alcaine SD, Sukhnanand SS, Warnick LD, et al. Ceftiofur-resistant Salmonella strains isolated from dairy farms represent multiple widely distributed subtypes that evolved by independent horizontal gene transfer. Antimicrob Agents Chemother 2005;49:4061–4067. 25. Carattoli A, Tosini F, Giles WP, et al. Characterization of plasmids carrying CMY-2 from expanded-spectrum cephalosporin-resistant Salmonella strains isolated in the United States between 1996 and 1998. Antimicrob Agents Chemother 2002;46:1269–1272.
AJVR, Vol 68, No. 5, May 2007
507