The
n e w e ng l a n d j o u r na l
of
m e dic i n e
original article
Changes in Diet and Lifestyle and LongTerm Weight Gain in Women and Men Dariush Mozaffarian, M.D., Dr.P.H., Tao Hao, M.P.H., Eric B. Rimm, Sc.D., Walter C. Willett, M.D., Dr.P.H., and Frank B. Hu, M.D., Ph.D.
A BS T R AC T Background From the Division of Cardiovascular Medicine (D.M.) and Channing Laboratory (D.M., E.B.R., W.C.W., F.B.H.), Brigham and Women’s Hospital and Harvard Medical School; and the Departments of Epidemiology (D.M., T.H., E.B.R., W.C.W., F.B.H.) and Nutrition (D.M., E.B.R., W.C.W., F.B.H.), Harvard School of Public Health — all in Boston. Address reprint requests to Dr. Mozaffarian at 665 Huntington Ave., Bldg. 2-319, Boston, MA 02115, or at
[email protected]. N Engl J Med 2011;364:2392-404. Copyright © 2011 Massachusetts Medical Society.
Specific dietary and other lifestyle behaviors may affect the success of the straightforward-sounding strategy “eat less and exercise more” for preventing long-term weight gain. Methods
We performed prospective investigations involving three separate cohorts that included 120,877 U.S. women and men who were free of chronic diseases and not obese at baseline, with follow-up periods from 1986 to 2006, 1991 to 2003, and 1986 to 2006. The relationships between changes in lifestyle factors and weight change were evaluated at 4-year intervals, with multivariable adjustments made for age, baseline bodymass index for each period, and all lifestyle factors simultaneously. Cohort-specific and sex-specific results were similar and were pooled with the use of an inversevariance–weighted meta-analysis. Results
Within each 4-year period, participants gained an average of 3.35 lb (5th to 95th percentile, −4.1 to 12.4). On the basis of increased daily servings of individual dietary components, 4-year weight change was most strongly associated with the intake of potato chips (1.69 lb), potatoes (1.28 lb), sugar-sweetened beverages (1.00 lb), unprocessed red meats (0.95 lb), and processed meats (0.93 lb) and was inversely associated with the intake of vegetables (−0.22 lb), whole grains (−0.37 lb), fruits (−0.49 lb), nuts (−0.57 lb), and yogurt (−0.82 lb) (P≤0.005 for each comparison). Aggregate dietary changes were associated with substantial differences in weight change (3.93 lb across quintiles of dietary change). Other lifestyle factors were also independently associated with weight change (P<0.001), including physical activity (−1.76 lb across quintiles); alcohol use (0.41 lb per drink per day), smoking (new quitters, 5.17 lb; former smokers, 0.14 lb), sleep (more weight gain with <6 or >8 hours of sleep), and television watching (0.31 lb per hour per day). Conclusions
Specific dietary and lifestyle factors are independently associated with long-term weight gain, with a substantial aggregate effect and implications for strategies to prevent obesity. (Funded by the National Institutes of Health and others.)
2392
n engl j med 364;25 nejm.org june 23, 2011
The New England Journal of Medicine Downloaded from NEJM Media Center by KATIE HOBSON on June 21, 2011. Embargo lifted June 22, 2011 at 5pm ET. Copyright © 2011 Massachusetts Medical Society. All rights reserved.
Effect of Lifestyle on Weight Gain
B
ecause efforts to lose weight pose tremendous challenges, primary prevention of weight gain is a global priority. Since weight stability requires a balance between calories consumed and calories expended, the advice to “eat less and exercise more” would seem to be straightforward. However, weight gain often occurs gradually over decades (about 1 lb per year), making it difficult for most people to perceive the specific causes. Weight-loss trials1-3 have typically enrolled obese or overweight persons who attempted substantial short-term weight loss on specialized diets, thus limiting the generalizability of the findings to nonobese populations and to the factors that determine long-term, gradual weight gain. Several lifestyle behaviors may influence whether or not a person can maintain energy balance over the long term. For instance, the consumption of sugar-sweetened beverages, sweets, and processed foods may make it harder to do so, whereas the consumption of whole grains, fruits, and vegetables might make it easier.4-10 Physical activity should also influence long-term weight gain, but evidence to support this expectation has been surprisingly inconsistent.11-14 In addition, the duration of television viewing and of sleep may influence energy consumption, energy expenditure, or both.15-19 Different lifestyle behaviors have often been evaluated separately, thus limiting relative comparisons or the quantification of combined effects. In addition, most studies of long-term weight gain have evaluated current behaviors, but changes in behavior over time may be more relevant in terms of both their biologic effects on long-term weight gain and their translation into prevention strategies. We investigated the relationship between multiple lifestyle changes, both independently and jointly, and long-term weight gain in nonobese women and men participating in three separate, prospective studies.
Me thods Study Design and Population
The Nurses’ Health Study (NHS) is a prospective study of a cohort of 121,701 female registered nurses from 11 U.S. states who were enrolled in 1976. The Nurses’ Health Study II (NHS II) is a prospective study of a cohort of 116,686 younger female registered nurses from 14 states who were enrolled in 1989. The Health Professionals Follow-up Study
(HPFS) is a prospective study of a cohort of 51,529 male health professionals from all 50 states, enrolled in 1986. Participants were followed with the use of biennial validated questionnaires concerning medical history, lifestyle, and health practices. For this analysis, the baseline year was the first year for which detailed information was available on diet, physical activity, and smoking habits — 1986 in the NHS and HPFS and 1991 in the NHS II. We excluded participants with obesity, diabetes, cancer, or cardiovascular, pulmonary, renal, or liver disease at baseline; those for whom baseline data on lifestyle habits were missing; those with an implausible energy intake (<900 or >3500 kcal per day); those with more than nine blank responses on the diet questionnaire; those who were newly pregnant during follow-up; and those who were over 65 years of age, given possible confounding due to age-related loss of lean muscle mass. The final analyses included 50,422 women in the NHS, 47,898 women in the NHS II, and 22,557 men in the HPFS, all of whom were free of obesity and chronic diseases and for whom data on weight and lifestyle habits at baseline were complete. Cohort members who were excluded because of missing data had characteristics similar to those included in the analysis (data not shown). The funders of this study had no role in its design or conduct; in the collection, management, analysis, or interpretation of the data; or in the preparation, review, or approval of the manuscript. Lifestyle Assessment
Lifestyle habits of interest were physical activity, television watching, alcohol use, sleep duration, and diet, and cigarette smoking was a potential confounding factor (Table 1, and Tables 1 and 2 in the Supplementary Appendix, available with the full text of this article at NEJM.org). On the basis of their plausible biologic effects, the dietary factors we assessed included fruits, vegetables, whole grains, refined grains, potatoes (including boiled or mashed potatoes and french fries), potato chips, whole-fat dairy products, low-fat dairy products, sugar-sweetened beverages, sweets and desserts, processed meats, unprocessed red meats, fried foods, and trans fat (see Table 1 in the Supplementary Appendix). We also evaluated nuts, 100%-fruit juices, diet sodas, and subtypes of dairy products and potatoes. Different types of alcohol drinks were also evaluated. To assess aggregate dietary
n engl j med 364;25 nejm.org june 23, 2011
The New England Journal of Medicine Downloaded from NEJM Media Center by KATIE HOBSON on June 21, 2011. Embargo lifted June 22, 2011 at 5pm ET. Copyright © 2011 Massachusetts Medical Society. All rights reserved.
2393
The
n e w e ng l a n d j o u r na l
of
m e dic i n e
Table 1. Baseline Characteristics and Average 4-Year Lifestyle Changes among 120,877 U.S. Women and Men in Three Prospective Cohorts.* Nurses’ Health Study (N = 50,422 women)
Variable
Baseline
Change within Each 4-Year Period (5th–95th percentile)†
Nurses’ Health Study II (N = 47,898 women)
Baseline
Change within Each 4-Year Period (5th–95th percentile)†
Health Professionals Follow-up Study (N = 22,557 men)
Baseline
Change within Each 4-Year Period (5th–95th percentile)†
Age — yr
52.2±7.2
Weight — lb
141±20
2.33 (−5.5 to 10.7)‡
138±20
5.24 (−2.3 to 16.3)‡
175±20
1.63 (−5.0 to 8.0)‡
Body-mass index
23.7±1.4
0.40 (−0.94 to 1.83)
23.0±2.7
0.69 (−1.05 to 2.82)
24.7±1.1
0.24 (−0.70 to 1.20)
Physical activity — MET-hr/wk§ 14.8±9.9
1.78 (−9.24 to 15.3)
21.6±25.9
0.53 (−12.6 to 14.7)
22.9±15.1
6.7 (−8.90 to 33.6)
0.52±0.41
−0.02 (−0.35 to 0.22)
0.30±0.52
0.04 (−0.14 to 0.33)
0.87±0.60
0.00 (−0.45 to 0.43)
7.0±0.5
—
7.0±1.0
—
7.1±0.5
Fruits
1.6±0.6
−0.10 (−0.96 to 0.59)
1.2±0.9
0.03 (−0.48 to 0.57)
1.5±0.6
0.05 (−0.57 to 0.72)
Vegetables
3.9±1.0
−0.45 (−2.32 to 0.78)
3.3±1.9
0.19 (−0.84 to 1.41)
3.3±0.9
0.02 (−1.15 to 1.07)
Whole-fat dairy foods
1.2±0.5
−0.16 (−0.86 to 0.36)
0.8±0.7
−0.02 (−0.45 to 0.50)
0.9±0.5
−0.09 (−0.64 to 0.36)
Low-fat dairy foods
0.9±0.5
0.11 (−0.46 to 0.83)
1.1±0.9
0.02 (−0.59 to 0.64)
0.8±0.5
−0.05 (−0.64 to 0.43)
Potato chips
0.1±0.1
−0.01 (−0.09 to 0.07)
0.2±0.2
−0.01 (−0.12 to 0.10)
0.2±0.1
−0.01 (−0.11 to 0.09)
Potatoes
0.4±0.1
−0.01 (−0.19 to 0.18)
0.4±0.3
−0.02 (−0.17 to 0.12)
0.4±0.1
−0.01 (−0.18 to 0.18)
Whole grains
0.5±0.2
0.12 (−0.22 to 0.53)
0.7±0.5
0.10 (−0.23 to 0.49)
0.7±0.3
0.10 (−0.23 to 0.52)
Refined grains
1.2±0.4
−0.03 (−0.60 to 0.57)
1.3±0.8
−0.09 (−0.67 to 0.40)
1.2±0.5
−0.01 (−0.57 to 0.56)
Nuts
0.2±0.1
0.01 (−0.15 to 0.20)
0.1±0.1
0.06 (−0.05 to 0.33)
0.2±0.2
0.02 (−0.22 to 0.29)
Sugar-sweetened beverages
0.2±0.2
−0.00 (−0.14 to 0.11)
0.3±0.6
−0.03 (−0.31 to 0.14)
0.3±0.3
−0.02 (−0.22 to 0.14)
Diet soda, 0 calories
0.5±0.4
−0.01 (−0.40 to 0.38)
1.0±1.3
−0.06 (−0.73 to 0.52)
0.5±0.5
0.00 (−0.35 to 0.36)
100%-fruit juice
0.8±0.4
0.06 (−0.43 to 0.64)
0.6±0.7
−0.03 (−0.45 to 0.33)
0.8±0.4
0.01 (−0.44 to 0.50)
Sweets and desserts
1.3±0.6
−0.01 (−0.75 to 0.75)
1.3±1.1
−0.06 (−0.65 to 0.45)
1.5±0.7
−0.03 (−0.76 to 0.70)
Processed meats
0.3±0.1
−0.04 (−0.22 to 0.11)
0.2±0.2
0.01 (−0.14 to 0.19)
0.4±0.2
−0.02 (−0.22 to 0.17)
Unprocessed red meats
0.6±0.2
−0.06 (−0.32 to 0.14)
0.6±0.4
−0.01 (−0.24 to 0.21)
0.6±0.2
0.02 (−0.28 to 0.41)
Time spent watching television — hr/wk‖
4.2±0.7
—
8.4±7.5
0.25 (−5.00 to 6.08)
10.5±4.0
−0.29 (−5.50 to 5.00)
Alcohol — drinks/day Total daily sleep — hr¶
37.5±4.1
50.8±7.5
—
Dietary intake — servings/day
* Plus–minus values are means ±SD. Data are based on 20 years of follow-up (1986–2006) in the Nurses’ Health Study (NHS), 12 years of follow-up (1991–2003) in the Nurses’ Health Study II (NHS II), and 20 years of follow-up (1986–2006) in the Health Professionals Follow-up Study (HPFS). Usual dietary habits and alcohol use were assessed every 4 years with the use of validated, semiquantitative food-frequency questionnaires. Alcohol included wine (5 oz), beer (1 glass, bottle, or can), and liquor (1 drink or shot). Other specific foods and beverages in each category are listed in Table 1 in the Supplementary Appendix. Results for smoking habits (assessed with the use of biennial questionnaires), trans fat, and fried foods can be found in Table 2 in the Supplementary Appendix. To convert pounds to kilograms, divide by 0.45. † Because serial assessments were limited, the 4-year changes could not be reliably quantified, and absolute levels at baseline were used for cohort-specific analyses. ‡ The corresponding values for relative weight changes were 1.83% (5th to 95th percentile, −4.0 to 7.7) in the NHS, 3.60% (5th to 95th percentile, −1.80 to 10.7) in the NHS II, and 1.00% (5th to 95th percentile, −3.11 to 5.09) in the HPFS. § Physical activity was assessed by means of validated questionnaires every 2 years, with average energy expenditure (metabolic-equivalent [MET]-hours per week) for specific activities (e.g., walking, jogging, bicycling, swimming, racquet sports, and gardening). In the NHS II, physical activity levels in 1997, 2001, and 2005 were used to impute the levels in 1995, 1999, and 2003, respectively. ¶ The average duration of sleep per 24-hour period was assessed in 1986, 2000, and 2002 in the NHS; in 2001 in the NHS II; and in 1987 and 2000 in the HPFS. ‖ The average number of hours per week spent watching television at home was assessed in 1992 and 2004 in the NHS; in 1991, 1997, and 2001 in the NHS II; and in 1998 and every 2 years thereafter in the HPFS.
2394
n engl j med 364;25 nejm.org june 23, 2011
The New England Journal of Medicine Downloaded from NEJM Media Center by KATIE HOBSON on June 21, 2011. Embargo lifted June 22, 2011 at 5pm ET. Copyright © 2011 Massachusetts Medical Society. All rights reserved.
Effect of Lifestyle on Weight Gain
effects, changes in each dietary factor independently associated with weight gain were categorized in quintiles and assigned ascending values (1 to 5) or descending values (5 to 1) for habits inversely or positively associated with weight gain, respectively; these ordinal values were summed to generate an overall score for dietary change. Weight Changes
factors simultaneously. Total energy intake, biologic factors (e.g., blood pressure), and medications were not included as covariables because such factors could be mediators (in causal pathways) or direct correlates of mediators of the effects of lifestyle on weight gain. Sensitivity analyses were performed to evaluate absolute physical activity levels at the start of each 4-year period rather than changes during the period, data among participants who never smoked, and data stratified according to age and baseline body-mass index. Findings across cohorts were pooled by means of inverse-variance–weighted, random-effects metaanalyses. Analyses were carried out with the use of SAS software, version 9.1 (SAS Institute), at a two-tailed alpha level of 0.05.
Height and weight were assessed by questionnaire at enrollment, and weight was requested on each follow-up questionnaire. In a validation subsample, questionnaire-reported and staff-measured weights were highly correlated (r = 0.96; mean difference, 3.3 lb). Weight changes were evaluated every 4 years as both absolute changes (pounds) and relative changes (percentages). Anthropometric measureR e sult s ments and weight changes strongly predict disBaseline Characteristics and Weight Gain ease outcomes in these cohorts.20-26 Weight and lifestyle characteristics at baseline and Statistical Analysis changes during 1,570,808 person-years of followWe assessed the independent relationships between up are shown in Table 1. The mean weight gain for changes in lifestyle behaviors and weight changes all the 4-year periods combined differed among the within 4-year periods over a period of 20 years in three cohorts, a finding that may have been relatthe NHS, 12 years in the NHS II, and 20 years in the ed to cohort-specific differences in sex and age at HPFS (Table 1), using multivariable linear regression baseline. The mean weight gains were as follows: with robust variance and accounting for within- 1.63 lb (5th to 95th percentile, −5.0 to 8.0) for the individual repeated measures. Lifestyle changes men in the HPFS (mean age, 50.8±7.5 years), 2.33 lb were assessed either as continuous variables, (5th to 95th percentile, −5.5 to 10.7) for the women with censoring of data at the 0.5 and 99.5 percen- in the NHS (mean age, 52.2±7.2), and 5.24 lb (5th to tiles to minimize the influence of outliers, or as 95th percentile, −2.3 to 16.3) for the women in the indicator variables for categorical behaviors (e.g., NHS II (mean age, 37.5±4.1). The average weight smoking status). Potential nonlinear effects of de- gain across the cohorts was 3.35 lb (5th to 95th creases versus increases in each behavior were eval- percentile, −4.1 to 12.4), or 2.4% of body weight (5th uated by modeling changes in indicator categories, to 95th percentile, −3.0 to 8.4), during each 4-year with “no change” as the reference. Any missing period; this change corresponds to a weight gain lifestyle data during any follow-up period were of 16.8 lb over a period of 20 years. coded as a missing indicator category for categorical variables (e.g., smoking status) and with Diet and Lifestyle Changes carried-forward values for continuous variables. To Although the mean changes in lifestyle in the overminimize confounding from the loss of lean mus- all study population were small, the betweencle mass at older ages or from loss of weight due individual changes were large (Table 1). In the to undiagnosed chronic disease, we censored data NHS, for example, the difference between persons for participants after they reached 65 years of age in the upper level of change and those in the lower or if they received a diagnosis of chronic pulmo- level of change (95th percentile minus 5th percennary, renal, or liver disease or of cancer other than tile) was 3.1 servings per day for vegetable connonmelanoma skin cancer (3 to 4% of participants); sumption, 25.3 metabolic equivalents (METs) per data were censored 6 years before diagnosis to week for physical activity, and 0.66 drinks per day account for preclinical disease. Multivariable mod- for alcohol consumption. Correlations between els were used to adjust for age, baseline body- various lifestyle changes were generally small mass index in each 4-year period, and all lifestyle (r<0.05). Positive correlations in changes were n engl j med 364;25 nejm.org june 23, 2011
The New England Journal of Medicine Downloaded from NEJM Media Center by KATIE HOBSON on June 21, 2011. Embargo lifted June 22, 2011 at 5pm ET. Copyright © 2011 Massachusetts Medical Society. All rights reserved.
2395
The
n e w e ng l a n d j o u r na l
largest for fruits and vegetables (r = 0.21) and for processed meats and unprocessed red meats (r = 0.21), whereas inverse correlations in changes were largest for whole-fat dairy products and lowfat dairy products (r = −0.08). Relationships between Dietary changes and Weight Changes
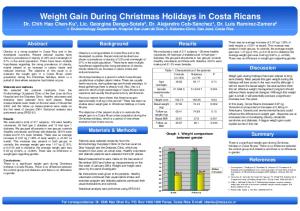
After multivariable adjustment, nearly every dietary factor was independently related to weight change (Table 2). Findings were similar, in direction and magnitude, for men and women and across the three cohorts (Fig. 1). (For additional detailed sexspecific and cohort-specific results, see Tables 3, 4, and 5 in the Supplementary Appendix.) The dietary factors with the largest positive associations with weight changes, per serving per day, were increases in the consumption of potato chips (1.69 lb), potatoes (1.28 lb), sugar-sweetened beverages (1.00 lb), unprocessed red meats (0.95 lb), and processed meats (0.93 lb). A secondary analysis of potato subtypes showed that weight changes were positively associated with increases in the consumption of french fries (3.35 lb) and of boiled, baked, or mashed potatoes (0.57 lb). Weight gain associated with increased consumption of refined grains (0.39 lb per serving per day) was similar to that for sweets and desserts (0.41 lb per serving per day). Inverse associations with weight gain, per serving per day, were seen for increased consumption of vegetables (−0.22 lb), whole grains (−0.37 lb), fruits (−0.49 lb), nuts (−0.57 lb), and yogurt (−0.82 lb). Categorical analyses of each dietary factor revealed similar linear relationships for increased versus decreased consumption (data not shown) — that is, for each dietary factor, the weight change with increased consumption was the inverse of that with decreased consumption. Thus, less weight gain occurred with decreased consumption of potato chips, processed meats, sugar-sweetened beverages, potatoes, or trans fat, and more weight gain occurred with decreased consumption of vegetables, whole grains, fruits, nuts, or yogurt. Aggregate dietary changes were robustly related to weight gain in a dose-dependent fashion, with a 3.93-lb greater weight gain across quintiles (Table 3).
of
m e dic i n e
cohorts. (For sex-specific and cohort-specific results, see Tables 6, 7, and 8 in the Supplementary Appendix.) Across quintiles, participants with greater increases in physical activity gained 1.76 fewer pounds within each 4-year period. Absolute levels of physical activity, rather than changes in these levels, were not associated with weight change (data not shown). Overall, increases in alcohol use (per drink per day) were positively associated with weight change (0.41 lb), but heterogeneity was evident with respect to both the beverage type and the size and direction of changes in use (see the figure in the Supplementary Appendix). Sleep duration had a U-shaped association with weight gain, with greater weight gain occurring with less than 6 hours or more than 8 hours of sleep per night. Increases in time spent watching television (per hour per day) were independently associated with weight gain (0.31 lb, P<0.001). As compared with persons who never smoked, those who had quit smoking within the previous 4 years had a weight gain of 5.17 lb (Table 3). Subsequent weight gain for former smokers was small (0.14 lb per 4-year period). Continued smoking was inversely associated with weight gain (−0.70 lb), a finding that may have been related to undiagnosed chronic disease. Initiation of smoking was not associated with weight change, but evaluation of this category was limited by its rarity in these populations (accounting for <0.1% of person-years). Findings for other lifestyle factors were similar when restricted to persons who never smoked (Table 3). additional Analyses
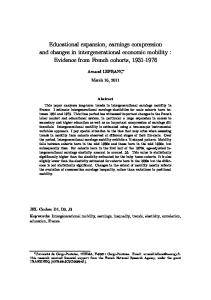
We categorized dietary changes more finely to examine wider ranges of potential effects (Fig. 2). As compared with participants in the top decile, participants in each lower decile of dietary change had greater weight gain, in a dose-dependent fashion. Changes in diet and physical activity were independently associated with weight gain (Fig. 2). Findings for all lifestyle factors were generally similar in analyses stratified according to age or baseline body-mass index (the weight in kilograms divided by the square of the height in meters) (<25 or 25 to 30), although the magnitude of associated Relationships between Other Lifestyle weight change was generally larger among overFactors and Weight Changes weight persons (Tables 9 and 10 in the SupplemenOther lifestyle behaviors were also independently tary Appendix). All results were also similar when related to weight change (Table 3), with similar we evaluated relative (percent) weight changes rathfindings in men and women and across the three er than absolute weight changes (not shown). 2396
n engl j med 364;25 nejm.org june 23, 2011
The New England Journal of Medicine Downloaded from NEJM Media Center by KATIE HOBSON on June 21, 2011. Embargo lifted June 22, 2011 at 5pm ET. Copyright © 2011 Massachusetts Medical Society. All rights reserved.
Effect of Lifestyle on Weight Gain
Table 2. Pooled, Multivariable-Adjusted Results for the Relationships between Changes in Dietary Habits and Weight Change.* Increased Dietary Intake†
Weight Change within Each 4-Year Period (95% Confidence Interval)† Age-Adjusted Change lb
P Value
Multivariable-Adjusted Change‡ lb
P Value
Fruits
−0.69 (−0.92 to −0.46)
<0.001
−0.49 (−0.63 to −0.35)
<0.001
Vegetables
−0.25 (−0.37 to −0.12)
<0.001
−0.22 (−0.34 to −0.11)
<0.001
Nuts
−0.78 (−1.31 to −0.26)
<0.001
−0.57 (−0.97 to −0.17)
0.005
Whole-fat dairy foods§
0.25 (0.05 to 0.45)
0.01
0.10 (−0.10 to 0.30)
0.31
Butter
0.47 (0.23 to 0.71)
<0.001
0.30 (0.15 to 0.45)
<0.001
Cheese
0.13 (−0.08 to 0.34)
0.23
0.02 (−0.09 to 0.13)
0.75
Whole-fat milk
0.08 (−0.05 to 0.22)
0.24
−0.06 (−0.19 to 0.06)
0.32
Low-fat dairy foods§
−0.17 (−0.21 to −0.13)
<0.001
−0.05 (−0.14 to 0.05)
0.33
Low-fat or skim milk
−0.02 (−0.11 to 0.07)
0.69
0.06 (−0.07 to 0.20)
0.37
Yogurt¶
−1.16 (−1.48 to −0.84)
<0.001
−0.82 (−0.99 to −0.67)
<0.001
Potato chips
3.01 (2.09 to 3.94)
<0.001
1.69 (1.30 to 2.09)
<0.001
Potatoes§
2.14 (1.26 to 3.03)
<0.001
1.28 (0.87 to 1.70)
<0.001
French fried
6.59 (4.35 to 8.83)
<0.001
3.35 (2.29 to 4.42)
<0.001
Boiled, baked, or mashed
0.99 (0.36 to 1.61)
0.002
0.57 (0.26 to 0.89)
<0.001
Whole grains‖
−0.59 (−0.65 to −0.53)
<0.001
−0.37 (−0.48 to −0.25)
<0.001
Refined grains
0.56 (0.28 to 0.83)
<0.001
0.39 (0.21 to 0.58)
<0.001
Sugar-sweetened beverages
1.32 (1.03 to 1.62)
<0.001
1.00 (0.83 to 1.17)
<0.001
100%-fruit juice
0.19 (0.07 to 0.31)
0.002
0.31 (0.14 to 0.47)
<0.001
−0.12 (−0.23 to −0.02)
0.02
−0.11 (−0.21 to −0.02)
0.02
Sweets or desserts
0.65 (0.31 to 1.00)
<0.001
0.41 (0.16 to 0.66)
0.001
Processed meats
1.76 (1.43 to 2.09)
<0.001
0.93 (0.79 to 1.08)
<0.001
Unprocessed red meats
1.68 (1.08 to 2.28)
<0.001
0.95 (0.55 to 1.34)
<0.001
Trans fat
1.44 (0.95 to 1.94)
<0.001
0.65 (0.41 to 0.89)
<0.001
Consumed at home
0.49 (0.33 to 0.64)
<0.001
0.36 (0.22 to 0.51)
<0.001
Consumed away from home
0.52 (0.27 to 0.76)
<0.001
0.28 (0.08 to 0.48)
0.007
Diet soda
Fried foods
* Data are based on 20 years of follow-up (1986–2006) in the Nurses Health Study, 12 years of follow-up (1991–2003) in the Nurses Health Study II, and a 20 years of follow-up (1986–2006) in the Health Professionals Follow-up Study. Findings according to sex and within each study were generally similar to the pooled results (see the tables in the Supplementary Appendix). To convert pounds to kilograms, divide by 0.45. † The weight changes shown are for increased consumption; decreased consumption would be associated with the inverse of these weight changes. Increased consumption was defined as an increase in the number of servings per day for all items except trans fat (an increase in the percent of energy) and fried foods consumed at home or away from home (an increase in the number of servings per week). ‡ Values were adjusted for age, baseline body-mass index at the beginning of each 4-year period, and sleep duration, as well as for changes in physical activity, alcohol use, television watching, smoking, and all the dietary factors in the table simultaneously. § For the categories of whole-fat dairy foods, low-fat dairy foods, and potatoes, subtypes were evaluated together in the full, multivariable-adjusted model in place of the overall food group (e.g., butter, cheese, and whole-fat milk were evaluated in place of total whole-fat dairy foods). ¶ We were unable to evaluate separately the different types of yogurt (e.g., nonfat, low-fat, or whole-fat; sweetened or unsweetened). U.S. consumption patterns would suggest that most participants chose nonfat or low-fat yogurt; however, no inference could be made with regard to sweetened or unsweetened yogurt. ‖ Findings were similar when either total dietary fiber or cereal fiber was included in the analysis instead of whole grains.
n engl j med 364;25 nejm.org june 23, 2011
The New England Journal of Medicine Downloaded from NEJM Media Center by KATIE HOBSON on June 21, 2011. Embargo lifted June 22, 2011 at 5pm ET. Copyright © 2011 Massachusetts Medical Society. All rights reserved.
2397
The
n e w e ng l a n d j o u r na l
of
m e dic i n e
foods and beverages, physical activity, alcohol use, television watching, and smoking habits. Average long-term weight gain in nonobese populations is gradual — in the cohorts we studied, about Foods 0.8 lb per year — but accumulated over time, even Potato chips modest increases in weight have implications for Potatoes or fries long-term adiposity-related metabolic dysfunction, Processed meats diabetes, cardiovascular disease, and cancer.21-24 Whereas weight changes associated with any sinUnprocessed red meats gle lifestyle factor were relatively modest in our Butter three cohorts, in the aggregate, changes in diet and Sweets and desserts physical activity accounted for large differences in Refined grains weight gain. The results were similar across the Cheese three separate cohorts, increasing our confidence Vegetables in the validity and generalizability of the findings. All these relationships must be mediated by Nuts changes in energy intake, energy expenditure, or Whole grains both. Total energy intake is not well estimated Fruits from dietary questionnaires, nor does it reflect Yogurt energy balance, which is necessarily codetermined by energy expenditure. Thus, weight change is the Beverages best population metric of energy imbalance and Sugar-sweetened beverages at least partly captures energy intake after adjust100%-Fruit juice ment for determinants of expenditure (e.g., age, Low-fat or skim milk body-mass index, and physical activity). Whole milk Eating more or less of any one food or beverage Diet (zero-calorie) soda may change the total amount of energy consumed, but the magnitude of associated weight gain var−1.0 −0.5 0.0 0.5 1.0 1.5 2.0 2.5 ied for specific foods and beverages. Differences Weight Change Associated with Each Increased in weight gain seen for specific foods and beverDaily Serving, per 4-Year Period (lb) ages could relate to varying portion sizes, patterns of eating, effects on satiety, or displacement of Figure 1. Relationships between Changes in Food and Beverage Consumpother foods or beverages. Strong positive association and Weight Changes Every 4 Years, According to Study Cohort. tions with weight change were seen for starches, Study participants included 50,422 women in the Nurses’ Health Study refined grains, and processed foods. These find(NHS), followed for 20 years (1986 to 2006); 47,898 women in the Nurses’ ings are consistent with those suggested by the Health Study II (NHS II), followed for 12 years (1991 to 2003); and 22,557 results in limited short-term trials: consumption of men in the Health Professionals Follow-up Study (HPFS), followed for 20 years (1986 to 2006). Weight changes are reported for each increase in the daily starches and refined grains may be less satiating, serving of the food or beverage; decreased intake would be associated with increasing subsequent hunger signals and total the inverse weight changes. There was little evidence of a significant intercaloric intake, as compared with equivalent numaction between diet and physical activity (P>0.10 for the interaction in each bers of calories obtained from less processed, cohort). All weight changes were adjusted simultaneously for age, baseline higher-fiber foods that also contain healthy fats body-mass index, sleep duration, and changes in smoking status, physical activity, television watching, alcohol use, and all of the dietary factors and protein.27 Consumption of processed foods shown. The P value is less than 0.001 for all dietary factors with the excepthat are higher in starches, refined grains, fats, tion of butter in the NHS II, cheese in the NHS and NHS II, low-fat or skim and sugars can increase weight gain.28-30 milk in the NHS and HPFS, diet soda in the NHS, and whole-fat milk in all Some foods — vegetables, nuts, fruits, and three cohorts. whole grains — were associated with less weight gain when consumption was actually increased. Obviously, such foods provide calories and cannot Discussion violate thermodynamic laws. Their inverse assoWe found that multiple lifestyle changes were in- ciations with weight gain suggest that the increase dependently associated with long-term weight gain, in their consumption reduced the intake of other including changes in the consumption of specific foods to a greater (caloric) extent, decreasing the NHS (women) NHS II (women) HPFS (men)
2398
n engl j med 364;25 nejm.org june 23, 2011
The New England Journal of Medicine Downloaded from NEJM Media Center by KATIE HOBSON on June 21, 2011. Embargo lifted June 22, 2011 at 5pm ET. Copyright © 2011 Massachusetts Medical Society. All rights reserved.
Effect of Lifestyle on Weight Gain
Table 3. Pooled, Multivariable-Adjusted Results for the Relationships between Changes in Lifestyle Habits and Weight Change.* Lifestyle Habit
Weight Change Every 4 Years (95% Confidence Interval) Age-Adjusted Change lb
P Value
Multivariable-Adjusted Change† lb
P Value
Quintile 1: 42
3.97 (2.85 to 5.10)
<0.001
3.93 (2.88 to 4.98)
<0.001
Quintile 2: 47
2.32 (1.99 to 2.66)
<0.001
2.41 (1.96 to 2.87)
<0.001
Quintile 3: 50
2.08 (1.35 to 2.80)
<0.001
2.10 (1.37 to 2.83)
<0.001
Quintile 4: 54
1.64 (1.22 to 2.06)
<0.001
1.64 (1.22 to 2.05)
<0.001
Quintile 5: 60
Reference
Reference
Quintile 1: −16.3
Reference
Reference
Quintile 2: −2.59
−0.07 (−0.36 to 0.22)
0.64
−0.07 (−0.32 to 0.18)
0.60
Quintile 3: 1.59
−0.85 (−1.11 to −0.59)
<0.001
−0.81 (−1.02 to −0.60)
<0.001
Quintile 4: 6.49
−1.00 (−1.10 to −0.91)
<0.001
−0.92 (−1.02 to −0.83)
<0.001
Quintile 5: 23.2
−1.86 (−2.31 to −1.41)
<0.001
−1.76 (−2.14 to −1.38)
<0.001
0.39 (0.23 to 0.55)
<0.001
0.41 (0.23 to 0.59)
<0.001
Dietary change, median score‡
Physical-activity change, median change in MET-hr/wk
Increase in no. of alcohol drinks/day§ Total daily hr of sleep¶ <6
Reference
Reference
6 to 7
−0.36 (−0.43 to −0.29)
<0.001
−0.32 (−0.38 to −0.25)
<0.001
>7 to 8
−0.35 (−0.48 to −0.22)
<0.001
−0.30 (−0.42 to −0.18)
<0.001
>8
−0.09 (−1.11 to 0.92)
0.86
−0.09 (−0.96 to 0.78)
0.84
Missing data
−0.49 (−0.93 to −0.06)
0.03
−0.41 (−0.72 to −0.10)
0.01
0.32 (0.13 to 0.51)
0.001
0.31 (0.20 to 0.42)
<0.001
Increase in hr/day watching tele vision‖ Change in smoking status Never smoked, no change
Reference
Reference
Former smoker, no change
0.19 (0.13 to 0.25)
<0.001
0.14 (0.08 to 0.20)
<0.001
Current smoker, no change
−0.62 (−0.97 to −0.26)
<0.001
−0.70 (−1.10 to −0.31)
<0.001
Current smoker, changed to former smoker
4.99 (3.89 to 6.09)
<0.001
5.17 (4.06 to 6.29)
<0.001
Former smoker, changed to current smoker
−2.47 (−3.82 to −1.12)
<0.001
−2.81 (−4.24 to −1.38)
<0.001
Never smoked, changed to current smoker
0.67 (−1.48 to 2.82)
0.02
0.32 (−2.31 to 2.95)
0.81
* Data are based on a 20-year follow-up (1986–2006) in the Nurses’ Health Study (NHS), a 12-year follow-up (1991–2003) in the Nurses’ Health Study II (NHS II), and a 20-year follow-up (1986–2006) in the Health Professionals Follow-up Study (HPFS). Findings within each study and restricted to persons who never smoked were generally similar to these pooled results (see the tables in the Supplementary Appendix). To convert pounds to kilograms, divide by 0.45. † Values were adjusted for age, baseline body-mass index at the beginning of each 4-year period, and all the variables shown in the table simultaneously. ‡ Changes in dietary habits associated with weight change were derived by totaling the ordinal values for the quintiles of change for each dietary habit in ascending order (1 to 5) or descending order (5 to 1) for habits that were inversely or positively associated with weight gain, respectively. Scores ranged from 17 to 85. § Heterogeneity was evident across beverage types and changes (see the Supplementary Appendix for details). ¶ Data are based on absolute levels, owing to limited data on serial assessments of sleep for each cohort to assess change in each 4-year period. ‖ Differences in weight change are for increased television watching; the inverse difference would be associated with decreased watching. Values are based on data from the NHS II and the HPFS; limited serial assessments precluded an analysis of changes in television watching in the NHS.
n engl j med 364;25 nejm.org june 23, 2011
The New England Journal of Medicine Downloaded from NEJM Media Center by KATIE HOBSON on June 21, 2011. Embargo lifted June 22, 2011 at 5pm ET. Copyright © 2011 Massachusetts Medical Society. All rights reserved.
2399
The
n e w e ng l a n d j o u r na l
A NHS II (women)
NHS (women)
HPFS (men)
Pooled
5
4
3
2
1
Reference
Weight Change per 4-Year Period (lb)
6
0
1
2
3
4
5
6
7
8
9
10
Decile of Dietary Change
B
Weight Change per 4-Year Period (lb)
6 5
m e dic i n e
Figure 2. Relationships between Changes in Diet and Physical Activity and Weight Changes within Each 4-Year Period in the Three Cohorts. In a multivariable-adjusted analysis, overall dietary changes among the 120,877 men and women in the three cohorts were based on the sum of changes in the intake of fruits, vegetables, whole grains, nuts, refined grains, potatoes or french fries, potato chips, butter, yogurt, sugar-sweetened beverages, 100%-fruit juice, sweets and desserts, processed meats, unprocessed red meats, trans fat, fried foods consumed at home, and fried foods consumed away from home. Panel A shows the relationship between deciles of dietary change and weight change per 4-year period in the three cohorts separately and combined. As compared with persons in the top decile, persons in the bottom decile had a 5.48-lb greater weight gain (95% confidence interval [CI], 4.02 to 6.94). Panel B shows the relationship between the cross-stratified quintiles of changes in both dietary habits and physical activity with weight changes per 4-year period for the combined cohorts. As compared with persons in the top quintiles of both dietary change and physical-activity change, persons in the lowest quintiles had a 5.93-lb greater weight gain (95% CI, 4.35 to 7.52). There was little evidence of a significant interaction between diet and physical activity (P>0.10 for the interaction in each cohort). All weight changes were adjusted for age, baseline body-mass index, sleep duration, and changes in smoking status, physical activity, television watching, and alcohol use. P<0.001 for all comparisons.
4 3 2 1 2
1 3 0
4 1
2
3
Quintile of Dietary Change
Quintile of Physical Activity Change
5 4
5 Reference
overall amount of energy consumed. Higher fiber content and slower digestion of these foods would augment satiety, and their increased consumption would also displace other, more highly processed foods in the diet, providing plausible biologic mechanisms whereby persons who eat more fruits, nuts, vegetables, and whole grains would gain less weight over time. Yogurt consumption was also associated with less weight gain in all three cohorts. Potential mechanisms for these findings are unclear; in2400
of
triguing evidence suggests that changes in colonic bacteria might influence weight gain.31 It is also possible that there is an unmeasured confounding factor that tracks with yogurt consumption (e.g., people who change their yogurt consumption may have other weight-influencing behaviors that were not measured by our instruments). Our findings with regard to sugar-sweetened beverages are consistent with the results of prior observational studies and short-term interventions.7,32,33 Consumption of 100%-fruit juice was associated with weight gains of smaller magnitude, possibly because these beverages may be consumed in smaller servings than are sugarsweetened beverages or in different patterns (i.e., single rather than multiple servings).33 Findings have been inconsistent in prior studies of alcohol use and weight gain.34-37 In a previous analysis of alcohol consumption in relation to weight change in the NHS II cohort over a period of 8 years, the smallest weight gain was seen among women who remained moderate drinkers.36 The present findings suggest that the relationship between alcohol use and weight change is com-
n engl j med 364;25 nejm.org june 23, 2011
The New England Journal of Medicine Downloaded from NEJM Media Center by KATIE HOBSON on June 21, 2011. Embargo lifted June 22, 2011 at 5pm ET. Copyright © 2011 Massachusetts Medical Society. All rights reserved.
Effect of Lifestyle on Weight Gain
plex, and further analyses are needed that address potential heterogeneity with respect to sex, beverage type, baseline intake, direction of change, and duration of follow-up. Short-term controlled trials suggest that liquids are less satiating than solid foods, increasing the total amount of energy consumed.38 Overall, our analysis showed that changes in the consumption of all liquids except milk were positively associated with weight gain; our findings for high-carbohydrate beverages were consistent with those for refined carbohydrates and starches consumed in foods. Temporal trends render our findings especially relevant: between 1965 and 2002, U.S. beverage consumption increased from 11.8 to 21.0% of all calories consumed — 222 more kilocalories per person per day — with sugar-sweetened beverages and alcohol accounting for 60% and 32% of the increase, respectively.39 Our analysis showed relatively neutral associations between change in the consumption of most dairy foods and weight gains. Few prior studies have evaluated these relationships. Prior analyses of HPFS data showed associations similar to ours for the overall categories of whole-fat and low-fat dairy products,40 but subtypes (e.g., milk, cheese, and butter) were not evaluated independently. Among Swedish women, higher intakes of whole milk and cheese were inversely associated with weight gain; as in our study, significant associations with weight gain were not seen for other dairy foods.41 In several long-term studies, inverse associations between dairy consumption and the risk of insulin resistance, the metabolic syndrome, or diabetes were observed,42,43 but potential mediating effects on weight change were not evaluated. Limited short-term studies of dairy foods and satiety or weight change have had inconsistent results.44,45 Overall, our analysis showed divergent relationships between specific foods or beverages and long-term weight gain, suggesting that dietary quality (the types of foods and beverages consumed) influences dietary quantity (total calories). Several dietary metrics that are currently emphasized, such as fat content, energy density, and added sugars, would not have reliably identified the dietary factors that we found to be associated with long-term weight gain. For example, most of the foods that were positively associated with weight gain were starches or refined carbohydrates; no significant differences were seen for low-fat and skim milk versus whole-fat milk, and
the consumption of nuts was inversely associated with weight gain. Clear patterns were also not seen in the relationship between weight change and the energy density of dietary components (e.g., beverages of low energy density were strongly associated with weight gain). Foods that contained higher amounts of refined carbohydrates — whether these were added (e.g., in sweets and desserts) or were not added (e.g., in refined grains) — were associated with weight gain in similar ways, and potato products (which are low in sugars and high in starches) showed the strongest associations with weight gain. No single metric appears to capture these complexities. Our findings highlight gaps in our mechanistic understanding of how particular dietary characteristics alter energy balance, suggesting directions for future research regarding pathways involved in hunger, satiety, absorption, metabolism, and adipocyte growth or hyperplasia. In general, changes in the consumption of refined or processed foods and liquid carbohydrates or alcohol were positively associated with weight gain, whereas changes in the consumption of unprocessed foods such as whole grains, fruits, nuts, and vegetables were inversely associated with weight gain. These results suggest that future policies and research efforts to prevent obesity should consider food structure and processing as potentially relevant dietary metrics. Changes in physical activity were independently related to long-term changes in weight, supporting the biologic plausibility of our overall findings. Prior, smaller studies have shown inverse associations between activity changes and weight change.11,13 Prevalent (current) levels of physical activity are inconsistently related to weight change, with associations observed only for subgroups of persons14 or subtypes of activities.12 As seen in prior analyses of sugar-sweetened beverages,33 changes in lifestyle may be most relevant for weight gain. Persons may achieve a new steadystate weight within months after a change in regular physical activity, diet, or other lifestyle habits, highlighting the importance of repeated assessments of over time to discern long-term effects. Many prior studies of television watching and obesity have been cross-sectional, limiting the ability to make inferences about which came first.15 In controlled interventions, decreased television watching reduced weight gain in children,16,17 an effect that was mediated more by improvements in dietary habits than by a change in physical activity.
n engl j med 364;25 nejm.org june 23, 2011
The New England Journal of Medicine Downloaded from NEJM Media Center by KATIE HOBSON on June 21, 2011. Embargo lifted June 22, 2011 at 5pm ET. Copyright © 2011 Massachusetts Medical Society. All rights reserved.
2401
The
n e w e ng l a n d j o u r na l
Television watching appears to encourage snacking during viewing and also influences food choices both during viewing and at other times.46-52 Our long-term prospective evaluation provides evidence that both the duration of television viewing and changes in the duration of viewing influence weight gain in adults. Because these effects are probably mediated by changes in diet and physical activity, and may also be mediated by changes in sleep, the multivariable (mediator)–adjusted associations may underestimate the full effects of television watching. Decreases in sleep duration are concordant with the U.S. obesity epidemic.18,19,53 Data from crosssectional studies and some prospective studies, including a prior analysis of NHS data, support the relationship of shorter sleep duration with obesity.18 In short-term trials, reduced sleep alters leptin, ghrelin, subjective hunger, and preferences for calorie-dense, refined-carbohydrate foods.19 Our results suggest that the association between sleep duration and long-term weight gain is characterized by a U-shaped curve — that is, weight gain is lowest among persons who sleep 6 to 8 hours a night and is higher among those who sleep less than 6 hours or more than 8 hours. Future studies should evaluate how changes in sleep over time are related to weight gain. Our long-term follow-up data confirm prior observations that smoking cessation results in weight gain initially but in little weight change thereafter. The health benefits of cessation exceed any potential adverse effects — that is, active smokers are at higher risk for cardiovascular diseases, cancer, and diabetes than are former smokers.54 Smoking may also adversely alter the distribution of body fat, promoting visceral rather than femoral or subcutaneous fat deposition; thus, even in the setting of lower total weight, active smoking has adverse metabolic consequences, as evidenced, for example, by its links to a higher risk of type 2 diabetes. 55 Any relative weight loss seen with active smoking should not be considered beneficial, nor should the relative weight gain soon after smoking cessation be considered harmful. Our study has some limitations. Although dietary questionnaires specified portion sizes, residual, unmeasured differences in portion sizes among participants might account for additional independent effects on energy balance. For example, an average, large baked potato contains 278 calories, as compared with 500 to 600 calories 2402
of
m e dic i n e
for a large serving of french fries.56 The typical portion size of a specific food or beverage may therefore partly mediate its effects on weight gain (i.e., both average portion sizes and biologic effects). As for lifestyle behaviors, each was measured with some degree of error, which, if random, would underestimate their true relationships with weight change. Lifestyle changes were self-selected, and residual confounding from other lifestyle behaviors is possible. However, in contrast to prev alent behaviors, changes in these behaviors were generally not strongly correlated (r<⎪0.05⎪), which suggests that different behaviors are often changed relatively independently, thus minimizing potential confounding. A person’s weight change could lead to changes in lifestyle rather than vice versa. Such reverse causation would generally underestimate true effects. For example, persons who are gaining weight might plausibly either reduce their intake of sugar-sweetened beverages and sweets or increase their consumption of vegetables, leading to reverse bias with respect to the observed associations. As is the case with any biologic finding or medical intervention, our results represent the average population effect, and intraindividual var iations exist. The cohorts studied here largely comprised white, educated U.S. adults, which potentially limits the generalizability of the findings. Conversely, the ranges of dietary intakes were broad and overlapped with national estimates. In addition, our findings were broadly consistent with cross-sectional national trends with respect to diet and obesity: between 1971 and 2004, the average dietary intake of calories in the United States increased by 22% among women and by 10% among men, primarily owing to the increased consumption of refined carbohydrates, starches, and sugarsweetened beverages.39 Our findings were also consistent among the three cohorts and in analyses stratified according to smoking status, age, and baseline body-mass index, and it seems plausible that the biologic effects of many lifestyle factors would be qualitatively similar in other populations. A habitual energy imbalance of about 50 to 100 kcal per day may be sufficient to cause the gradual weight gain seen in most persons.57,58 This means that unintended weight gain occurs easily but also that modest, sustained changes in lifestyle could mitigate or reverse such an energy imbalance. Our findings suggest that both individual and population-based strategies to help people consume fewer calories may be most effec-
n engl j med 364;25 nejm.org june 23, 2011
The New England Journal of Medicine Downloaded from NEJM Media Center by KATIE HOBSON on June 21, 2011. Embargo lifted June 22, 2011 at 5pm ET. Copyright © 2011 Massachusetts Medical Society. All rights reserved.
Effect of Lifestyle on Weight Gain
tive when particular foods and beverages are targeted for decreased (or increased) consumption. Aggregate dietary changes accounted for substantial differences in weight gain, with additional contributions from changes in physical activity and television watching, thus highlighting specific lifestyle changes that might be prioritized in obesityprevention strategies. Supported by grants (DK46200, DK58845, HL085710, HL60712, HL35464, CA87969, CA50385, CA55075, and CA95589) from the National Institutes of Health and by the Searle Scholars Program. Dr. Mozaffarian reports receiving consulting fees from Nutrition Impact and Foodminds, lecture fees from Aramark, Unilever,
and SPRIM, royalties from UpToDate, and grant support on behalf of Harvard Medical School from GlaxoSmithKline, Sigma-Tau, and Pronova and being listed as a coinventor on a provisional patent application filed by and assigned to Harvard University for the use of trans-palmitoleic acid to prevent and treat insulin resistance, type 2 diabetes, and related conditions. Dr. Hu reports receiving lecture fees from Amgen, Nutrition Impact, Unilever, and the Institute of Food Technologies and grant support on behalf of the Harvard School of Public Health from Merck and the California Walnut Commission. No other potential conflict of interest relevant to this article was reported. Disclosure forms provided by the authors are available with the full text of this article at NEJM.org. We thank Dr. Donna Spiegelman for statistical advice, Dr. Francine Laden for comments during the preparation of an early version of the manuscript, and Dr. Peilin Shi for assistance with statistical programming.
References 1. Gardner CD, Kiazand A, Alhassan S,
et al. Comparison of the Atkins, Zone, Ornish, and LEARN diets for change in weight and related risk factors among overweight premenopausal women: the A TO Z Weight Loss Study: a randomized trial. JAMA 2007; 297:969-77. [Erratum, JAMA 2007;298:178.] 2. Shai I, Schwarzfuchs D, Henkin Y, et al. Weight loss with a low-carbohydrate, Mediterranean, or low-fat diet. N Engl J Med 2008;359:229-41. [Erratum, N Engl J Med 2009;361:2681.] 3. Sacks FM, Bray GA, Carey VJ, et al. Comparison of weight-loss diets with different compositions of fat, protein, and carbohydrates. N Engl J Med 2009;360:859-73. 4. Ello-Martin JA, Ledikwe JH, Rolls BJ. The influence of food portion size and energy density on energy intake: implications for weight management. Am J Clin Nutr 2005;82:Suppl 1:236S-241S. 5. van Dam RM, Seidell JC. Carbohydrate intake and obesity. Eur J Clin Nutr 2007; 61:Suppl 1:S75-S99. 6. Rosenheck R. Fast food consumption and increased caloric intake: a systematic review of a trajectory towards weight gain and obesity risk. Obes Rev 2008;9:535-47. 7. Wolff E, Dansinger ML. Soft drinks and weight gain: how strong is the link? Medscape J Med 2008;10:189. 8. Micha R, Mozaffarian D. Trans fatty acids: effects on metabolic syndrome, heart disease and diabetes. Nat Rev Endocrinol 2009;5:335-44. 9. Liu S, Willett WC, Manson JE, Hu FB, Rosner B, Colditz G. Relation between changes in intakes of dietary fiber and grain products and changes in weight and development of obesity among middle-aged women. Am J Clin Nutr 2003;78:920-7. 10. Buijsse B, Feskens EJ, Schulze MB, et al. Fruit and vegetable intakes and subsequent changes in body weight in European populations: results from the project on Diet, Obesity, and Genes (DiOGenes). Am J Clin Nutr 2009;90:202-9. 11. Haapanen N, Miilunpalo S, Pasanen M, Oja P, Vuori I. Association between lei-
sure time physical activity and 10-year body mass change among working-aged men and women. Int J Obes Relat Metab Disord 1997;21:288-96. 12. Wagner A, Simon C, Ducimetière P, et al. Leisure-time physical activity and regular walking or cycling to work are associated with adiposity and 5 y weight gain in middle-aged men: the PRIME Study. Int J Obes Relat Metab Disord 2001;25:940-8. 13. Gordon-Larsen P, Hou N, Sidney S, et al. Fifteen-year longitudinal trends in walking patterns and their impact on weight change. Am J Clin Nutr 2009;89:19-26. 14. Lee IM, Djoussé L, Sesso HD, Wang L, Buring JE. Physical activity and weight gain prevention. JAMA 2010;303:1173-9. 15. Robinson TN. Television viewing and childhood obesity. Pediatr Clin North Am 2001;48:1017-25. 16. Robinson TN. Reducing children’s television viewing to prevent obesity: a randomized controlled trial. JAMA 1999;282: 1561-7. 17. Epstein LH, Roemmich JN, Robinson JL, et al. A randomized trial of the effects of reducing television viewing and computer use on body mass index in young children. Arch Pediatr Adolesc Med 2008; 162:239-45. 18. Patel SR, Hu FB. Short sleep duration and weight gain: a systematic review. Obesity (Silver Spring) 2008;16:643-53. 19. Van Cauter E, Spiegel K, Tasali E, Leproult R. Metabolic consequences of sleep and sleep loss. Sleep Med 2008;9:Suppl 1: S23-S28. 20. Chan JM, Rimm EB, Colditz GA, Stampfer MJ, Willett WC. Obesity, fat distribution, and weight gain as risk factors for clinical diabetes in men. Diabetes Care 1994;17:961-9. 21. Willett WC, Manson JE, Stampfer MJ, et al. Weight, weight change, and coronary heart disease in women: risk within the ‘normal’ weight range. JAMA 1995; 273:461-5. 22. Colditz GA, Willett WC, Rotnitzky A, Manson JE. Weight gain as a risk factor
for clinical diabetes mellitus in women. Ann Intern Med 1995;122:481-6. 23. Rexrode KM, Hennekens CH, Willett WC, et al. A prospective study of body mass index, weight change, and risk of stroke in women. JAMA 1997;277:1539-45. 24. Eliassen AH, Colditz GA, Rosner B, Willett WC, Hankinson SE. Adult weight change and risk of postmenopausal breast cancer. JAMA 2006;296:193-201. 25. Thygesen LC, Grønbaek M, Johansen C, Fuchs CS, Willett WC, Giovannucci E. Prospective weight change and colon cancer risk in male US health professionals. Int J Cancer 2008;123:1160-5. 26. Flint AJ, Hu FB, Glynn RJ, et al. Excess weight and the risk of incident coronary heart disease among men and women. Obesity (Silver Spring) 2010;18:377-83. 27. Bornet FR, Jardy-Gennetier AE, Jacquet N, Stowell J. Glycaemic response to foods: impact on satiety and long-term weight regulation. Appetite 2007;49:535-53. 28. Rolls BJ, Roe LS, Beach AM, KrisEtherton PM. Provision of foods differing in energy density affects long-term weight loss. Obes Res 2005;13:1052-60. 29. Ello-Martin JA, Roe LS, Ledikwe JH, Beach AM, Rolls BJ. Dietary energy density in the treatment of obesity: a yearlong trial comparing 2 weight-loss diets. Am J Clin Nutr 2007;85:1465-77. 30. Ledikwe JH, Rolls BJ, SmiciklasWright H, et al. Reductions in dietary energy density are associated with weight loss in overweight and obese participants in the PREMIER trial. Am J Clin Nutr 2007;85:1212-21. 31. Kinross JM, von Roon AC, Holmes E, Darzi A, Nicholson JK. The human gut microbiome: implications for future health care. Curr Gastroenterol Rep 2008;10:396403. 32. Chen L, Appel LJ, Loria C, et al. Reduction in consumption of sugar-sweetened beverages is associated with weight loss: the PREMIER trial. Am J Clin Nutr 2009;89:1299-306. 33. Schulze MB, Manson JE, Ludwig DS,
n engl j med 364;25 nejm.org june 23, 2011
The New England Journal of Medicine Downloaded from NEJM Media Center by KATIE HOBSON on June 21, 2011. Embargo lifted June 22, 2011 at 5pm ET. Copyright © 2011 Massachusetts Medical Society. All rights reserved.
2403
Effect of Lifestyle on Weight Gain et al. Sugar-sweetened beverages, weight gain, and incidence of type 2 diabetes in young and middle-aged women. JAMA 2004;292:927-34. 34. Liu S, Serdula MK, Williamson DF, Mokdad AH, Byers T. A prospective study of alcohol intake and change in body weight among US adults. Am J Epidemiol 1994;140:912-20. 35. Wannamethee SG, Shaper AG. Alcohol, body weight, and weight gain in middle-aged men. Am J Clin Nutr 2003; 77:1312-7. 36. Wannamethee SG, Field AE, Colditz GA, Rimm EB. Alcohol intake and 8-year weight gain in women: a prospective study. Obes Res 2004;12:1386-96. 37. Wang L, Lee IM, Manson JE, Buring JE, Sesso HD. Alcohol consumption, weight gain, and risk of becoming overweight in middle-aged and older women. Arch Intern Med 2010;170:453-61. 38. Stull AJ, Apolzan JW, Thalacker-Mercer AE, Iglay HB, Campbell WW. Liquid and solid meal replacement products differentially affect postprandial appetite and food intake in older adults. J Am Diet Assoc 2008;108:1226-30. 39. Lloyd-Jones D, Adams RJ, Brown TM, et al. Heart disease and stroke statistics — 2010 update: a report from the American Heart Association. Circulation 2010; 121(7):e46-e215. [Erratum, Circulation 2010;121(12):e260.] 40. Rajpathak SN, Rimm EB, Rosner B, Willett WC, Hu FB. Calcium and dairy intakes in relation to long-term weight gain in US men. Am J Clin Nutr 2006;83:559-66. 41. Rosell M, Håkansson NN, Wolk A. Association between dairy food consumption and weight change over 9 y in 19,352 perimenopausal women. Am J Clin Nutr 2006;84:1481-8.
42. Tremblay A, Gilbert JA. Milk products,
insulin resistance syndrome and type 2 diabetes. J Am Coll Nutr 2009;28:Suppl 1: 91S-102S. 43. Tong X, Dong JY, Wu ZW, Li W, Qin LQ. Dairy consumption and risk of type 2 diabetes mellitus: a meta-analysis of cohort studies. Eur J Clin Nutr 2011 May 11 (Epub ahead of print). 44. Lanou AJ, Barnard ND. Dairy and weight loss hypothesis: an evaluation of the clinical trials. Nutr Rev 2008;66:272-9. 45. Dove ER, Hodgson JM, Puddey IB, Beilin LJ, Lee YP, Mori TA. Skim milk compared with a fruit drink acutely reduces appetite and energy intake in overweight men and women. Am J Clin Nutr 2009;90:70-5. 46. Coon KA, Goldberg J, Rogers BL, Tucker KL. Relationships between use of television during meals and children’s food consumption patterns. Pediatrics 2001;107(1):E7. 47. Vereecken CA, Todd J, Roberts C, Mulvihill C, Maes L. Television viewing behaviour and associations with food habits in different countries. Public Health Nutr 2006;9:244-50. 48. Utter J, Scragg R, Schaaf D. Associations between television viewing and consumption of commonly advertised foods among New Zealand children and young adolescents. Public Health Nutr 2006;9: 606-12. 49. Temple JL, Giacomelli AM, Kent KM, Roemmich JN, Epstein LH. Television watching increases motivated responding for food and energy intake in children. Am J Clin Nutr 2007;85:355-61. 50. Dubois L, Farmer A, Girard M, Peterson K. Social factors and television use during meals and snacks is associated with higher BMI among pre-school children. Public Health Nutr 2008;11:1267-79.
51. Manios Y, Kondaki K, Kourlaba G,
Grammatikaki E, Birbilis M, Ioannou E. Television viewing and food habits in toddlers and preschoolers in Greece: the GENESIS study. Eur J Pediatr 2009;168: 801-8. 52. Escobar-Chaves SL, Markham CM, Addy RC, Greisinger A, Murray NG, Brehm B. The Fun Families Study: intervention to reduce children’s TV viewing. Obesity (Silver Spring) 200100;18:Suppl 1:S99-S101. 53. 2010 Sleep in America poll. Washington, DC: National Sleep Foundation, 2010. 54. Office on Smoking and Health National Center for Chronic Disease Prevention and Health Promotion. Women and smoking: a report of the Surgeon General. Atlanta: Centers for Disease Control and Prevention, March 2001. 55. Willi C, Bodenmann P, Ghali WA, Faris PD, Cornuz J. Active smoking and the risk of type 2 diabetes: a systematic review and meta-analysis. JAMA 2007;298:2654-64. 56. U.S. Department of Agriculture, Agricultural Research Service. USDA national nutrient database for standard reference. Release 23. 2010. (http://www.ars.usda.gov/ ba/bhnrc/ndl.) 57. Plachta-Danielzik S, Landsberg B, BosyWestphal A, Johannsen M, Lange D, Müller MJ. Energy gain and energy gap in normalweight children: longitudinal data of the KOPS. Obesity (Silver Spring) 2008;16:77783. 58. Zhai F, Wang H, Wang Z, Popkin BM, Chen C. Closing the energy gap to prevent weight gain in China. Obes Rev 2008;9: Suppl 1:107-12. Copyright © 2011 Massachusetts Medical Society.
an nejm app for iphone
The NEJM Image Challenge app brings a popular online feature to the smartphone. Optimized for viewing on the iPhone and iPod Touch, the Image Challenge app lets you test your diagnostic skills anytime, anywhere. The Image Challenge app randomly selects from 300 challenging clinical photos published in NEJM, with a new image added each week. View an image, choose your answer, get immediate feedback, and see how others answered. The Image Challenge app is available at the iTunes App Store.
2404
n engl j med 364;25 nejm.org june 23, 2011
The New England Journal of Medicine Downloaded from NEJM Media Center by KATIE HOBSON on June 21, 2011. Embargo lifted June 22, 2011 at 5pm ET. Copyright © 2011 Massachusetts Medical Society. All rights reserved.