designideas readerS SOLVE DESIGN PROBLEMS
Circuit maximizes pulse-widthmodulated DAC throughput
DIs Inside 52 A circuit for mains synchronization has two separate outputs for each half-period
Ajoy Raman, Bangalore, India
↘
Simple DACs realized by lowpass filtering microcontrollergenerated pulse-width-modulated (PWM) signals have a response that is typically a tenth of the PWM frequency. This Design Idea is a novel implementation of a previously published method1 employing a reference ramp whose output is sampled and held by the PWM signal. This approach results in a throughput rate equal to the PWM frequency. You can use the circuit in Figure 1 to implement a ±10V 10-bit DAC with a throughput of 20 kHz. A DSPIC30F4011 microcontroller (not shown) is operated at a clock frequency of 96 MHz to gener-
ate the capture signals OC1 and OC4. Clock/4 is fed to an internal 16-bit timer whose period is set for a count of 1200 corresponding to a PWM frequency of 20 kHz. Signal OC4 is mostly high and goes low at a fixed count of 1170 as a reference for ramp generation. IC1A, along with Q1, forms a precision constant-current source that linearly charges capacitor C2 when Q2 is off. This signal inverted by IC3A switches Q2 on for a period of 30 counts to discharge C2 for the start of the next ramp. IC1B buffers, amplifies, and offsets the ramp; potentiometers R2 and R5 adjust the offset and gain. The OC1 falling edge controls the PWM DAC sample timing relative to
15V
15V R1 2.7k
R7 18k
14 PIN 19 OC4
R2 1k
PIN 23 OC1
8
7
IC3A CD40106
C3 680 pF
the ramp voltage. The data word to be converted determines the OC 1 duty cycle by comparing it internally in the
R6 1k
1
6
Q1
15V −
IC1B LF353
7
ANALOG IN
3
Q2
C2 0.1 μF MYLAR
1
2
IC2 LF398
5 +
15V
R8 2.2k
▶To see and comment on all of EDN’s Design Ideas, visit www.edn.com/designideas.
R3 18k
BC177
2
1
OUTPUTS FROM DSPIC30F4011
3+
58 Filter quashes 60-Hz interference
R4 56k
4
IC1A LF353
R5 10k
5V
−
57 DC-DC converter starts up and operates from a single photocell
5V
–15V 2
55 Low-component-count zero-crossing detector is low power
8 S/H IN
BC107
4
7
6
5
DAC OUTPUT
C1 1800 pF
–15V
5V R9 1.8k
IC3B CD40106 3
4
Figure 1 The off-page microcontroller generates signals for ramp control (OC4) and sample timing (OC1).
[www.edn.com]
March 2013 | EDN 51
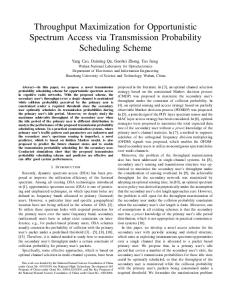
designideas the initial nonlinear region of the ramp so that the PWM DAC shows good linearity with a LSB of 20 mV and an accuracy of ±40 mV. Additional PWM DACs could also be implemented using capture PWM outputs OC2 and OC3. Figure 2 shows the waveforms to be expected for a DAC output corresponding to 256 on a 10-bit scale of 1024. OC4 forms the PWM reference based on which a 20-kHz bipolar ramp signal is output at Pin 7 of IC1B. This ramp is sampled and held at a count of 256+88=344, corresponding to a DAC output of −5V. EDN
10 IC1B - PIN 7 RAMP ANALOG SIGNALS
0 DAC OUTPUT
–10 H
S/H SIGNAL FOR 344 COUNTS DIGITAL SIGNALS
L H
OC1 PWM DAC SIGNAL
L H
OC4 PWM REF
L 0
10
20
30
40
50
60
70
80
90
100
TIME (μSEC)
Figure 2 The differentiated OC1 falling edge generates the S/H sample pulse at the ramp −5V point.
References
the DAC output and is adjusted to −10, 0, and +10V for OC1 PWM counts of 88, 600, and 1112, respectively, corresponding to a 10-bit count of 1024. The count offset of 88 helps to avoid
microcontroller with the internal 16-bit timer. C3 and R9 differentiate the resulting PWM signal; IC3B then inverts it, forming a 1-μsec sample signal for the sample-and-hold IC2. Pin 5 of IC2 forms
A circuit for mains synchronization has two separate outputs for each half-period EDNDI5324 Fig 2.eps
DIANE
Dušan Ponikvar, University of Ljubljana, Ljubljana, Slovenia
↘
Often a measurement of weak signals has to be performed in the presence of strong interference from the ac power mains. If the interfering signal cannot be filtered out, then you can still obtain a clean result by making two
Kester, Walt (editor), The Data Conversion Handbook, section 3-1, pg 3-28, Newnes, 2005, http://bit.ly/ KjU8fU. 2 Raman, Ajoy, “Universal Analog Hardware Testbench,” http://bit.ly/ QCYXmb. 1
consecutive measurements separated in time by an odd number of half-periods of the mains and calculating the average of the two measurements. The interfering signals have opposite polarities in consecutive measurements, and averag-
ing cancels them out. If you average several consecutive pairs of measurements, the results will improve still further. Instead of counting the half-periods of the mains, you may find that a circuit having two outputs for synchronization with odd or even half-periods of the mains can come in handy. The circuit shown in Figure 1 provides two separate and optically isolated outputs, ISO1 and ISO2, for synchronization with the desired half-period of the mains. Figure 2 shows the results of simulation (using the free version of 5V R6 10k
D1
MAINS
R1A 120k
R1B 120k
R2A 120k
C1 R2B 10 nF 120k
D2
R3 47k
OC1 4N33
ISO1
Q5
D3 D4
D5
C3 1 μF 10V
R7 10k
R4 47k
C2 1 μF 10V
2N3904
OC2 4N33 ISO2
Figure 1 Mains zero crossings are marked by the optically isolated outputs.
52 EDN | March 2013
[www.edn.com]
designideas ac, and the reverse voltage on the diodes is less than 6V. The peak current through the optocoupler LEDs is below 8 mA. The only components that are exposed to the mains are input resistors R1A, R1B, R2B, and R2B. They have equal values, so each one needs to withstand 25% of the mains voltage. The measurements obtained from the constructed circuit show good correlation with the simulation results. Figure 3 shows output signals; Figure 4 shows the timing detail of the zero crossing and corresponding output pulse for three different values of C1. EDN
ISO1
VOLTAGE (V)
ISO2
MAINS
References
TIME (mSEC)
Figure 2 Simulation results demonstrate the circuit action.
1 “DIY: Isolated high-quality mains voltage zero-crossing detector,” www.dextrel.net/ diyzerocrosser.htm. 2 Matteini, Luca, “Mains-driven zero-crossing detector uses only a few high-voltage parts,” EDN, Dec 1, 2011, www.edn.com/4368740.
TINA-TI). The circuit accepts mains input from 80V ac to 240V ac, and consumes less than a milliamp of current. The duration of the pulses at outputs ISO1 and ISO2 is less than a millisecond, and capacitor C1 can be adjusted to achieve the exact alignment of the falling edges of outputs ISO1 and ISO2 with the zero crossing of the mains. All diodes, D1 to D5, are small-signal type 1N4148 or similar. The circuit works as follows: During the positive halfperiod of the mains, C3 is charged through R1A, R1B, D1 and D5, D3, R2B, and R2A. The effective time constant, τ, for charging is about 43 msec, and C3 barely picks up some charge in the half-period. Once the mains drops below the voltage stored on C3 (this happens just before the end of the half-period),
The circuit accepts mains input from 80V ac to 240V ac. the charging stops and current begins to flow from C3 through R3 into the base of Q5, turning it on. This discharges C3 through the LED in optocoupler OC1, and produces a pulse at the output ISO1 of the circuit. During the negative halfperiod, the action repeats, only this time D4 and D2 are used to charge C2, and R4 is used to activate Q5 when the negative half-period is nearly finished. The duration of the output pulse can be shortened to about 600 μsec by increasing the time constant—therefore by increasing the value of resistors R1 and R2 or capacitors C2 and C3—but this also reduces the range of acceptable input voltages. The detailed simulation reveals that the maximum voltage on C2 and C3 is less than 5V, with 250V ac connected to the input; a voltage rating of 10V for the capacitors is sufficient. Additionally, the maximum voltage on C1 is less than 10V 54 EDN | March 2013
Figure 3 Measured output signals ISO1 and ISO2 and the mains voltage verify the circuit operation.
Figure 4 C1 determines the position of the pulse leading edge in this detail from the center portion of Figure 3. The horizontal scale is 200 µsec/div. Pulses are vertically shifted for better visibility: C1=0 (upper), 12 nF (middle), and 22 nF (lower).
[www.edn.com]
Low-component-count zero-crossing detector is low power C Castro-Miguens and M Pérez Suárez, University of Vigo, Spain, and JB Castro-Miguens, Cesinel, Madrid, Spain
↘
There are many circuits published showing zero-crossing detectors for use with 50- and HCPL-4701 C I (t) 60-Hz power lines. Though the cir8 C VC=5V + cuit variations are plentiful, many 100 nF have shortcomings. This Design 2 1N4007 6 Idea shows a circuit that uses only a few commonly available parts and R1 VI(t) VAC 0.25W 3 provides good performance with 5 1,4,7: N.C. VO low power consumption. D1 1N4007 In the circuit shown in Figure 3.3k 1, a waveform is produced at VO – with rising edges that are synchronized with the zero crossings of the line voltage, VAC. The circuit can Figure 1 The zero-crossing detector uses few components and consumes very little be easily modified so that it propower. The VO signal has a rising edge that is coincident with each zero crossing of the duces a falling-edge waveform that line voltage, VAC. is synchronized with VAC. The circuit operates as follows. At the zero crossings of VAC, the current through the capaci- given minimum supply-voltage value, the intensity exceeds tor and the LED of the HCPL-4701 optocoupler satisfies the triggering threshold value for the optocoupler. In the case Equation 1 below. Equation 2 shows the standard conver- of the HCPL-4701, it is IF(ON)=40 μA. Diode D1 not only allows for the capacitor to discharge sion between radians per second and hertz; it also shows the derivation and explanation for vi(t). Equations 3 and but also prevents the application of a reverse voltage on the 4 show the simplification used in Equation 1. Because the LED. The maximum reverse input voltage of the HCPLvoltage across the LED is close to constant, differentiation 4701 is 2.5V. of that value with respect to time results in a zero value. Resistor R1 is included in order to discharge the energy stored in the capacitor in the latter portion of each cycle of vi(t) when ic(t)<0 (Figure 1). Its maximum value is limited d d ic(t)=iLED(t)=C dt [vi(t)–vLED]≈C dt ×vi(t) by the capacitor, by the peak value of the supply voltage (VAC-PEAK), and by the maximum acceptable time delay of =C×ω×VAC–PK×cos(ωt)→ic(0)≈C×ω×VAC–PK , (1) the current rising edges through the LED with respect to the corresponding ac-voltage zero crossing (Figure 2). Its EDNDI5314 Fig 1.eps DIANE minimum value is limited by the maximum allowable power where ω=2×π×fAC and dissipation in R1 ([VAC-RMS]2/R1). A practical compromise has (2) vi(t) =|VAC(t)|=|VAC–PK×sin(ωt)|. to be reached. Table 1 shows the time delay (tDELAY) of the current rising edges through the LED and the power dissipation for three d different values of R1. Notice that the time delay of the risC dt [vi(t)–vLED] ing edges of VO with respect to the zero crossings of VAC must d (3) =C dtd ×vi(t)–C dt × vLED≈C dtd ×vi(t),
because C
d dt
× vLED≈0 (vLED≈constant).
(4)
The peak value of the current through the LED is a function of the capacitor, C, so you must choose a value for C under the constraint that at the initial time (t=0) and for a [www.edn.com]
Table 1 iLED time delay for different values of R1 R1
tDELAY (μSEC)
V2AC-RMS/R1 (mW)
470 kΩ
60
112.5
820 kΩ
100
64.5
4.7 MΩ
450
11.2
March 2013 | EDN 55
designideas 350 300 250 200 150 100 50 0
R1=820k R1=4.7M VAC-PEAK=325V
vi(t)
tDELAY (R1=4.7M)
tDELAY (R1=820k)
6e-005 4e-005 ILED(t)
2e-005 0 –2e-005 0.004
0.006
0.008 TIME (SEC)
0.01
0.012
Figure 2 The relationship between vi(t) and ILED(t) is a function of the value of R1. The time delay between the zero crossing and the LED current is shown.
Figure 4 Empirical results are shown for VAC=115VRMS, C=1 nF, and R1=220 kΩ. EDNDI5314 Fig 2.eps
Figure 5 Empirical results are shown for VAC=267VRMS, C=1 nF, and R1=220 kΩ.
DIANE
include an additional delay for the optocoupler’s propagation time delay. The HCPL-4701 has a typical propagation time delay of 70 μsec. Based on the previous information, the following practical values for C and R1 are obtained: • For VAC=230VRMS±20% (Figure 3): C=0.5 nF/400V (MKT-HQ 370 polyester metallized, MKT series), R1=560 kΩ/0.25W, tDELAY=114 μsec (the time delay in the rising edges of VO with respect to the zero crossings of VAC), and P≈100 mW (average power from the ac line). • For VAC=115VRMS±20% (Figure 4): C=1 nF/200V, R1=220 kΩ/0.25W, tDELAY=130 µsec (time delay in the rising 56 EDN | March 2013
Figure 3 Empirical results are shown for VAC=230VRMS, C=0.5 nF, and R1=560 kΩ.
edges of VO with respect to the zero crossings of VAC), and P≈65 mW (average power from the ac line). • For operation from 80 to 280VRMS: C=1 nF/400V and R1=330 kΩ/0.25W. Empirical results are shown for VAC=267VRMS, C1=1 nF, and R1=220 kΩ (Figure 5). Additional empirical results can be viewed in the online version of this Design Idea, which is available at www.edn.com/4408530. Note that as with any device connected directly to the mains, exercise extreme caution while bench testing the circuit. Follow proper guidelines when laying out a printed circuit board. EDN [www.edn.com]
DC-DC converter starts up and operates from a single photocell Marián Štofka, Slovak University of Technology, Bratislava, Slovakia
↘
The bq25504 from Texas Instruments is a good candidate to become a milestone on the road to micro-power management and energy harvesting. A prominent feature of this IC is its ability to start up at a supply voltage as low as 330 mV typically, and 450 mV guaranteed. With an SMD inductor and a few capacitors and resistors, it forms a dc-dc converter with a high power efficiency that is unprecedented, especially in the ultralow-power region. A possible explanation for this breakthrough in achieving an extremely low value of start-up voltage could be the use of an internal oscillator based on submicron-wide-channel FET transistors. It is known that the narrower the FET’s channel is, the lower its threshold value of gate-source voltage will be— down to a few hundred millivolts. You
could assume that FETs in the internal oscillator of the bq25504 have a threshold voltage on the order of 200 mV. The circuit in Figure 1 differs from those shown in the bq25504 data sheet (www.ti.com/product/bq25504) in that it exploits a feature of the bq25504: The reference voltage at VBAT_OV (overvoltage) is internally multiplied by a factor of 3/2, as compared with the reference voltage at VBAT_UV (undervoltage). If limiting the battery voltage within an interval of VBAT_UV and (3/2)×VBAT_UV suits your application, you can connect the VBAT_UV and VBAT_OV inputs as shown in the figure and use a single resistor divider network for both, instead of two separate divider networks. Thus, not only do you save two resistors, but you also can lower the value of the sum of resistances as RUV1+RUV2=5M without sacrificing the overall power
TANTALUM SOLID CBAT 47 μF 13 VSS
OUTPUT
14 VBAT
22 μH
CSTOR 4.7 μF
+
15 VSTOR
16 LBST
12 AVSS NC 11 VBAT_OK
ROK2 4M ROK3 1M
VSS 1
IC1 BQ25504
10 OK_PROG
VIN_DC 2 ROC2 4.12M ROC1 15M
VREF_SAMP 4
VBAT_UV VRDIV VBAT_OV OT_PROG 8
CIN 4.7 μF
VOC_SAMP 3
9 OK_HYST 7
6
4.4V
5
PD
CREF 10 nF
RUV2 2.67M RUV1 2M
Figure 1 By exploiting the inherent weights of VBAT_UV and VBAT_OV inputs as 2/3:1, you can save at least two precision resistors in many applications. (IC1 is shown from the bottom view since, if breadboarding, the package style requires connections from the bottom.)
[www.edn.com]
efficiency of the circuit. As a by-product, you get a higher insensitivity to EMI at the VBAT_UV and VBAT_OV inputs. The bq25504 has an ability to draw the maximum possible power from an input source. A photovoltaic cell, due to its nonlinear nature, outputs maximum power at about 80% of its open-circuit voltage. Resistors ROC1 and ROC2 determine this operating point of the solar cell, PD. This novel IC even tracks the chosen source operation point slowly to get as much power as possible under varying input source capability. Experiments were performed with a single solar cell of diameter D=7.5 cm positioned horizontally on a desk located 1 meter from a window. Although it was sunny outside, practically no direct sunlight passed through the window. Under these circumstances, the shortcircuit current, ISH, of the solar cell was 16.27 mA. Note that the ISH of the same cell reaches a value of 300 mA when the plane of the cell is oriented perpendicularly to full-sun radiation. With no load on the converter, the output voltages VBAT and VSTOR varied from 4.396V to 4.404V. This ±0.1% variation can be attributed to the fact that the boost converter operates in discontinuous mode to compensate for self-discharge of the capacitors CBAT and CSTOR and then idles for a relatively long time. The solar-cell terminal voltage was 0.441V with the converter unloaded. When a 10-kΩ load resistor was connected to the VBAT output, this “wavering” of VBAT and VSTOR disappeared, and both become a constant 4.4V. The dc component of VIN_DC dropped to 0.4073V. By increasingly shadowing the solar cell with a metallic plate and thus depleting the energy available, I was able to reach an operating point where the output voltage was still 4.4V, while the mean value of voltage at the photocell terminals had dropped to 0.336V. It can be assumed that at this point the converter had entered a continuous-operation mode. (Note that even though the bq25504 data sheet shows VSTOR as the loaded output, in this application VBAT is used as the output because even a low output voltage is often better than none under energydeficient conditions.)EDN March 2013 | EDN 57
designideas CLASSICS
RQ=(4Q−2)R7.
Originally published in the December 19, 1991, issue of EDN
Filter quashes 60-Hz interference Adolfo A Garcia, Analog Devices, Santa Clara, CA
↘
The circuit in Figure 1 filters 60-Hz interference from lowfrequency, low-level signals. The filter exhibits 40-dB rejection (Q=0.75) and draws 95 μA max from a single-sided 5V supply. Resistors R1, R2, and R3 and capacitors C1, C2, and C3 form a classic twin-T section, and IC1 and IC2 provide local and global feedback. The frequency
If additional rejection is needed, cascade filter sections. selectivity (Q) and the rejection performance of this active filter are very sensitive to the relative matching of the capacitors and resistors in the twin-T section. Table 1 shows rejection and Q
as a function of the value of RQ. R4, R5, C4, and IC3 form a very-lowimpedance reference source to bias IC1 and the twin-T section to half the supply voltage. To configure the filter to operate at 60 Hz, choose a Q that will provide enough rejection without excessive loss of desired low-frequency signals that may be close to the filter’s notch frequency. The value of RQ is expressed as
The gain of the output amplifier is simply that of a conventional noninverting amplifier: A=1+(RQ/R7)=4Q−1, and the overall gain of the band-reject filter below and above the notch frequency is expressed as VOUT/VIN=2A/(1+A). If you need additional rejection, cascade filter sections. Keep in mind that you might have to modify the circuit to account for out-of-band gain multiplication.EDN
Table 1 RQ rejection at 60 Hz, and the filter’s voltage gain as a function of the filter Q Filter Q
RQ (kΩ)
Rejection (dB)
VOUT/VIN
0.75
1
40
1.33
1
2
35
1.5
1.25
3
30
1.6
2.5
8
25
1.8
5
18
20
1.9
10
38
15
1.95
Figure 1 This notch filter suppresses 60-Hz interference in low-frequency signals.
58 EDN | March 2013
[www.edn.com]