Article pubs.acs.org/est
Conversion of Iodide to Hypoiodous Acid and Iodine in Aqueous Microdroplets Exposed to Ozone Elizabeth A. Pillar,† Marcelo I. Guzman,*,† and Jose M. Rodriguez‡ †
University of Kentucky, Department of Chemistry, Lexington, Kentucky 40506, United States NASA Goddard Space Flight Center, Greenbelt, Maryland 20771, United States
‡
S Supporting Information *
ABSTRACT: Halides are incorporated into aerosol sea spray, where they start the catalytic destruction of ozone (O3) over the oceans and affect the global troposphere. Two intriguing environmental problems undergoing continuous research are (1) to understand how reactive gas phase molecular halogens are directly produced from inorganic halides exposed to O3 and (2) to constrain the environmental factors that control this interfacial process. This paper presents a laboratory study of the reaction of O3 at variable iodide (I−) concentration (0.010−100 μM) for solutions aerosolized at 25 °C, which reveal remarkable differences in the reaction intermediates and products expected in sea spray for low tropospheric [O3]. The ultrafast oxidation of I− by O3 at the air−water interface of microdroplets is evidenced by the appearance of hypoiodous acid (HIO), iodite (IO2−), iodate (IO3−), triiodide (I3−), and molecular iodine (I2). Mass spectrometry measurements reveal an enhancement (up to 28%) in the dissolution of gaseous O3 at the gas−liquid interface when increasing the concentration of NaI or NaBr from 0.010 to 100 μM. The production of iodine species such as HIO and I2 from NaI aerosolized solutions exposed to 50 ppbv O3 can occur at the air−water interface of sea spray, followed by their transfer to the gas-phase, where they contribute to the loss of tropospheric ozone.
■
INTRODUCTION Increasing levels of greenhouse gases in the atmosphere over the past 160 years have led to a significant climate perturbation in the present time scale.1 Ozone, O3(g), near the tropopause is an important greenhouse gas. Thus, a better understanding of the anthropogenic effects on climate requires the full characterization of the pathways of production and destruction of tropospheric O3(g). Ozone molecules also play a key role in tropospheric chemistry, absorb infrared radiation, and have adverse effects in air quality and public health. The major source of ozone in the lower atmosphere is the oxidation of organic compounds and carbon monoxide in the presence of nitrogen oxides occurring over the continents, followed by a minor contribution from stratospheric influx.2,3 Ozone is transported from continental regions to the marine boundary layer (MBL), where major ozone loss occurs, primarily due to photolysis in the presence of water. However, the ozone loss calculated with all known losses, excluding halogens, accounts for only about 50% of the observed loss.4 Similarly to the stratospheric destruction of ozone by chlorine and bromine, halogen species emitted from surface waters, can contribute to the global decrease of ozone levels.4 The destruction of tropospheric O3(g)5,6 occurs at air−water and air-ice interfaces, mediated by heterogeneous reactions7−10 catalyzed by organic species.11−13 The activation of halogens, such as Br2 and I2, to participate in the photochemical depletion of tropospheric ozone remains poorly understood.14 It is well© 2013 American Chemical Society
known that marine macroalgae in coastal regions produce I2, rather than iodine-containing organic compounds, which is transferred to the atmosphere and photoactivated to release iodine atoms.15,16 However, measurements over the open ocean cannot be explained by this mechanism of O3 loss.17 Perhaps, a major contribution to the loss of tropospheric ozone over the open ocean originates from inert halide ions (e.g., Br− and I−)18,19 or oxyanions (e.g., IO3−),20 which are somehow converted into molecular halogens (e.g., Br2 and I2), and reactive halogen species, RHS (e.g., Br•, BrO•, and IO•). RHS deplete the level of O3(g) (∼50 ppbv) during early spring in the Artic troposphere.5,21−23 The production of I2(g) and HOI(g) from submicromolar levels of aqueous I− reacting with O3(g) in the top micrometer surface layer of the ocean (pHocean ≈ 8)24 functions as a source of IO• radicals independent of the bulk pH.23 The process of sea spray formation generates negatively charged droplets that contain dissolved halides salts25 and establishes a negative current into the atmospheric boundary layer.26,27 We have previously shown how the fractionation of halides species occurring at the air−water interface28,29 during aerosol formation depends mainly on the concentration of Received: Revised: Accepted: Published: 10971
April 19, 2013 August 26, 2013 August 29, 2013 August 29, 2013 dx.doi.org/10.1021/es401700h | Environ. Sci. Technol. 2013, 47, 10971−10979
Environmental Science & Technology
Article
min−1) produced in a spark discharge ozone generator (Ozone Solutions) fed with O2(g). The ultrahigh purity gases used were from Scott-Gross. UV absorption spectrophotometry allows the quantification of O3(g)37 diluted in N2(g) in a 10-cm path length cuvette (Supporting Information), which is transported to a stainless steel tube, positioned 32 mm far from the entrance cone and 12 mm from the needle tip carrying the solution. Furthermore, a final 61-times dilution with the N2(g) nebulizing gas (12.0 L min−1) occurs in the chamber. Therefore, the experiments yield fundamental mechanistic information covering the low [O3(g)] found in the troposphere. The encounter of O3(g) with the microdroplets containing I− produces oxidized species. The overall time from the formation of droplets, transport through the O3(g) plume, and ion detection is <1 ms. However, the contact time between O3(g) and the plume of microdroplets is τ ≈ 1 μs (Supporting Information). In summary, the experimental conditions were: Drying gas temperature, 25 °C; nebulizer voltage, −2.5 kV; cone voltage, −70 V; and nebulizer pressure, 70 psi. The solvent background was subtracted from the mass spectrum of the sample acquired at fixed time intervals (e.g., time ≥1 min). More details of the experimental methods are available as Supporting Information.
species present in surface waters that is strongly biased by the size of the ions.18 However, the remaining question to be answered is: How do those aerosolized inert halide salts are later oxidized to become RHS in the air?14,30 Thus, it is crucial to identify the mechanisms of production of halogen oxides in the tropical MBL.1,31−34 Electrospray ionization mass spectrometer (ESI-MS) was recently used at high temperature (350 °C) to propose that interfacial reactivity patterns exist in microdroplets.35,36 However, experiments at lower temperature are needed together with a detailed analysis of the direct reaction products and intermediates for the reaction of iodide at variable ozone concentration to model the loss of ozone. In this article, we investigate a widespread effect of halides reactions with ozone to produce I2 and reactive species at the air−water interface at 25 °C to simulate the nonphotochemical processes occurring in the MBL. We report the enhanced dissolution of O3 in aerosolized microdroplets with increasing sodium halide (X− = Br−, I−) concentration (10 nM−100 μM). In addition, we study the cycle of ozone destruction on microdroplets by freshly produced iodine species, such as HIO, HIO2, and HIO3, the effect of polysorbate 20 surfactant to enhance or suppress the production of iodine species, and detect for the first time the reaction intermediate HI2O− for the production of I2.
■
■
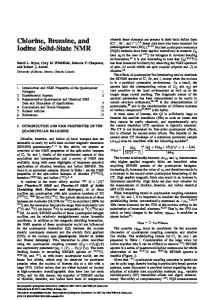
RESULTS AND DISCUSSION Reactions of Ozone with Iodide at the Air−Water Interface. Figure 1 shows electrospray mass spectra of aerosolized NaI aqueous solutions exposed to a flow of 0.2 L min−1 (A) N2(g), (B) 50 ppbv, (C) 130 ppbv, (D) 492 ppbv, and (E) 1.393 ppmv ppmv O3(g) at pH = 6.2. In the absence of ozone (Figure 1A), only I− (m/z = 127) is detected. Upon addition of 50 ppbv O3(g), significant changes are observed (Figure 1B), the ion count of I− decreases and new peaks appear: IO− (m/z = 143, the conjugate base of HIO) and its hydrate H2O·IO− (m/z = 161), a trace of IO2− (m/z = 159),38 I2 (detected as I2−̇ at m/z = 254) becomes the dominant peak,39 HI2O− (m/z = 271) the short-lived reaction intermediate for the production of I2, a practically imperceptible trace of NaI2− (m/z = 277) cluster,40 and I3− (m/z = 381).41 The same products are observed for 130 ppbv O3(g) (Figure 1C). A farther increase to 492 ppbv O3(g) clearly shows (1) the appearance of additional peaks (Figure 1D) for aqueous O3 (detected as O3−̇ at m/z = 48), IO3− (m/z = 175), (2) an enhancement in the ion count of IO−, IO2−, H2O·IO−, (3) a decrease of I−, I2, I3−, and (4) the complete loss of HI2O−. An increase in the production of IO3− is detected at 1.393 ppmv O3(g) (Figure 1E). The fact that we detect neutral species, such as O3 and I2, imply that a mechanism of charge transfer is operative. Because m/z = 48 is not detected in a control without water, we propose that (1) O3(g) dissolves in the droplet containing ions in the early stage of aerosolization, (2) droplet evaporation occurs accompanied by fission in smaller droplets, and (3) finally the production of O3•− takes place from the latest progeny droplets that are the direct precursor to form the ions that reach the detector. Solvent and gas molecules are pumped away in the intermediate vacuum stage between the ESI probe and analyzer. Charge transfer to O3(aq) occurs in the last step of ion formation, and a posteriori of the observed reactions. Therefore, the detected O3•− does not play a role as a reagent in our system, and the reactions observed are from the direct interaction of I− with molecular O3. Otherwise, different chemistry would have resulted from O3•− that quickly generates
EXPERIMENTAL SECTION Solutions of sodium salts (NaI and NaBr) were prepared daily in ultrapure water (18.2 MΩ-cm), methanol, or acetonitrile, and infused into a calibrated ESI-MS (Thermo Scientific, MSQ Plus). Polysorbate 20 was used as a nonionic surfactant. Figures report the normalized ion count for experiments at pH 6.2, unless otherwise indicated, which agree with the observations at pH 6.8 and 8.1. The pH of solutions was adjusted with 0.01 M NaOH and measured with a calibrated pH-meter (Mettler Toledo). All species are in the aqueous state, that is, I−(aq) I−, unless indicated otherwise. In our ESI system (Scheme 1), described in more detail before18 and in the Supporting Information, a solution of electrolytes undergoes pneumatically assisted aerosolization to be converted into fine micrometer size droplets at atmosphericpressure. The microdroplets encounter a flow of O3(g) (0.2 L Scheme 1. Reactor Diagram
10972
dx.doi.org/10.1021/es401700h | Environ. Sci. Technol. 2013, 47, 10971−10979
Environmental Science & Technology
Article
Figure 1. Spectra of ESI-MS of 50 μM solution of NaI at pH = 6.2 exposed to a 0.200 L min−1 flow (A) 1 atm N2(g), (B) 50 ppbv, (C) 130 ppbv, (D) 492 ppbv, and (E) 1.393 ppmv O3(g). Ion count values are normalized relative to the most intense peak in the mass spectrum.
Figure 2. Semilogarithmic plots of normalized ion count for (pink ▲) I−, (teal star) I2, (open circle) IO−, (blue square) H2O·IO−, (red ×) I3−, (green open diamond) IO2−, and (gray inverted triangle) IO3− in the ESI mass spectra as a function of increasing [NaI] at pH = 6.2. Aerosolized solutions are exposed to (A) 130 ppbv, (B) 492 ppbv, and (C) 1.393 ppmv O3(g).
HO• in water, which could neither predict the abundance of I3− observed nor the formation of IO3−.42 Figure 2 shows how the ion count of I−, I2, IO−, H2O·IO−, − I3 , IO2−, and IO3− exponentially rise to a maximum for increasing initial [I−] at constant [O3(g)]. Note that although I2 is the largest peak at 130 ppbv O3(g) (Figure 2A), this observation cannot be interpreted as a higher [I2] than [I−]0. Simple stoichiometry shows that for a ∼20% loss of [I−]0 = 100 μM, a theoretical maximum of 10 μM I2 could be produced. Indeed, the production of other iodine species establishes a lower yield for the production of I2. We interpret the large ion count of I2 as being correlated to the high tendency of this species to partition into the gas phase and form ions.43 Furthermore, the chemical species are enriched or depleted at the air−water interface depending not only on their relative concentrations but also on size.18 Under low O3 (g) conditions, I2 reacts farther to generate I3− (reaction 6). An increase to 492 ppbv O3(g) (Figure 2B) produces a dominant IO− peak and its hydrate, capable of evolving to the gas phase as HIO given its high pKa. HIO and its hydrate are also unstable and undergo farther processing through two channels for the production of (1) I3− and (2) IO3−. The mechanism is shifted to produce the IO2− intermediate conducting to IO3− final product at 1.393 ppmv O3(g) (Figure 2C). While at 50 and 130 ppbv, I3− is a final reaction product, the mechanism must shift somehow at
1.393 ppm because this species appears to be less abundant than IO3−. The results in Figures 1 and 2 are summarized in Scheme 2. The experiments at variable O3(g) concentration may proceed Scheme 2. Reactions of Iodide in Aqueous Microdroplets Exposed to O3(g)
at the interface by the exothermic reaction: I− + O3 → IOOO− → IO− + O2.23 The progression of the data in Figures 1 and 2, and the dependence with ozone partial pressure, PO3, indicate that the detection of the unstable intermediate IOOO− seems unlikely in these experiments. However, if the intermediate is present even at very low concentration, its mass spectrum 10973
dx.doi.org/10.1021/es401700h | Environ. Sci. Technol. 2013, 47, 10971−10979
Environmental Science & Technology
Article
Table 1. Chemical Reactions and Kinetic and Equilibrium Constants in Water at Room Temperaturea
a
reaction number
reaction
rate or equilibrium constant
ref
R1 R2 R3 R4 R5 R6 R7 R8
I− + O3 + H+ →HIO + O2 HIO + O3 → IO2− + O2 + H+ IO2− + O3 → IO3− + O2 HIO + 2 O3 → IO3− + 2 O2 + H+ HIO + I− + H+ → I2 + H2O I2 + I− ⇌ I3− I2 ⇌ I2(g) HIO ⇌ HIO(g)
k1 = 2.4 × 10⁹ M−1 s−1 b b k4 = 3.6 × 10⁴ M−1 s−1 k5 = 4.4 × 10¹² M−2 s−1 K6 = 721 M−1, k6 = 6.2 × 10⁹ M−1 s−1, k−6 = 8.5 × 10⁶ s−1 K7 = 0.33 atm M−1 K8 = 5.34 × 10⁻³ atm M−1
46
38 39 41 43 45
All species are aqueous or liquids unless otherwise indicated. bUnkown.
would overlap the major isomeric IO3− product at m/z = 175, making it undistinguishable for this technique. For relevant pH values in sea spray aerosols and surface ocean waters (pH + 2 < pKa,HIO = 10.4),44 the fully undissociated hypoiodous acid, HIO, is practically the only species in the acid−base equilibrium, and therefore the precursor of I3− and IO3−. Thus, the reaction rate equations for the consumption of the conjugate base IO− with O3(g) and I− can be neglected. In more detail, at low ozone concentrations (Figures 1B, C and 2A), the iodide solution is converted to I3− through reactions 1, 5, and 6 (see Table 1) during aerosolization. From the viewpoint of an environmentally relevant process, reaction 1 plays a major role to feed the transfer of RHS to the gasphase, as recently demonstrated by Carpenter et al., who reported a large emission ratio HIO(g)/I2(g) ≈ 10, using a model with a reacto-diffusive length of ∼1 μm undergoing processing during hours,24 which should not be compared to the experimental δ and τ used herein. Alternatively, the fate of iodide can be the production of iodate (IO3−) (Figure 1E) at higher ozone levels. For high PO3, HIO undergoes oxidation to IO3− in a sequential process described by reactions 2 and 3 (Table 1). Because HIO is produced at the interface, its tendency to escape to the gas-phase should be higher than predicted45 for typical bulk processes. The IO3− production pathway, with unknown reaction rate constants, is summarized by overall reaction 4 (Scheme 2). Although the rate constant for the oxidation of IO2−, reaction 3, is unknown, it should proceed faster than the preceding reaction 2, and therefore is not the rate limiting step. Ozone Concentration Effect. Figure 3A shows the linear dependence for the branching ratio [IO3−]/[I3−] when 100 μM I− reacts with increasing [O3(g)], in agreement with the mechanism in Scheme 2. The branching ratio is directly derived from the data in panels C and D of Figure 3. The loss of [I−] in microdroplets appears to reach steady state conditions for [O3(g)], 1.64 ppmv (Figure 3B). The reactions of I− and its follow-up products occur so quickly that other reactions of I−, such as with HO• radicals, can be disregarded.42 Figure 3 also shows that above 3.28 and 1.20 ppmv O3(g) the respective HIO and I2 species reach a stationary state production in our continuous flow reactor. Remarkably, the high abundance of the intermediate HIO for all [O3(g)] range above 130 ppbv, which has the largest ion count relative to the other species, reaches a maximum at 1.47 ppmv, while it is further oxidized in the microdroplets or transferred to the gasphase. However, the higher counts for the peak at m/z = 254 (Figure 3E) than for m/z = 143 (panel F) below 130 ppbv O3(g) suggests that I2 should be considered in models that describe the chemistry over surface ocean waters. At low ozone concentration, I2 reaches a maximum, when the production of
Figure 3. (A) Ratio of production of ions IO3− and I3−, I175/I381, as a function of [O3(g)] for [I−]0 = 100 μM at pH = 6.2. The data is fitted with a linear regression curve through the origin. Ion count, Im/z, for the loss of (B) I−, and production of (C) IO3−, (D) I3−, (E) I2, and (F) IO− with increasing [O3(g)].
HIO is growing from its minimum, but decays exponentially at high [O3(g)]. The production of IO3− and I3− (Table 1, reactions 4 and 6) in thin slabs occurs simultaneously with the fast replenishment of I− loss from a contiguous internal layer, resulting in product yields that exceed unity at the interface even at room temperature. This surprising result agrees with the observations made by Enami and co-workers at very high temperature (T ≥ 340 °C) in a different instrumental setup.35,36 Thus, the experiments support the proposal that classical bulk solution models cannot be applied to explain the kinetics and mechanisms of reactions at the interface of microdroplets and sea spray aerosols.22 Therefore, these observations need to be taken into account in future models that describe ozone loss mediated by iodine species emitted from sea spray aerosol. Diffusion of I− through an ultrathin interface (Supporting Information) occurs from the core of the droplet while reactions occur in a contact time τ ≈ 1 μs, on a nanoscopic interface of thickness δ ≈ 1 nm (Supporting Information).48 The value of δ used agrees with related ESI-MS studies and 10974
dx.doi.org/10.1021/es401700h | Environ. Sci. Technol. 2013, 47, 10971−10979
Environmental Science & Technology
Article
second harmonic generation measurements.29,48,49 A rigorous mathematical solution to the system requires working with differential equations describing the reaction kinetics, including diffusion through a sharp boundary.50 However, classical methods for fixed volume batch reactors may not be valid to model present experiments with microdroplets,51 where the transport of species by diffusion is neither occurring over lengths that are much larger than the mean free paths, nor homogeneous.18 The fact that Figure 3B levels off indicates the lack of diffusion controlled limitations. Because I− diffuses in a few nanoseconds through the δ = 1 nm layer, a stationary state (d[I−]/dt = 0) is quickly established during our measurements. Assuming that the final products IO3− and I3− are generated at faster rates than the previous intermediates IO2− and I2, k2 ≪ k3 and k5 ≪ k6, Scheme 2 predicts the linearity observed in Figure 3A between the ion count for both final products and [O3]. Remarkably, because of the contribution of intradroplet diffusion to the detected interfacial [I−], the outer layer of the droplet behaves as an open reactor, in agreement with other studies.35,52 Therefore, present observations of products with high yields, exceeding unity values from bulk reagent concentration, occur because iodide is continuously replenished after interacting with O3(g). Effect of Solvent: Solutions in Acetonitrile and Methanol. Solutions of NaI prepared in pure acetonitrile or methanol were aerosolized to compare any solvent dependent changes in the reaction mechanism in water. The experiments provide a better understanding of the interfacial reactivity of I− with O3(g). The unique properties of each solvent represent possible differences existing in the surface coverage of marine aerosols. Sum-frequency generation vibrational spectroscopy measurements showed that the outer layer of the methanol-air interface is covered by methyl groups instead of the −OH found in water.53 The methanol−air interface has the polar −OH group pointing into the core of the droplets. In contrast, the configuration of acetonitrile in the liquid−air interface is composed of single-disordered molecules with a significant tendency to form antiparallel dipole pairs.54 All anions present during the reaction are oriented to minimize the distortion of both interfaces.18 No evaluation of the species generated during the ozonolysis of iodide in methanol was reported for the branching ratio [IO3−]/[I3−].28 Therefore, the objective of Supporting Information Figures S1−S3 is to display the identity of the reaction products in acetonitrile and methanol versus water for three different [O3(g)]. For example, the key peak at m/z = 143 for hypoiodite is reported here for the first time in water, methanol, and acetonitrile. The fact that O3(g) reacts with I− in acetonitrile and methanol to form the same products observed in water suggests a common oxidation mechanism. When a NaI solution in acetonitrile reacts with 2.459 ppmv O3(g), the relative ion count for the production of IO−, IO2−, and IO3− drops 25, 14, and 29 times, respectively, relative to water (Figures S1 and S2 in Supporting Information). Therefore, the anion IO− can undergo direct oxidation even under aprotic conditions. Furthermore, for 2.459 ppmv O3(g) reacting with I− in methanol, the three oxyanions are 111, 85, and 220 times less abundant than in water (Figures S1 and S3 in Supporting Information). Remarkably, the production of H2O·IO− (m/z = 161) and the intermediate HI2O− (m/z = 271) in methanol and acetonitrile is not observed in the time scale of our
measurements. Therefore, we propose that hydrated hypoiodous acid is a key intermediate for the production of iodine oxyanions, while naked HIO is a main precursor of I2 and I3−. The different relative abundances for oxyanion products registered in organic solvents also suggests a shorter droplet lifetime together with a more favorable liquid-to-gas transfer for species that do not contain oxygen atoms (Figures S1−S3). The gradual volatility increase accompanying the simultaneous decrease in boiling temperatures Tb,water > Tb,acetonitrile > Tb,methanol (100 > 82 > 65 °C) and surface tension γwater > γacetonitrile > γmethanol (72 > 29 > 22 dyn cm−1),55 results in a shorter contact time between O3, I−, and their products in the droplets.56 Possibly, the shorter lifetime of the organic droplets favors the reaction of first generation oxidation product HIO with nearby and more abundant I− to generate I2 and later enhance the intradroplet concentration of I3−. The unfavorable channel of IO3− production presumably requires a longer contact time for the reaction with O3 or the presence of H2O· IO−. Enhanced Dissolution of Ozone by Electrolytes. The dissolution of O3(g) in microdroplets for increasing [NaI] and [NaBr] is quantified from the single ion monitoring (SIM) MS at m/z = 48, background subtracted from the ion count registered in pure water, and finally converted to aqueous solubility by Henry’s law (Figure S4, Supporting Information). The Henry’s law constant H0 = 0.011 M atm−1,47 the vapor pressure of waterPH2O = 0.0312 atm55 at 298 K, and PO3 = 2.459 ppmv are used in the conversion. The Henry’s law constant H remains practically equal to its value in pure water H0 in the presence of dilute electrolytes. Supporting Information Figure S4 also represents the percentage increase of O3 dissolution by aqueous microdroplets containing electrolytes. Since the Sechenov equation57,58 at constant temperature and pH fails to explain the behavior of O3 observed in Supporting Information Figure S4, a modified eq 1 is introduced for simple dilute electrolytes ([NaX] → 0). Equation 1 predicts the solubility increment of the gas in short-lived micrometer size water droplets: [O3] = [O3]0 + [O3]100 μM (1 − exp−(KG[NaX]))
(1)
where [O3]100 μM indicates the amplitude in Supporting Information Figure S4, KG is a constant, and [O3]0 is the offset from zero. Indeed, the experimental results reflect the uptake of O3 at the air−water interface in τ = 1 μs. The best fitting parameters describing Supporting Information Figure S4 with eq 1 for each halide are [O3]Br− = 2.78 × 10⁻² + 6.16 × −2 10−1 (1 − exp−5.43×10 [NaBr]) and [O3]I− = 2.76 × 10⁻² + 5.27 × −2
10−1 (1 − exp−3.85×10 [Nal]), both with coefficient of correlation r2 ≥ 0.990. Present measurements represent a steady state (d[O3]/dt =0) at the interface because no accumulation occurs over time. The mass transfer of gaseous ozone below 1 μM sodium halide is practically constant for both species, and suddenly increases above this concentration indicated by a perpendicular dashed line in Supporting Information Figure S4. Therefore, the mass transfer of O3(g) into the aqueous phase is the most important phenomena affecting the experiment in Supporting Information Figure S4, followed by the reactivity of O3 with I−, because other individual halides remain inert. A simple comparison of the amplitude in Supporting Information Figure S4 shows that [O3]100μM in I− is only a 14% lower than in Br−. 10975
dx.doi.org/10.1021/es401700h | Environ. Sci. Technol. 2013, 47, 10971−10979
Environmental Science & Technology
Article
The measured [O3] depends on time, the liquid film mass transfer coefficient, and the interfacial area of the microdroplets.59 The rate of autodecomposition of ozone in the interfacial layer can be neglected in the ultrafast contact time of our measurements. Therefore, the observable [O3] cannot be related to the solubility concentration in a bulk solution that is typically less than the equilibrium concentration due to autodecomposition. Instead, the enhanced change in [O3], expressed as a percentage, represents the actual solubility concentration in the interfacial region where mass transfer takes place. In other words, since the MS monitors the process occurring on the outer layers of the microdroplets,18 the interfacial concentration [O3]interface is assumed equal to the equilibrium concentration [O3]. The uptake of ozone by water implies several steps related to properties of the interface, gas- and condensed-phases. The uptake process starts with the diffusion of O3(g) molecules toward the water interface, followed by the mass transfer across the interface (accommodation process), diffusion and reaction with iodide in the condensed phase, and desorption of the gasphase reaction products. The surface density of ozone molecules in the interface, SO3 (molecules cm−2), can be estimated from the concentration of dissolved ozone [O3] (molecules cm−3) in the thin slab of thickness δ = 1 × 10⁻⁷ cm from the equation SO3 = δ[O3] = υO3τγw[O3(g )]/4
Figure 4. Ratios of normalized ion count in the presence and absence of surfactant for [I−]0 = 50 μM at pH = 6.2 and 2.705 ppmv O3(g), at variable concentration of polysorbate 20: (pink triangle) I−, (open circle) IO−, (red ×) I3−, (green open triangle) IO2−, and (gray inverted triangle) IO3−. The red dashed vertical line indicates the critical micelle concentration,62 and the blue dashed horizontal line represents no change in the presence of surfactant relative to pure water microdroplets.
different behavior may occur in the presence of reactive organic species that can compete with I− to react with O3(g), such as amphiphilic fulvic acids that can transfer H+interface through weak carboxylic acids moieties, and enhance the emission of I2(g) from submicrometer particles.12,13 Significant changes occur above the CMC (vertical red dashed line in Figure 4). For [polysorbate 20] = 10−4 M, there is an abrupt interfacial depletion of I− < I3− < IO2−, and a minor enrichment in the production of IO3− in the reactive surface layers. In the presence of 1 mM surfactant, I3−, I−, and IO3− become approximately 50, 20, and 7% more enriched than in water. At high surfactant loading, the ions compete for the surface sites based on their relative concentration in a process strongly influenced by their size, polarizability, and geometry.18 The surfactant produces a salting out or salting in of the ions relative to the hydrophobic groups of polysorbate 20.61 At 1 mM, the hydrophobic groups of the surfactant are not in contact with the aqueous phase in the micellar form, favoring the salting out of the largest I3− ion. The strong salt out of even low amounts of I3− reflects its ability to highly alter interfacial water structure.61 However, the presence of surfactant does not prevent the loss of ozone and the production of I2 and HIO. Atmospheric Implications. The mechanism investigated here indicates that inorganic processes in sea salt spray could also be an important source of halogens, particularly gaseous I2 and HOI, in the MBL. Both photoactive species HIO and I2 produce iodine atoms in the gas-phase, capable of forming the iodine monoxide radical (IO•), and regenerate I• by different pathways of ozone loss.63 This was pointed out using processes at the air−sea interface as a source,24 and here we expand the potential sources to sea spray. This process occurs throughout the ocean, and thus impacts the global tropospheric ozone budget. The interaction of O3(g) with nano- and micromolar solutions of I− in the presence of Cl−, Br−, and surfactants generate reactive iodine species even at nighttime.64 In sea spray at low [I−], considerable [HIO] can be produced in situ in interfacial reactions that facilitate its transfer to the gas-phase. One-dimensional models of the MBL24 have been used to estimate the source from the sea for a given set of average
(2)
where υO3 = 3.94 cm s−1 is the mean thermal velocity of gaseous ozone at 298 K, [O3(g)] is the concentration of ozone molecules striking the liquid microdroplets with a contact time τ = 1 × 10⁻⁶ s, and γw is the uptake coefficient of ozone in water. Considering the uptake in Supporting Information Figure S4, for dilute 100 μM NaBr aerosolized solution for microdroplets exposed to PO3 = 2.459 ppmv yields γw = 4.45 × 10⁻⁷, a low limit that is comparable to the value obtained at interfaces for bromide56 or anthracene.60 Effect of Surfactant. Many organic compounds present in surface ocean water are surfactant agents also emitted to the atmosphere as part of sea spray aerosol. Therefore, it is important to explore the effect of surfactants on the oxidation of iodide. Figure 4 shows that the nonionic surfactant polysorbate 20 has a minor effect during the ozonolysis of iodide below [polysorbate 20] = 10−5 mol L−1. The addition of the surfactant below the critical micelle concentration (CMC)61 to the NaI solution exposed to 2.705 ppmv O3(g) decreases the total ion count and alters the interface. The surfactant forms micelles at the CMC,61 8.0 × 10⁻⁵ M of polysorbate 20.62 For low surfactant concentration the normalized ion count in the presence of surfactant, are close to their values in water as indicated by the proximity of the experimental points to the horizontal dashed line. The highest ion count corresponds always to HIO for the whole [polysorbate 20] interval. At this [O3(g)], the ion IO− covers the majority of the interfacial layer for surfactant and surfactantfree solutions. The results for low [polysorbate 20] indicate the fast bulk accommodation of O3(g)9 is still the controlling factor for reaction 1. Under these conditions, polysorbate 20 behaves as a nonreactive amphiphile,10 with a behavior similar to a short chained permeable surfactant such as undissociated nonanoic acid (C9),10 which minimally affects the uptake coefficient of O3 (γw = 1.1 × 10⁻² for deliquesced KI particles).10 However, a 10976
dx.doi.org/10.1021/es401700h | Environ. Sci. Technol. 2013, 47, 10971−10979
Environmental Science & Technology
Article
(4) Read, K. A.; Mahajan, A. S.; Carpenter, L. J.; Evans, M. J.; Faria, B. V. E.; Heard, D. E.; Hopkins, J. R.; Lee, J. D.; Moller, S. J.; Lewis, A. C.; Mendes, L.; McQuaid, J. B.; Oetjen, H.; Saiz-Lopez, A.; Pilling, M. J.; Plane, J. M. C. Extensive halogen-mediated ozone destruction over the tropical Atlantic Ocean. Nature 2008, 453 (7199), 1232−1235. (5) Barrie, L. A.; Bottenheim, J. W.; Schnell, R. C.; Crutzen, P. J.; Rasmussen, R. A. Ozone destruction and photochemical reactions at polar sunrise in the lower Arctic atmosphere. Nature 1988, 334 (6178), 138−141. (6) Carpenter, L. J.; Hopkins, J. R.; Jones, C. E.; Lewis, A. C.; Parthipan, R.; Wevill, D. J.; Poissant, L.; Pilote, M.; Constant, P. Abiotic source of reactive organic halogens in the sub-Arctic atmosphere? Environ. Sci. Technol. 2005, 39 (22), 8812−8816. (7) Wren, S. N.; Donaldson, D. J. Glancing-angle Raman spectroscopic probe for reaction kinetics at water surfaces. Phys. Chem. Chem. Phys. 2010, 12 (11), 2648−2654. (8) Reeser, D. I.; Donaldson, D. J. Influence of water surface properties on the heterogeneous reaction between O3(g) and I(aq)−. Atmos. Environ. 2011, 45 (34), 6116−6120. (9) Rouvière, A. l.; Sosedova, Y.; Ammann, M. Uptake of ozone to deliquesced KI and mixed KI/NaCl aerosol particles. J. Phys. Chem. A 2010, 114 (26), 7085−7093. (10) Rouvière, A.; Ammann, M. The effect of fatty acid surfactants on the uptake of ozone to aqueous halogenide particles. Atmos. Chem. Phys. 2010, 10 (23), 11489−11500. (11) Hayase, S.; Yabushita, A.; Kawasaki, M.; Enami, S.; Hoffmann, M. R.; Colussi, A. n. J. Heterogeneous reaction of gaseous ozone with aqueous iodide in the presence of aqueous organic species. J. Phys. Chem. A 2010, 114 (19), 6016−6021. (12) Hayase, S.; Yabushita, A.; Kawasaki, M.; Enami, S.; Hoffmann, M. R.; Colussi, A. n. J. Weak acids enhance halogen activation on atmospheric water’s surfaces. J. Phys. Chem. A 2011, 115 (19), 4935− 4940. (13) Hayase, S.; Yabushita, A.; Kawasaki, M. Iodine emission in the presence of humic substances at the water’s surface. J. Phys. Chem. A 2012, 116 (24), 5779−5783. (14) Simpson, W. R.; von Glasow, R.; Riedel, K.; Anderson, P.; Ariya, P.; Bottenheim, J.; Burrows, J.; Carpenter, L. J.; Frieß, U.; Goodsite, M. E.; Heard, D.; Hutterli, M.; Jacobi, H. W.; Kaleschke, L.; Neff, B.; Plane, J.; Platt, U.; Richter, A.; Roscoe, H.; Sander, R.; Shepson, P.; Sodeau, J.; Steffen, A.; Wagner, T.; Wolff, E. Halogens and their role in polar boundary-layer ozone depletion. Atmos. Chem. Phys. 2007, 7 (16), 4375−4418. (15) Huang, R. J.; Seitz, K.; Buxmann, J.; Pöhler, D.; Hornsby, K. E.; Carpenter, L. J.; Platt, U.; Hoffmann, T. In situ measurements of molecular iodine in the marine boundary layer: the link to macroalgae and the implications for O3, IO, OIO and NOx. Atmos. Chem. Phys. 2010, 10 (10), 4823−4833. (16) Huang, R. J.; Thorenz, U. R.; Kundel, M.; Venables, D. S.; Ceburnis, D.; Ho, K. F.; Chen, J.; Vogel, A. L.; Küpper, F. C.; Smyth, P. P. A.; Nitschke, U.; Stengel, D. B.; Berresheim, H.; O’Dowd, C. D.; Hoffmann, T. The seaweeds Fucus vesiculosus and Ascophyllum nodosum are significant contributors to coastal iodine emissions. Atmos. Chem. Phys. 2013, 13 (10), 5255−5264. (17) von Glasow, R. Atmospheric chemistry: Sun, sea and ozone destruction. Nature 2008, 453 (7199), 1195−1196. (18) Guzman, M. I.; Athalye, R. R.; Rodriguez, J. M. Concentration effects and ion properties controlling the fractionation of halides during aerosol formation. J. Phys. Chem. A 2012, 116 (22), 5428− 5435. (19) Garland, J. A.; Curtis, H. Emission of iodine from the sea surface in the presence of ozone. J. Geophys. Res.-Oceans 1981, 86 (C4), 3183−3186. (20) Saunders, R. W.; Kumar, R.; MacDonald, S. M.; Plane, J. M. C. Insights into the photochemical transformation of iodine in aqueous systems: Humic acid photosensitized reduction of iodate. Environ. Sci. Technol. 2012, 46 (21), 11854−11861. (21) Liao, J.; Sihler, H.; Huey, L. G.; Neuman, J. A.; Tanner, D. J.; Friess, U.; Platt, U.; Flocke, F. M.; Orlando, J. J.; Shepson, P. B.; Beine,
conditions. However, the actual source will vary geographically. Production of sea spray will be very sensitive to local conditions, particularly surface winds. The production of iodine (Scheme 2) will depend on temperature, humidity, pH, the concentration of halogen species in the liquid phase, and droplet size. Finally, the balance between transport of ozone from the continents to the ocean, and its loss in the MBL is best simulated by global three-dimensional models which include complete gas phase chemistry and long-range transport. Future modeling efforts should apply first a chemistrydiffusion-evaporation model of the droplet to derive pseudo first order rates for the “net” source processes described in reactions 1 and 5 (Scheme 2 and Table 1). Reaction 1 constitutes a direct loss of ozone on the gas-phase surface, in addition to contributing to iodine production, which also leads to ozone destruction. Scheme 2 also suggests another heterogeneous loss of O3 through (net) reaction 4 (Table 1). We expect that all the above parametrizations will include a dependence on temperature, humidity, pH and possibly droplet size, resulting from such dependencies of the relevant Henry’s law constant, evaporation rates, and aqueous reactions. Such parametrizations exist for some of the chlorine and bromine reactions37 that take place in polar stratospheric clouds and which contribute to the formation of the ozone hole.
■
ASSOCIATED CONTENT
* Supporting Information S
Detailed experimental section, additional results and discussion, and Figures S1−S4. This information is available free of charge via the Internet at http://pubs.acs.org.
■
AUTHOR INFORMATION
Corresponding Author
*E-mail:
[email protected]. Notes
The authors declare no competing financial interest.
■ ■
ACKNOWLEDGMENTS We thank research funding from NASA (NNX10AV39A) and NSF CAREER award (CHE-1255290). REFERENCES
(1) Forster, P.; Ramaswamy, V.; Artaxo, P.; Berntsen, T.; Betts, R.; Fahey, D. W.; Haywood, J.; Lean, J.; Lowe, D. C.; Myhre, G.; Nganga, J.; Prinn, R.; Raga, G.; Schulz, M.; Van Dorland, R. Changes in atmospheric constituents and in radiative forcing. In Climate Change 2007: The Physical Science Basis. Contribution of Working Group I to the Fourth Assessment Report of the Intergovernmental Panel on Climate Change; Solomon, S., Qin, D., Manning, M., Chen, Z., Marquis, M., Averyt, K. B., Tignor, M., Miller, H. L., Eds.; Cambridge University Press: Cambridge, United Kingdom, 2007. (2) Denman, K. L.; Brasseur, G.; Chidthaisong, A.; Ciais, P.; Cox, P. M.; Dickinson, R. E.; Hauglustaine, D.; Heinze, C.; Holland, E.; Jacob, D.; Lohmann, U.; Ramachandran, S.; da Silva Dias, P. L.; Wofsy, S. C.; Zhang, X. Couplings between changes in the climate system and biogeochemistry. In Climate Change 2007: The Physical Science Basis. Contribution of Working Group I to the Fourth Assessment Report of the Intergovernmental Panel on Climate Change; Solomon, S., Qin, D., Manning, M., Chen, Z., Marquis, M., Averyt, K. B., Tignor, M., Miller, H. L., Eds.; Cambridge University Press: Cambridge, United Kingdom, 2007. (3) Murphy, D. M.; Fahey, D. W. An estimate of the flux of stratospheric reactive nitrogen and ozone into the troposphere. J. Geophys. Res.: Atmos. 1994, 99 (D3), 5325−5332. 10977
dx.doi.org/10.1021/es401700h | Environ. Sci. Technol. 2013, 47, 10971−10979
Environmental Science & Technology
Article
H. J.; Weinheimer, A. J.; Sjostedt, S. J.; Nowak, J. B.; Knapp, D. J.; Staebler, R. M.; Zheng, W.; Sander, R.; Hall, S. R.; Ullmann, K. A comparison of Arctic BrO measurements by chemical ionization mass spectrometry and long path-differential optical absorption spectroscopy. J. Geophys. Res.: Atmos. 2011, 116, No. D00R02. (22) Hunt, S. W.; Roeselová, M.; Wang, W.; Wingen, L. M.; Knipping, E. M.; Tobias, D. J.; Dabdub, D.; Finlayson-Pitts, B. J. Formation of molecular bromine from the reaction of ozone with deliquesced NaBr aerosol: Evidence for interface chemistry. J. Phys. Chem. A 2004, 108 (52), 11559−11572. (23) Sakamoto, Y.; Yabushita, A.; Kawasaki, M.; Enami, S. Direct emission of I2 molecule and IO radical from the heterogeneous reactions of gaseous ozone with aqueous potassium iodide solution. J. Phys. Chem. A 2009, 113 (27), 7707−7713. (24) Carpenter, L. J.; MacDonald, S. M.; Shaw, M. D.; Kumar, R.; Saunders, R. W.; Parthipan, R.; Wilson, J.; Plane, J. M. C. Atmospheric iodine levels influenced by sea surface emissions of inorganic iodine. Nat. Geosci. 2013, 6 (2), 108−11. (25) Reiter, R. Charges on particles of different size from bubbles of mediterranea-sea surf and from waterfalls. J. Geophys. Res.: Atmos. 1994, 99 (D5), 10807−10812. (26) Bhattacharyya, I.; Maze, J. T.; Ewing, G. E.; Jarrold, M. F. Charge separation from the bursting of bubbles on water. J. Phys. Chem. A 2011, 115 (23), 5723−5728. (27) Blanchard, D. C. Electrically charged drops from bubbles in sea water and their meteorological significance. J. Meteorol. 1958, 15 (4), 383−396. (28) Cheng, J.; Hoffmann, M. R.; Colussi, A. J. Anion fractionation and reactivity at air/water:methanol interfaces. Implications for the origin of Hofmeister effects. J. Phys. Chem. B 2008, 112 (24), 7157− 7161. (29) Cheng, J.; Vecitis, C. D.; Hoffmann, M. R.; Colussi, A. J. Experimental anion affinities for the air/water interface. J. Phys. Chem. B 2006, 110 (51), 25598−25602. (30) Platt, U.; Honninger, G. The role of halogen species in the troposphere. Chemosphere 2003, 52 (2), 325−338. (31) O’Dowd, C. D.; Jimenez, J. L.; Bahreini, R.; Flagan, R. C.; Seinfeld, J. H.; Hameri, K.; Pirjola, L.; Kulmala, M.; Jennings, S. G.; Hoffmann, T. Marine aerosol formation from biogenic iodine emissions. Nature 2002, 417 (6889), 632−636. (32) Thomas, J. L.; Jimenez-Aranda, A.; Finlayson-Pitts, B. J.; Dabdub, D. Gas-phase molecular halogen formation from NaCl and NaBr aerosols: When are interface reactions important? J. Phys. Chem. A 2006, 110 (5), 1859−1867. (33) McMurdo, C. J.; Ellis, D. A.; Webster, E.; Butler, J.; Christensen, R. D.; Reid, L. K. Aerosol enrichment of the surfactant PFO and mediation of the water−air transport of gaseous PFOA. Environ. Sci. Technol. 2008, 42 (11), 3969−3974. (34) Finlayson-Pitts, B. J. Halogens in the troposphere. Anal. Chem. 2009, 82 (3), 770−776. (35) Enami, S.; Vecitis, C. D.; Cheng, J.; Hoffmann, M. R.; Colussi, A. J. Global inorganic source of atmospheric bromine. J. Phys. Chem. A 2007, 111 (36), 8749−8752. (36) Enami, S.; Vecitis, C. D.; Cheng, J.; Hoffmann, M. R.; Colussi, A. J. Mass spectrometry of interfacial layers during fast aqueous aerosol/ozone gas reactions of atmospheric interest. Chem. Phys. Lett. 2008, 455 (4−6), 316−320. (37) Sander, S. P.; Abbatt, J.; Barker, J. R.; Burkholder, J. B.; Friedl, R. R.; Golden, D. M.; Huie, R. E.; Kolb, C. E.; Kurylo, M. J.; Moortgat, G. K.; Orkin, V. L.; Wine, P. H. Chemical Kinetics and Photochemical Data for Use in Atmospheric Studies: Evaluation Number 17. Jet Propulsion Laboratory, California Institute of Technology: Pasadena, CA, 2011; http://jpldataeval.jpl.nasa.gov. (38) Bichsel, Y.; von Gunten, U. Oxidation of iodide and hypoiodous acid in the disinfection of natural waters. Environ. Sci. Technol. 1999, 33 (22), 4040−4045. (39) Eigen, M.; Kustin, K. The kinetics of halogen hydrolysis. J. Am. Chem. Soc. 1962, 84 (8), 1355−1361.
(40) Hao, C.; March, R. E.; Croley, T. R.; Smith, J. C.; Rafferty, S. P. Electrospray ionization tandem mass spectrometric study of salt cluster ions. Part 1: Investigations of alkali metal chloride and sodium salt cluster ions. J. Mass. Spec. 2001, 36 (1), 79−96. (41) Troy, R. C.; Kelley, M. D.; Nagy, J. C.; Margerum, D. W. Nonmetal redox kinetics: iodine monobromide reaction with iodide ion and the hydrolysis of IBr. Inorg. Chem. 1991, 30 (25), 4838−4845. (42) Von Sonntag, C.; Von Gunten, U. Chemistry of Ozone in Water and Wastewater Treatment: From Basic Principles to Applications; IWA Publishing: London, 2012; p 302. (43) Palmer, D. A.; Ramette, R. W.; Mesmer, R. E. The hydrolysis of iodine: Equilibria at high temperatures. J. Nucl. Mater. 1985, 130 (0), 280−286. (44) Bichsel, Y.; von Gunten, U. Hypoiodous acid: Kinetics of the buffer-catalyzed disproportionation. Water Res. 2000, 34 (12), 3197− 3203. (45) Lin, C.-C. Volatility of iodine in dilute aqueous solutions. J. Inorg. Nucl. Chem. 1981, 43 (12), 3229−3238. (46) Magi, L.; Schweitzer, F.; Pallares, C.; Cherif, S.; Mirabel, P.; George, C. Investigation of the uptake rate of ozone and methyl hydroperoxide by water surfaces. J. Phys. Chem. A 1997, 101 (27), 4943−4949. (47) Standard Reference Database 69. The NIST Chemistry WebBook; Mallard, W. G., Linstrom, P. J., Eds.; National Institute of Standards and Technology: Gaithersburg, MD, 2000; http://webbook.nist.gov, Vol. 2012. (48) Enami, S.; Hoffmann, M. R.; Colussi, A. J. Proton availability at the air/water interface. J. Phys. Chem. Lett. 2010, 1 (10), 1599−1604. (49) Petersen, P. B.; Saykally, R. J. Probing the interfacial structure of aqueous electrolytes with femtosecond second harmonic generation spectroscopy. J. Phys. Chem. B 2006, 110 (29), 14060−14073. (50) van Elk, E. P. Gas−liquid reactionsInfluence of bulk and mass transfer on process performance. Ph.D. Thesis, University of Twente, Enschede, 2001. (51) Benson, S. W. The Foundations of Chemical Kinetics; McGrawHill: New York, 1960; p 736. (52) Enami, S.; Vecitis, C. D.; Cheng, J.; Hoffmann, M. R.; Colussi, A. J. Electrospray mass spectrometric detection of products and shortlived intermediates in aqueous aerosol microdroplets exposed to a reactive gas. J. Phys. Chem. A 2007, 111 (50), 13032−13037. (53) Liu, W.-T.; Zhang, L.; Shen, Y. R. Interfacial structures of methanol:water mixtures at a hydrophobic interface probed by sumfrequency vibrational spectroscopy. J. Chem. Phys. 2006, 125 (14), 144711−6. (54) Ding, F.; Hu, Z.; Zhong, Q.; Manfred, K.; Gattass, R. R.; Brindza, M. R.; Fourkas, J. T.; Walker, R. A.; Weeks, J. D. Interfacial organization of acetonitrile: Simulation and experiment. J. Phys. Chem. C 2010, 114 (41), 17651−17659. (55) CRC Handbook of Chemistry and Physics, 93rd ed.; CRC Press/ Taylor and Francis: Boca Raton, FL, 2013; p 2664. (56) Oldridge, N. W.; Abbatt, J. P. D. Formation of gas-phase bromine from interaction of ozone with frozen and liquid NaCl/NaBr solutions: Quantitative separation of surficial chemistry from bulkphase reaction. J. Phys. Chem. A 2011, 115 (12), 2590−2598. (57) Rhim, J. A. Equilibrium concentration and overall Henry’s law constant of the dissolved ozone. Env. Eng. Res. 2004, 9 (2), 88−95. (58) Rischbieter, E.; Stein, H.; Schumpe, A. Ozone solubilities in water and aqueous salt solutions. J. Chem. Eng. Data 2000, 45 (2), 338−340. (59) Roth, J. A.; Sullivan, D. E. Solubility of ozone in water. Ind. Eng. Chem. Fund. 1981, 20 (2), 137−140. (60) Mmereki, B. T.; Donaldson, D. J. Direct observation of the kinetics of an atmospherically important reaction at the air−aqueous interface. J. Phys. Chem. A 2003, 107 (50), 11038−11042. (61) Rosen, M. J. Surfactants and Interfacial Phenomena, 3rd ed.; Wiley: Hoboken, NJ, 2004; p 444. (62) Kim, C.; Hsieh, Y.-L. Wetting and absorbency of nonionic surfactant solutions on cotton fabrics. Colloids Surf., A 2001, 187−188 (0), 385−397. 10978
dx.doi.org/10.1021/es401700h | Environ. Sci. Technol. 2013, 47, 10971−10979
Environmental Science & Technology
Article
(63) Saiz-Lopez, A.; Plane, J. M. C.; Baker, A. R.; Carpenter, L. J.; von Glasow, R.; Gómez Martín, J. C.; McFiggans, G.; Saunders, R. W. Atmospheric chemistry of iodine. Chem. Rev. 2011, 112 (3), 1773− 1804. (64) Saiz-Lopez, A.; von Glasow, R. Reactive halogen chemistry in the troposphere. Chem. Soc. Rev. 2012, 41 (19), 6448−6472.
10979
dx.doi.org/10.1021/es401700h | Environ. Sci. Technol. 2013, 47, 10971−10979