Vol.1 ● No.2 ● 2012
12
Scientific Research Journal of India
Correlation of Balance Tests Scores with Modified Physical Performance Test in Indian Community-Dwelling Older Adults Sunita Yadav* MPT (Neuro), Deepti Dhar** MPT (Paediatrics)
Abstract: Background and Objective: There is sufficient evidence which shows significant relationship between balance tests and other functional tests but there is lack of literature regarding the relationship between balance tests (BBS, MDRT, BPOMA) and Modified Physical Performance Test in different age groups of older adults. Design: An Observational Study Subjects: 58 subjects were divided into three different age groups, having the mean age of 65.3±3.0 (Group-A), 73.7±2.4 (Group-B), 82.6±1.4 (Group-C), mean height of 161.4±5.6 (Group-A), 164.9±10.2 (Group-B), 160.3±5.9 (Group-C) & mean weight of 68.4±4.8 (GroupA), 72.7±6.9 (Group-B), 63.6±7.7 (Group-C) were recruited in this study from old age home and local community. Methods: Subjects in each group performed the tests in the following sequence: BBS (Berg Balance Scale), MDRT (Multi-Directional Reach Test), Modified-PPT (Physical Performance Test) & BPOMA (Balance Performance-Oriented Mobility Assessment of Tinetti) with rest period of 5-10 minutes between each scale. Result: The results suggested that there was a significant positive correlation between balance tests and Modified Physical Performance Test in different age groups of older adults. Conclusion: The current study concluded that Modified physical performance test is a efficient tool to assess static and dynamic balance and also physical function and ambulation in different age groups of older adults. It was also observed that out of these balance tests used in the study, MDRT was the most difficult to understand and perform by subjects above 70 years and the subjects above 80 years found it really hard to understand the procedure. Keywords: BBS, MDRT, BPOMA, Modified PPT, Balance, Physical Function.
INTRODUCTION The number of persons above the
people at or over the age of 60,
age of 60 years is fast growing, especially
constituting
above
7.7%
in India. India is the second most populous
population.
country in the world has 76.6 million
important cause of morbidity and mortality
Recurrent
falls
of are
total an
http://www.srji.co.cc
Vol.1 ● No.2 ● 2012
13
Scientific Research Journal of India
in the elderly and are a marker of poor 2
physical and cognitive status.
their likelihood of falls and to enhance physical function.
Impaired balance and physical
The Berg Balance Scale was
function are the main causes of fall among
developed by Kathy Berg (a Canadian
the older adults. Stability and orientation
physical therapist) in1993, as a means of
are to distinct goals of the postural control
measuring balance in the elderly.
system. Postural control for stability and
Multi-directional
Reach
Test
orientation requires both perception and
(MDRT) is developed by Roberta A.
action. Thus, postural control requires the
Newton in 2001. It allows for analysis of
complex
the patient voluntary postural control.
interaction
of
neural
and
4
musculoskeletal systems.
The
Performance
Oriented
Several researchers show that as
Mobility Assessment (POMA) scale was
the age increases, the changes in the neural
originally developed by Dr. Mary E.
and musculoskeletal systems disturb the
Tinetti and first published in 1986, is a
balance and physical activities.6 As age
widely used tool for assessing mobility
increases
and
and fall risk in older people. In this study
physical function also decreases due to
balance subscale of Tinetti assessment is
11
used to assess the balance of older adults.15
the
physical activities
decreased muscular power and strength.
Both balance problems and physical
Brown,
Sinacore,
developed
adults. Therefore the assessment of both
performance test in 2005 to provide more
balance and physical function is necessary
focus
for older adults in order to help establish
substituting a chair rise task and a balance
appropriate
increase
task for the writing and stimulated eating
assign
tasks described in the original PPT. The
awareness appropriate
treatment of
fall
goals, risk
assistive
and
function
by
tool was more useful in identifying deficits
decrease the disability. Several such
in physical function than the self- report
instrument
satisfactory
comparison measure, the functional status
reliability and validity in identifying older
questionnaire. The authors concluded that
people
physical
the performance based measure could
functional problems, discriminating older
assist in early identification of minor
adults by their needs for different assistive
problems in physical functioning, and
device to maintain balance or predicting
allow for opportunity for early intervention
with
shown
balance
and
and
motor
physical
to
have
device
gross
modified
D.R.
inactivity affect the quality of life of older
on
the
M,
for the patients.16 http://www.srji.co.cc
Vol.1 ● No.2 ● 2012 Several
14
Scientific Research Journal of India
researchers
found that
Ability to walk at least 50 feet before
physical
sitting to rest; Minimal use of rail or cane
function and previous studies also found
while climbing. Exclusion Criteria: Use
significant correlation between balance
of any assistive prosthetic device; History
scales and other functional tests.17,18,13,19
of any cardiac problem confirmed by
Therefore it is clear that there is a
physician; Any history of fainting spells or
relationship between balance and physical
extended
function.
reasons History of neurological; vestibular
balancing
exercises
improve
dizziness
due
to
unknown
Yet there is no study to show
or auditory deficit confirmed by physician;
relationship between these scales or tests
History of any visual disorder which will
in different age groups. Therefore the main
not be corrected by optical glasses as
purpose of my study is to find out the
confirmed by physician; MMSE score
relationship between balance tests and
below 23; History of postural hypotension;
Modified
test.
History of recent fractures and severe
Second purpose is, the Modified physical
arthritic conditions; History of any major
performance test assesses both balance and
surgeries during last 6 month; History of
physical function in older adults no other
any previous balance training; Moderate to
tool is required because it measure the
severe hypertensions
physical
performance
both static and dynamic balance and also physical function. It tells about fall risk,
Measurement Tools
need of assistance device and functional
Berg Balance Scale (BBS)
limitations; additionally it takes less time
The BBS was developed to measure
to administer as compared to other scale.
balance
among
impairment
in
older balance
people
with
function
by
assessing the performance of 14 functional
METHODOLOGY This observational study recruited
tasks. The results are based on how long it
58 subjects from old age homes and local
takes to complete specific tasks and how
community
Dehradun
well the tasks are performed. Each task is
meeting the inclusion criteria. Inclusion
measured on a five point ordinal scale
Criteria: Age - 60 to 89 year old healthy
ranging from 0 to 4 (0 = unable to
subjects; Gender- Both male and female;
perform, 4 = independent) so that the
Ability to abduct and flex the shoulder up
aggregate score ranges from 0 to 56.
to 90 degrees; Ability to stand for
Multidirectional Reach Test (MDRT)
of
Delhi
and
minimum 10 min. without any assistance; http://www.srji.co.cc
Vol.1 ● No.2 ● 2012
15
Scientific Research Journal of India
The MDRT is an inexpensive, reliable and
Procedure
valid screening tool to measure the limits
The subjects were recruited based on
of postural stability in four directions
inclusion
(forward, backward, right & left) during
subjects of different age groups 60 to 69
standing. The distance of each reach is
years of age (Group- A), 70 to 79 years of
measured in centimetres or inches.
age (Group- B), and 80 to 89 years of age
Balance Performance Oriented Mobility
(Group- C). Subjects in each group
Assessment (BPOMA)
performed the tests in a sequence i.e. BBS,
The Tinetti assessment is a physical task-
MDRT, Modified-PPT, POMA. The whole
oriented scale which measures the gait and
procedure was explained to each subject
balance activities of older adults. In this
and the subject signed a consent form
study BPOMA was used to assess the
before performing the study. Description
balance of the community dwelling older
data was collected which included age,
adults; it consists 9 tasks. 6 tasks are
gender, height, weight and number of falls
measured on a three point ordinal scale
in the past 6 months. MMSE score was
ranging from 0 to 2 and remaining three
also assessed. All subjects were assessed
tasks are measured on a two point ordinal
by all four scales or tests in the following
scale ranging from 0 to 1 ( 0 = unable to
order BBS, MDRT, Modified-PPT and
perform, 1 & 2 = independent). The
BPOMA. All components of each scale
maximum score is 16.
were demonstrated to all the subjects and
Physical Performance Test (Modified-
one practice session was done for all the
PPT)
components of four scales by all the
An objective evaluation of overall physical
subjects, after that reading was taken. Each
function was obtained by using modified
test or scale was administered by myself.
PPT. The severity of physical frailty in
All subjects were offered rest breaks and
physical functioning was assessed using a
water during the session and completed the
modified PPT. It consists of 9 tasks; each
approximately 60 minute testing protocol
task is measured on a five point ordinal
without
scale ranging from 0 to 4 ( 0 = unable to
discomfort. The resting period of 5 to 10
perform, 4 = independent) except 7th task
minute was given after performing each
(turning 360 degrees) which ranges from 0
scale. As a precautionary measure, blood
to 1 (0 = unsteady, 1 = steady). The
pressure was checked prior to beginning of
maximum score is 36.
the test session and it was again taken at
and
exclusion
complaint
of
criteria
fatigue
the
or
the end of the last test performed. One http://www.srji.co.cc
Vol.1 ● No.2 ● 2012
16
Scientific Research Journal of India
person was always nearby vicinity of the
1] was calculated. The mean and standard
subject.
deviation of balance tests and physical Data Analysis
performance test (modified) of Group – A
The data analysis was done on SPSS 11.5
[Table 2], Group – B [Table 3], & Group –
software. The arithmetical mean and
C
standard deviation of age, height and
correlation values of balance tests with
weight
were
modified physical performance test of
evaluated. Karl pearson’s correlation test
Group – A [Table 5], Group – B [Table 6],
was done to analyse the correlation
& Group – C [Table 7], were calculated.
between balance tests (BBS, MDRT &
Karl pearson’s correlation test was used to
POMA) with physical performance test
find out the correlation between BBS,
(modified)
people.
MDRT & BPOMA with PPT (modified) in
Statistical significance level was set at <
different age groups of older adults, Group
0.05. The data analysis was done on SPSS
– A (60 – 69 years of age), Group – B (70
11.5 software. The arithmetical mean and
– 79 years of age), and Group – C (80 - 89
standard deviation of age, height and
years of age); these three groups showed
weight
were
significant positive correlation between
evaluated. Karl pearson’s correlation test
balance tests (BBS, MDRT & BPOMA)
was done to analyse the correlation
with physical performance test (modified).
in
in
demographic
among
data
elderly
demographic
data
[Table
4],
was
calculated.
The
between balance tests (BBS, MDRT & POMA) with physical performance test (modified)
among
elderly
people.
Table 1: Mean and standard deviation of demographic data
Statistical significance level was set at < 0.05.
RESULT AND INTERPRETATION
Group – A Age Height Weight
N 20 20 20
Age Height Weight
N 20 20 20
Group – B
A sample of 58 subjects were selected on the basis of inclusion and exclusion criteria. Each group of older adults had 20 subjects except Group – C (81-89 years of age) which has only 18 subjects due to unavailability of the subjects. The mean and standard deviation of age weight and height of three Groups A, B and C [Table
Mean 65.3±3.0 161.4±5.6 68.4±4.8
Mean 73.7±2.4 164.9±10.2 72.7±6.9
Group – C N Mean Age 20 82.6±1.4 Height 20 160.3±5.9 Weight 20 63.6±7.7 Table 1 shows mean and standard deviation of demographic data of different age groups. Group –
http://www.srji.co.cc
Vol.1 ● No.2 ● 2012
(60 – 69 years of age), Group –B (70 – 79 years of age) & Group – C ( 80 – 89 years of age).
Table 2: (Group – A) Mean and standard deviation (SD) of balance tests (BBS, MDRT & BPOMA) and Physical Performance Test (Modified). Tests BBS FR (MDRT) BR (MDRT) RR (MDRT) LR (MDRT) BPOMA PPT (modified)
N 20 20 20 20 20 20 20
Table 3: (Group – B) Mean and standard deviation (SD) of balance tests (BBS, MDRT & BPOMA) and Physical Performance Test (Modified). N 20 20 20 20 20 20 20
Mean and SD 27.7±5.3 12.0±3.4 9.9±3.9 11.2±3.3 11.4±4.3 12.9±2.2 27.7±5.3
Table 3 shows mean and standard deviation of balance tests and physical performance test (modified) of Group-A (70-79 Years of age).
Table 4: (Group – C) Mean and standard deviation (SD) of balance tests (BBS, MDRT & BPOMA) and Physical Performance Test (Modified). Tests BBS FR (MDRT) BR (MDRT) RR (MDRT) LR (MDRT) BPOMA PPT (modified)
N 20 20 20 20 20 20 20
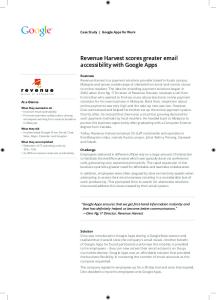
Figure 1: Mean and standard deviation of balance tests (BBS, MDRT, & BPOMA) with modified physical performance test (modified) of Group A, B and C.
Mean and SD 54±2.4 13.6±2.6 11.8±2.6 12.5±2.5 12.2±3.0 14.9±1.9 31.1±2.5
Table 2 shows mean and standard deviation of balance tests and modified physical performance test of Group-A (60-69 Years of age).
Tests BBS FR (MDRT) BR (MDRT) RR (MDRT) LR (MDRT) BPOMA PPT (Modified)
17
Scientific Research Journal of India
Mean and SD 42.6±3.6 5.5±2.2 3.2±1.9 4.9±2.3 4.4±2.2 10.5±1.4 18.0±3.5
Table 4 shows mean and standard deviation of balance tests and Modified physical performance test of Group A (80-89 Years of age).
Table 5: (Group A) Correlations of balance tests (BBS, MDRT, & POMA) with Physical Performance Test (Modified) Balance Tests BBS Vs PPT (modified) FR( MDRT) Vs PPT (modified) BR (MDRT) Vs PPT (modified) RR (MDRT) Vs PPT (modified) LR (MDRT) Vs PPT (modified) BPOMA Vs PPT (modified)
r value .759 .592 .671 .541 .518 .826
P value .000 .006 .001 .014 .019 .000
Table 5 shows correlation of balance tests with physical performance test (modified), all the balance tests show significant correlation except right and left reaches which show moderately significant correlations with physical performance test (modified) of Group – A (60 – 69 years of age).
Figure 2: Correlation Graph of Berg Balance Scale (BBS) and Physical Performance Test (Modified) of Group – A.
Figure 2 depicts correlation between BBS and modified PPT. It shows positive significant correlation in 60-69 years of age group i.e. Group – A.
http://www.srji.co.cc
Vol.1 ● No.2 ● 2012
18
Scientific Research Journal of India
Figure 3: Correlation Graph Of Forward Reach (FR) of MDRT and Physical Performance Test (Modified) Of Group – A.
Figure 3 depicts correlation between FR of MDRT and PPT (modified). It shows positive significant correlation in 60-69 years of age group i.e. Group – A.
Figure 4: Correlation Graph of Backward Reach (BR) of MDRT and Physical Performance Test (Modified) Of Group – A.
Figure 4 depicts correlation between BR of MDRT and PPT (modified). It shows positive significant correlation in 60-69 years of age group i.e. Group – A.
Figure 5: Correlation Graph of Right Reach (RR) of MDRT and Physical Performance Test (Modified) of Group A.
Figure 6: Correlation Graph Of Lateral Reach (LR) of MDRT and Physical Performance Test (Modified) of Group – A.
Figure 6 depicts correlation between LR of MDRT and PPT (modified). It shows positive significant correlation in 60-69 years of age group i.e. Group – A.
Figure 7: Correlation Graph of Balance Performance Oriented Mobility Assessment (BPOMA) with Physical Performance Test (Modified) of Group – A.
Figure 7 depicts correlation between BPOMA and Modified PPT (modified). It shows positive significant correlation in 60-69 years of age group i.e. Group – A.
Table 6: Correlations of balance tests (BBS, MDRT, & BPOMA) with Physical Performance Test (modified) of Group - B. Balance Tests
Figure 5 depicts correlation between RR of MDRT and PPT (modified). It shows positive significant correlation in 60-69 years of age group i.e. Group – A.
BBS Vs PPT (modified) FR( MDRT) Vs PPT (modified) BR (MDRT) Vs PPT (modified) RR (MDRT) Vs PPT (modified) LR (MDRT) Vs PPT (modified) BPOMA Vs PPT (modified)
r value .944 .874 .893 .826 .710 .856
P value < .01 < .01 < .01 < .01 < .01 < .01
Table 6 shows significant correlation between balance tests (BBS, MDRT & BPOMA) and
http://www.srji.co.cc
Vol.1 ● No.2 ● 2012
Scientific Research Journal of India
modified physical performance test in older adults [Group – B (70 – 79 years of age)].
Figure 8: Correlation graph of Berg Balance Test (BBS) with Physical Performance Test (Modified) Of Group – B.
Figure 8 depicts correlation between BBS and PPT (modified). It shows positive significant correlation in 70-79 years of age group i.e. Group – B.
Figure 9: Correlation graph of Forward Reach of MDRT with Physical Performance Test (Modified) of Group B.
Figure 9 depicts correlation between FR of MDRT and PPT (modified). It shows positive significant correlation in 70-79 years of age group i.e. Group – B.
Figure 10: Correlation graph of Backward Reach (BR) of MDRT with Physical Performance Test (Modified) Of Group – B.
19
Figure 10 depicts correlation between BR of MDRT and PPT (modified). It shows positive significant correlation in 70-79 years of age group i.e. Group – B.
Figure 11: Correlation graph of Right Reach (RR) of MDRT with Physical Performance Test (Modified) of Group B.
Figure 11 depicts correlation between RR of MDRT and PPT (modified). It shows positive significant correlation in 70-79 years of age group i.e. Group – B.
Figure 12: Correlation graph of Left Reach (LR) of MDRT with Physical Performance Test (Modified) Of Group B.
Figure 12 depicts correlation between LR of MDRT and PPT (modified). It shows positive significant correlation in 70-79 years of age group i.e. Group – B.
Figure 13: Correlation graph of Balance Performance Oriented Mobility Assessment (BPOMA) with Physical Performance Test (Modified) Of Group B.
http://www.srji.co.cc
Vol.1 ● No.2 ● 2012
Scientific Research Journal of India
20
Figure 13 depicts correlation between POMA and PPT (modified). It shows positive significant correlation in 71-79 years of age group i.e. Group – B
Figure 15 depicts correlation between FR of MDRT and PPT (modified). It shows positive significant correlation in 81-89 years of age group i.e. Group – C.
Table 7: Correlations of balance tests (BBS, MDRT, & BPOMA) with Physical Performance Test (Modified) – Group-C.
Figure 16: Correlation graph of Backward Reach (BR) of MDRT with Physical Performance Test (Modified) of Group C.
Balance Tests
r P value value BBS Vs PPT (modified) .789 < .01 FR( MDRT) Vs PPT (modified) .822 < .01 BR (MDRT) Vs PPT (modified) .852 < .01 RR (MDRT) Vs PPT (modified) .770 < .01 LR (MDRT) Vs PPT (modified) .752 < .01 B POMA Vs PPT (modified) .651 < .01 Table 7: also shows significant correlation between balance tests ( BBS, MDRT & BPOMA) and physical performance test (modified) in older adults [Group – C ( 80 – 89 years of age)].
Figure 14: Correlation graph of Berg Balance Scale (BBS) with Physical Performance Test (Modified ) Of Group C.
Figure 14 depicts correlation between BBS and PPT (modified). It shows positive significant correlation in 81-89 years of age group i.e. Group – C.
Figure 15: Correlation graph Of Forward Reach (FR) of MDRT with Physical Performance Test (Modified) Of Group C.
Figure 16 depicts correlation between BR of MDRT and PPT. It shows positive significant correlation in 81-89 years of age group i.e. Group – C.
Figure 17: Correlation graph of Right Reach (RR) of MDRT with Physical Performance Test (Modified) of Group C.
Figure 17 depicts correlation between RR of MDRT and PPT (modified). It shows positive significant correlation in 81-89 years of age group i.e. Group – C.
Figure 18: Correlation graph of Left Reach (LR) of MDRT with Physical Performance Test (Modified) of Group – C.
http://www.srji.co.cc
Vol.1 ● No.2 ● 2012
21
Scientific Research Journal of India
Figure 18 depicts correlation between LR of MDRT and PPT (modified). It shows positive significant correlation in 81-89 years of age group i.e. Group – C.
the functional decline. Balance instability
Figure 19: Correlation graph of Balance Performance Oriented Mobility Assessment (BPOMA) with Physical Performance Test (Modified) of Group – C.
(activities of daily living). Therefore,
and physical inactivity in older adults contribute to this decline in ADLs effective
balance
and
functional
assessments are needed to document balance and functional abilities and in this segment of the older adult population. This information is critical to the design of all prevention/reduction
programs
and
to
maintain or improve the quality of life for these individuals.25 The BBS, MDRT, & BPOMA have Figure 19 depicts correlation between BPOMA and PPT (modified). It shows positive significant correlation in 81-89 years of age group i.e. Group – C.
documented validity and reliability to
DISCUSSION
also documented validity and reliability to
assess balance abilities. As well as physical performance test (modified) has
Assessing balance and physical
assess functional abilities in community
abilities as they relate to falls in older
dwelling older adults. Previous researchers
adults is complex due to many social and
found significant relationship between
health related issues that may be involved.
balance scales (BBS, MDRT & BPOMA)
The geriatric population above 80 years
with other functional performance tests;
adults
complicated
Barthel mobility subscale, Time up and go
situation due to a sedentary life style, a
Test and Physical Performance Test
lower level of function, and the dynamics
respectively 13, 25, 26. But there is little to no
of
emotional
documentation of relationship between
environments. Any one or combination of
three balance scales with PPT (modified).
these factors may lead to a falls at any time
Thus this study was done to find out the
because the level of the older adult’s
relationship of these three balance scales
performance may not meet the demands of
with physical performance test (modified).
the environment or task at hand. The need
The clinical trial studied the correlation
to reduce this functional decline is an
between balance tests (BBS, MDRT, &
important health care issue. It is important
BPOMA) and physical performance test
presents
their
a
physical
more
and
to identify those factors that contribute to http://www.srji.co.cc
Vol.1 ● No.2 ● 2012
22
Scientific Research Journal of India
(modified) among elderly people who
number of female subjects are more than
were divided into three age categories.
males so it could be the reason for lowest
Berg Balance Scale (BBS)
values. Another study found mean values
The last two items of the Berg Balance
of BBS in fallers (36.5) and nonfallers
Test are considered the most difficult to
(35.7) older adults;25 these values are very
perform. These tasks are: item no. 13 & 14
low as compared to the current study. The
(stand with feet in tandem for 30 seconds,
reasons could be one that the mean age of
stand on one leg respectively), One study
this study population is 83±8.8 years
found that item numbers 12, 13, & 14 are
which shows very older subjects. Secondly
25
the most difficult tasks to perform, but in
they examined community dwelling older
the current study only 6 subjects (Group B
adults who were home bound and have a
& C) found difficulty to perform the 12th
neurological or musculoskeletal diagnosis
task. All the subjects got grade 4 for the
that may disturb the balance and contribute
1st, 2nd, 3rd, & 4th components of the
to falls . In another study the mean value
BBS. Not one subject reached up to 25cm
of BBS is 48.6 and the mean age of this
for the 8th component (Reaching forward
study is 74.1± 7.9 years which is
with outstretched arm while standing) of
approximately similar to Group-B of the
the BBS.
current study. The mean value of BBS of
In the current study the mean values (54,
the current study is 49.65 which is slightly
49 & 42, as shown in tables 2, 3 & 4) of
more, the reason could be the age
BBS in different age groups are lower
difference because the mean age of the
from the findings (55,55; 53,52; & 52,48
Group-B is 73.70 ± 2.4 which shows that
for male and female respectively) of one
the subjects were mostly between 71 to 75
study in 3 age groups (60-69, 70-79, &
years and the subjects of the above said
34
This difference may be due
study were mostly between 68 to 81 years,
to age difference. They have given the
so this could be the reason for the lowest
average mean of age (69); they did not
value of BBS among 254 community-
mention the mean value of age for
dwelling older adults.13
individual groups so the subjects of the
A study done by Patricia S. Smith found
this study may be slightly younger than my
significant relationship between BBS and
study; in this study the mean values for
forward reach in post acute stroke patients
females in each age group have lower than
(r = 0.78).27 The BBS has also been
males and in the current study the scores of
shown to correlate with both the Tinetti
the tests for the females also lower and the
mobility index (r = 0.91) and the “get up &
80+ years).
http://www.srji.co.cc
Vol.1 ● No.2 ● 2012
23
Scientific Research Journal of India
go test” (r = - 0.76).28 A correlation greater
groups. It also indicates that there is a
than 0.70 between total BBS and total
relationship between age and height with
Fugl-Mayer-Scale (FMS) scores have been
performance on the lateral reach test.
reported in older adults.
18
The above
These results similar to the study who
studies shows correlations between BBS
reported that, similar to functional reach
and other functional tests. This current
performance is positively correlated with
study also shows significant correlation
height and negatively correlated with
between BBS and physical performance
age.22 The four heighted persons were
test (modified), [r = 0.759, P = <0.01
present in the current study, the values of
(Group - A); r = 0.944, P = <0.01 (Group -
all the components of MDRT were greater
B); ); r = 0.789, P = <0.01 (Group - C); as
to these heighted persons as compared to
shown in tables 5, 6, 7 & figures 2, 8, and
other
14 respectively]. The reason of significant
performance of the functional and lateral
correlation between BBS and physical
reach tests in the present study are lower
performance test (modified) could be one
than mean scores reported elsewhere.13,29,
that the five components are similar
30
between BBS and PPT (modified) and
elderly females (age, 70-87 years), a study
secondly both BBS and PPT (modified)
reported a mean functional reach of
assess static and dynamic balance and also
26.7±8.9cm.30 In another research, with a
physical activity.
larger sample of 254 elderly community-
Multi-directional Reach Test (MDRT)
dwelling adults (mean age = 74.1±7.9
In MDRT backward reach is the most
years), It was reported a mean forward,
difficult task to perform because most of
backward, right and left reach tests scores
the subjects of the Group-C used to take a
of 22.6±8.6cm, 11.5±7.8cm,17.5±7.6 &
step behind while performing this reach.
16.8±7.4cm respectively.13 Yet another
MDRT is considered the more time taking
study reported mean left and right lateral
test and most difficult to understand by the
reach test scores of 21.0±2.5cm and
subjects because the mostly older adults
20.0±0.5cm respectively, from 60 healthy
use the spine not the ankle for the reaches.
females over the age of 65 (mean age =
This current study shows there is a
72.5±5.0 years).29 In each of the above
significant
between
mentioned studies scores were defined as
components (FR, BR, RR & LR) of
the mean multiple trials which may reflect
MDRT and physical performance test
score inflation due to learning over
(modified) in older adults of different age
multiple trials. In contrast, scores in
relationship
subjects.
Mean
scores
on
In a sample of 14 community dwelling
http://www.srji.co.cc
Vol.1 ● No.2 ● 2012
24
Scientific Research Journal of India
present study were recorded from a single
as shown in table- 1). Another study found
trial. Additionally, subjects used the ankle
mean value of 13±2.9 among females
movements rather than spine movements
(mean age = 83.8±7.7 years),33 which is
which reflects the negative correlation
more
between age and ankle muscle strength,
(10.5±1.4, as shown in table- 4 ) of Group-
sensation and ability to generate large
C of the current study, in fact mean age
amounts of force at the ankle joint.31
was similar (82.6±1.3 years, as shown in
One of studies in past have revealed that
table- 1 ). The subjects for Group-C were
MDRT demonstrated significant inverse
all
relationships with scores on the time up &
component was more among the subjects
go test (TUG): [FR (r = -0.442) BR (r = -
of the current study while in the above said
0.333), RR (r = - 0.260), LR (r = - 0.310)
study where mean value was 83.8±7.7
which is a functional performance test.13
years, many subjects less than may 80
Similarly current study showed significant
years. Hence the balance scores were
correlation between MDRT and modified
better for them.
physical performance test which is again a
Physical Performance Test (Modified-
functional performance test with high
PPT)
validity and reliability. Hence it can be
In modified physical performance test, the
said
good
Ist & 2nd tasks were considered the most
functional
difficult task to perform by the subjects
that
correlation
MDRT with
also
shows
different
as
above
compared
80
and
to
mean
physical
value
frailty
performance tests.
mainly for the Groups B & C. Seven
Tinetti Balance Subscale
subjects were using the assistive devices
During the performance of this test, the
for the 8th & 9th components (climb one
subjects did not find any difficulty with
flight of stairs and climb stairs) of the
any of the tasks in the balance of
physical performance test (modified) and
performance-oriented mobility assessment
four subjects climbed the stairs by holding
(BPOMA) of Tinetti.
the one sided railing.
One study found a mean among the
In one study it was found that the mean
community dwelling older women with no
value of the PPT (modified) score among
health problems on the balance subset of
27 frail obese older volunteers after
32
12.6±1.7 (mean age = 74.7±6.0 years),
treatment was 29.4±2.2 and for control
which is similar to mean value (12.9±2.1,
group it was 29.8±2.0.34 Mean age was
as shown in table- 3) of Group-B of the
71.1±5.1for
current study (mean age = 73.7±2.4 years,
matched the current age of Group – B but
treatment
group
which
http://www.srji.co.cc
Vol.1 ● No.2 ● 2012
25
Scientific Research Journal of India
the mean value is lower i.e. 27.6±5.2 as
subjects 16 were female. It has been well
shown in table- 3, this difference is may be
established
due to age because in my study the mean
component is affected due to larger body
age for the Group - B is 73.7±2.4, which
mass in the upper segment the of body.
shows that the subjects were slightly older
The age is an important factor that affects
which reflects the negative correlation
both balance and physical function of older
between age and physical function.35 The
adults. Declines in standing balance have
mean age of group-A of current study is
been attributed to sensory, musculoskeletal
65.2±3.0 which is slightly younger than
and cognitive changes, typically in some
the control group (69±4.6) of the above
combination as multiple systems fall
study, therefore the mean value for this
below minimal functional thresholds.36
group of my study is more and second
The results of the balance tests and
reason could be that the subjects were
physical performance test (modified) are
obese which also reflects the negative
different in different age groups of older
correlation between obesity and physical
adults, which proved that the disturbance
function.
35
that
in
females
balance
in balance and physical function also differ
Another study found the mean values of
in severity (mild, moderate and severe for
physical performance test (modified) in
group A, B & C respectively) among
community dwelling older adults. The
different age groups of older adults. Thus
mean values of three groups [obese
assessment and treatment also differ to
elderly, nonobese frail, and nonobese
provide effective evaluation and treatment
nonfrail] were 34.4±0.5, 29.3±0.7 and
in different age groups. Additionally safety
15
27.8±0.8 respectively. The second group
measures are necessary for the Group – C
of above study matched with Group - B of
(80-89 years of age) in the assessment and
the current study in respect similar age,
treatment also to prevent fall.
weight and condition but the mean value of physical performance test (modified) is
CONCLUSION There is a significant relationship between
more than the current study, the reason
balance tests and physical performance test
could be that the subjects of my study may
(modified) and physical performance test
be more frail and reason could be the
(modified) is an efficient tool to assess
larger number of female subject in the
static and dynamic balance and also
current study compared to this study, there
physical function and ambulation in
both genders were in equal proportion
different age groups of older adults. It was
while in the current study out of 20
also observed that out of the these balance http://www.srji.co.cc
Vol.1 ● No.2 ● 2012
26
Scientific Research Journal of India
tests used in the study, MDRT was the
functional level as well as the balance
most difficult to understand and perform
issues in an elderly person rather than
for people above 70 years and subjects
giving other tests which are time taking,
above 80 years found it really hard to
separately for balance and functional
understand the procedure. According to
performance.
this test the subject was supposed to perform movement at the ankle joint but more of trunkal mobility was seen in people above 80 years while performing this test. Hence it can be said that MDRT is not a very feasible test for cheeking balance in subjects above 80 years.
60 years continues to grow, there will be rise in the level of functional disability and health.
imperative methods
that are
It
is
therefore
appropriate
screening
developed
to
identify
community dwelling elderly individuals with functional impairment who should be referred for a detailed physical therapy evaluation. As we have seen that PPT (modified)
incorporates
all
small. The sample size of age Group – C (81-89 years of age) was relatively smaller as compared to other groups. Gait subscale of
performance
oriented
mobility
assessment is not included in this study.
Clinical significance As the Indian population over the age of
prolonging
Limitations In the present study, the sample size was
important
entities of balance and function hence,
Future Research Future study can be done with larger sample size to see the results. Future research is needed to find out the reliability
and
validity
of
modified
physical performance test with balance scales (PPT, MDRT & BPOMA) in elderly. In my study the value of the left lateral reach is more than right lateral reach for the heighted person. Future study can be done to identify that why this difference has come and this difference is significant or not.
simply administering modified physical performance testing can well define the References 1. Alexander
Kalache,
Bruno
older people: National/Regional
Lunenfold. Health and men ageing.
review of India. Available from:
2001.
http://
Available
from:
www.
Who_nmh_nph_01.2.pdf. 2. Dr.
B.
Krishnaswamy,
www.who.int/ageing/projects/SEA Dr.
RO
Gnanasambandam Usha. Falls in http://www.srji.co.cc
Vol.1 ● No.2 ● 2012
27
Scientific Research Journal of India
3. Christopher
M.
Pathophysiology
of
Fredericks.
limited older adults. J Gerontology.
the
2010;495-502.
motor
systems: principles and clinical
8. Keith smith. Sensory changes:
presentations. F.A. Davis company.
Senior
Philadelphia: Jean-Francois Vilain;
http:// www. Goldenbuckeye.com,
1996. p. 284.
http://senior series.osu.edu.
4. Ann
Shumway-cookjorie
Morjorie control
H.woollacott. theory
and
H., Motor
practical
series.
9. Marjorie
H.
Shumway.
Available
from:
Woolacott,
Cook,
Lewis
Ann M.,
Nashner.
Ageing
and
posture
applications. 2nd ed. Lippincott
control:
changes
in
sensory
Williams and Wilkins: 2001. p.
organization
164-165, 181-182, 222-238.
coordination. The international J of
5. Kathryn H. Schmitz, Ann R. Cappola. The interaction of cancer and aging: Estallishing the need for breast
cancer
rehabilitation.
and
muscular
ageing and human development. 1986;23(2):97-114. 10. H.J.J.(cojanne) kars, B. Eng., Juha
J
M., Hijmans, Jann H.B. Geertzen,
Cancer epidemiol biomarkers prev.
Wiebren Zijlsta. The effect of
2007;16(5):866-72.
reduced
somatosensation
on
6. Jan Janseen, sleven B. Heymsfield,
standing balance: A systematic
Robert Ross. Low relative skeletal
review. J Diabetes Sci Technal.
muscle mass (sarcopenia) in older
2009 July; 3(4): 931-943.
persons
is
associated
with
11. Siobhan M White, Thomas R
functional impairment and physical
Wojcicki,
disability. J American geriatrics
Physical activity and quality of life
society. 2002;50(5):889-896.
in
7. David Kieran
clark, F.
carolynnpattern,
Reid,
Robert
J,
Carobello, Edward M. Phillips, Roger
A.
Feilding.
Edward
community
adults.
J
mcauley.
dwelling
Biomed
central
older ltd.
2009;7:10. 12. Lusardi,
M.M.
Functional
Impaired
performance in community living
voluntary neuromuscular activation
older adults. J Geriatric Phys Ther.
limits muscle power in mobility
2004;26(3):14-22.
http://www.srji.co.cc
Vol.1 ● No.2 ● 2012
28
Scientific Research Journal of India
13. Roberta A. Newton. Validity of multidirectional
a
based exercise program on physical
practical measure for limits of
function in frail older adults. J of
stability
geriatric Phys Ther. 2010 April-
in
reach older
Gerontology
test:
Moseia A. The effects of a home-
adults.
medical
J
sciences.
56A(4);M248-M252. 14. Clinimetric
19. Homjet Tal-Hatu Kolapo, Fashoyin
properties
performance
june;33(2): 78-84.
oriented
of
the
Oyinlola
Funmilayo.
Balance
mobility
retraining in post stroke patients
assessment. J Phys Ther 2006 July
using a simple, effective and
1.
affordable technique reduction De
15. Kathryn D. Mitchell, Roberta A. Newton. mobility
Performance-oriented assessment
(POMA)
L’ equilibre après un accident vasculaire cerebral grace a une technique
simple,
efficace
et
balance scale indicates need for
accessible.
assistive
neurological sciences. 2007; 26(2).
device. 2006;1(3):183-
189.
20. Ganvir
16. Dennis T. Villareal, Marian banks,
J
SD.
functional
American
Assessment
capacity
in
of
elderly
Catheraian Siener, David R. Sina
population by elderly mobility
Core,
scale in wardha. Indian academy of
Samuel
Klein.
Physical
frailty and body composition in obese elderly men and women. J Obesity
A
Research
J.
2004;12:913-920. 17. Angela
Conrad
21. Tm steffen, LA Mollinger. Agegender related test performance in community-dwelling adults. J of
Wooton.
An
integrative review of Tai Chi research: An alternative form of physical
geriatrics. 2008;4:89-97.
to
Phys
Ther.
2005;29(4):181-188. 22. Patricia
S
Smith,
Judith
A
improve
Hombree, Mary E Thompson. Berg
balance and prevent falls in older
balance scale and functional reach:
adults. J Orthopaedic Nursing.
determining the best clinical tool
2010 April; 29(2): 108-116.
for individuals post acute stroke. J
18. Matsuda,
activity
neurological
Patricia
Shumway-Cook,Anne,
Noritake, Ciol,
Clinical
rehablilitation.
2004;18(7):811-818.
http://www.srji.co.cc
Vol.1 ● No.2 ● 2012 23. Berg
K,
29
Scientific Research Journal of India Wood-Dauphinu
S,
Williams J, Gayton D. Measuring balance in the elderly: preliminary
patients.
J
American
Heart
Association. 2002;33:1022. 28. Sabrina E., Trader, Roberta A.
development of an instrument. J
Newton,
Phys Ther association. 2001 sept
Balance abilities of homebound
10.
older adults classified as fallers and
24. Jennifer
S
Brach,
Jessie
M
Vanswearingen, Anne B Newman,
RonitaL.,
Cromwell.
nonfallers. J of geriatric Phys Ther. 26(3):03.
Andrea M Kriska. Identifying early
29. Duncan PW, Weiner DK, Chandler
decline of physical function in
J, Studenskis S. Functional reach: a
community-dwelling older womem
new clinical measure of balance. J
: performance-based and self report
Gerontol Med Sd. 1990;45:M192-
measures. J American Phys Ther
M197.
Association. 2001 Sept 10. 25. Teresa
Steffen,
30. DeWaard B, Bentrup B, Hollman J,
Megan Seney.
Brasseur J. Relationship of the
Test-retest reliability and minimal
functional reach and lateral reach
detectable change on balance and
tests in elderly females. J Geriatr
ambulation tests, the 36-item short
Phys Ther. 2002; 25:4-9
form health survey and the unified
31. Sadashiv Ram Aggarwal, Deepak
Parkinson disease rating scale in
kumar. Lower extremity muscle
people with parkinsonism. J Phys
strength and balance performance
Ther. 2008 june;88(16):733-746.
in
26. Mary Thompson, Ann Medley. Forward functional
and
lateral
reach
in
sitting younger,
middle-aged and older adults. J of geriatric Phys Ther. 30(2):07. Tang,
Ching-Fan
community-dwelling
elderly men aged 50 years and above. Indian J of Phys Ther and occupational therapy. 2007;1(2). 32. Chiara
Mecagni,
Janet
Pullin
Smith, Kay E Roberts, Susan B O’
27. Hui-Fen Mao, Fing Hsueh, FeiFang
Indian
Sheu.
Sullivan. Balance and ankle range of motion in community-dwelling
Analysis and comparison of the
aged
psychometric properties of three
correlational study. J of American
balance
measures
for
64
to
87
years
:
A
stroke
http://www.srji.co.cc
Vol.1 ● No.2 ● 2012
30
Scientific Research Journal of India
Phys Ther Association. 2000 May
Physical
activity
and
30;
dehydroepiandrosterone
sulphate,
insulin-like
growth
1
testosterone
in
33. Dennist , Villareal, Marian Banks, David
R,
Sinacare,
Catherine
healthy
Siener, Sarmuel Klein. Effect of
elderly people. J
weight loss and exercise on frailty
journals. 1998;27:745-751.
in obese older adults. Arch Intern Med. 2006;166:860-866.
and active
Ageing oxford
36. Dr. Sandra Brauer, Y Voner Burns, Prudence Galley. Lateral reach: a
34. Karen W, Hayes, Marjorie E.
clinical measure of medio-lateral
Johnson. Measures of adult general
postural stability. J Phys Ther Res
performance tests. Arthritis care
Int. 1990;4:81-88.
and
research.
2003
Oct
15;49(55):S28-S42. 35. Marc Bonnefoy, Tomasz Kostka, Marie
C. Patricol,
Sophic E,
Bethouze, Brono Mathian et al.
CORRESPONDENCE *Student, Dolphin Institute, Dehradun affiliated to H.N.B Garhwal University, Uttarakhand, India Mob: 08882590557. **Lecturer, Dolphin Institute, Uttarakhand. India
http://www.srji.co.cc