22:52
Geophysical Journal International
gji2180
Geophys. J. Int. (2004) 157, 1–14
doi: 10.1111/j.1365-246X.2004.02180.x
Current shortening across the Himalayas of Nepal F. Jouanne,1, ∗ J. L. Mugnier,2 J. F. Gamond,3 P. Le Fort,2 M. R. Pandey,5 L. Bollinger,4 M. Flouzat4 and J. P. Avouac4 1 LGCA,
UMR CNRS 5025, Universit´e de Savoie UMR CNRS 5025, Universit´e J. Fourier 3 LGIT, UMR CNRS 5559, Universit´ e J. Fourier 4 CEA, LDG, Bruyeres le Chatel, France 5 Department of Mines and Geology, Lainchaur, Katmandu, Nepal 2 LGCA,
Accepted 2003 November 1. Received 2003 October 30; in original form 2002 March 22
SUMMARY Underthrusting of the Indian lithosphere beneath the Himalayas occurs during the Quaternary period along a gently north-dipping main basal detachment (main Himalayan thrust: MHT), from which the southernmost emergent ramp (main frontal thrust: MFT) branches. Historical seismicity shows that slip on the MHT is frequently accommodated through M > 8 shallow earthquakes, but shows a seismic gap in western Nepal. This absence of major historical earthquakes in western Nepal can be explained either by an aseismic slip on the MHT or a longlived elastic strain accumulation. To test these hypotheses, the present-day displacement field has been measured for a GPS network formed of 35 sites. The updated solution presented in this paper combines data from 1995, 1997, 1998 and 2000 measurements. The lack of deformation (less than 3 · 10−8 yr−1 ) through the outer belt does not fit with a regional aseismic slip along the southern part of MHT. A less than 3 mm yr−1 aseismic slip could nonetheless affect restricted areas of the outer belt. In contrast, a strain accumulation of more than 30 · 10−8 yr−1 is measured south of the Higher Himalayas, in a zone where an intense microseismicity reflects a stress build-up. It is presumably generated by locking of the aseismic creep that occurs along the MHT beneath the Higher Himalayas and Tibet. The displacement field is simulated by a dual-dislocation model that takes into account the pattern of microseismicity, and particularly a segmentation between central and western Nepal. The best fit between the measured and simulated displacement fields is obtained with 19 mm yr−1 thrust and 0–1 mm yr−1 dextral strike-slip components along a 117◦ NE dislocation locked to a depth of 20–21 km beneath western Nepal, and 19–20 mm yr−1 thrust and 0–2 mm yr−1 dextral strike-slip components along a 108◦ NE dislocation locked to a depth of 17–21 km beneath central Nepal. The width of the locked zone between the main frontal thrust and the creeping zone is of the same order, but rather greater, in western Nepal than in central Nepal. Therefore it is expected that M > 8 earthquakes could occur in western Nepal. Key words: continental deformation, earthquake location, fault models, Himalayas, Nepal, plate convergence, satellite geodesy.
I N T RO D U C T I O N The present-day structure of the Himalayas is characterised by underthrusting of the Indian lithosphere beneath the chain along the main Himalayan thrust (MHT) (Zhao et al. 1993). This structure absorbs about 20 mm yr−1 convergence (Bilham et al. 1997), that is
∗ Now at: LGCA UMR CNRS 5025, Campus Scientifique, Universit´e de Savoie, 73376 Le Bourget du Lac Cedex, France. E-mail: Jouanne@ univ-savoie.fr � C
2004 RAS
nearly half of the convergence between India and Eurasia estimated by DeMets et al. (1994). Large earthquakes of magnitude >8 affect the MHT that have episodically ruptured segments several hundred kilometres long. This seismic cycle is presently evidenced by numerous studies (Molnar 1987; Bilham et al. 1995; Gahalaut & Chander 1997; Avouac et al. 2001), and historical seismicity underlines the existence of a major seismic gap between the 1905 Kangra and the 1934 Bihar, Nepal earthquake areas (Fig. 1) in western Nepal. No major earthquake has been clearly recorded in this area over the past three centuries, and possibly since the 1255 event, which might be the last
1
GJI Geodesy, potential field and applied geophysics
March 25, 2004
March 25, 2004
2
22:52
Geophysical Journal International
gji2180
F. Jouanne et al. 76˚E
78˚E
82˚E
84˚E
M
86˚E
88˚E
90˚E
92˚E
Crustal seismicity recorded in Nepal (Ml>2.5) depth < 25 km depth > 25km
32˚
TIBET
SZ
32˚
80˚E
FT 30˚
30˚
MB
Ga
28˚
28˚
T
ng
MCT
aP
MFT
MFT
lai
INDIA
SZ
TKL
MCT
n 26˚
26˚
76˚E
78˚E
80˚E
82˚E
84˚E
86˚E
88˚E
90˚E
92˚E
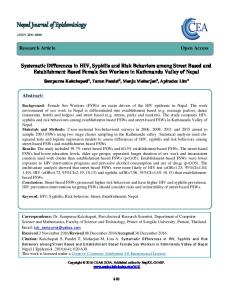
Figure 1. Historical and instrumental seismicity in the Himalayas of Nepal. The ruptures of the Himalayan earthquakes, located by their rupture area (grey boxes) are interpreted as the activation of the main Himalayan thrust (MHT) during M ca 8 seismic events. From west to east, 1905 Kangra and 1934 Bihar, Nepal are represented. Medium size earthquakes in the Himalayas, located at a mid-crustal level (between 10 and 20 km), indicate the probable activation of roughly E–W thrust planes gently dipping to the north as shown by theirs focal mechanisms. The intense microseismicity drawn with small grey circles, tend to cluster south of the Higher Himalayas (Pandey et al. 1995, 1999) all along the Himalayas of Nepal at a mid-crustal level.
major rupture in this part of Nepal (Bilham et al. 1995). It is therefore important to test whether the whole deformation is locked in the external belt of western Nepal, or whether an aseismic deformation would decrease the amount of deformation release through very large earthquakes. To estimate the strain accumulation in Nepal and especially in its western part, a dense GPS network was installed in 1995 in the framework of the IDYLHIM project granted by the Centre National de la Recherche Scientifique, France. This network has been installed by his Majesty’s Government of Nepal Seismological Laboratory (Kathmandu)—the Laboratoire de G´eodynamique des Chaˆınes Alpines and the laboratoire de G´eophysique Interne et Tectonophysique. Common benchmarks and simultaneous observations link it with the networks installed by the Laboratoire de D´etection G´eophysique (LDG), France and CIRES, Boulder University, USA. One geodetic solution combining the 1995, 1997, 1998 and 2000 measurements is presented here. This solution updates the previous solutions based on less numerous data (Bilham et al. 1997; Larson et al. 1999; Jouanne et al. 1999). It gives a better estimation of the present-day India/Eurasia convergence rate and furnishes a spatial and temporal distribution of deformation during an interseismic period of activity of the external part of the main Himalayan thrust. This deformation pattern is used to discuss the amount of deformation that occurs and could be elastically released during major earthquake events.
R E G I O N A L B A C KG R O U N D Structural and neotectonic pattern of Nepal The main structures of Nepal consist of several north-dipping thrust faults (Ganser 1964), and the more important ones are the main frontal thrust (MFT), the main boundary thrust (MBT) and the main central thrust (MCT) (MFT, MBT, MCT on Figs 2 and 3). They trend generally 120◦ N in western Nepal to 90◦ N in the eastern part of the country (Upreti & Le Fort 1999). These thrust faults, with generally N–S transport direction (Brunel 1986; Pˆecher 1991; Mugnier et al. 1999), are inferred to branch off the major basal detachment of the Himalayan thrust belt (hereafter called the main Himalayan thrust: MHT) that localizes the underthrusting of the Indian lithosphere beneath the Himalayas and Tibet. If the thrusts are generally increasingly younger from north to south (24–21 Ma for the MCT, less than 2 Ma for the MFT), out-of-sequence processes exist, as shown by the occurrence of displacement along the MCT 5.5 Ma ago (Hodges et al. 1996; Harrison et al. 1997) and the observation of cross-cutting relationships between ramps and earlier flat d´ecollement (De Celles et al. 1998; Mugnier et al. 1998) in the Lesser Himalayas of western Nepal. Quaternary displacement took place mainly along the frontal thrusts where the convergence rate deduced from the uplift of � C
2004 RAS, GJI, 157, 1–14
March 25, 2004
22:52
Geophysical Journal International
gji2180
Current shortening across the Himalayas
80˚E
81˚E
82˚E
30˚N
83˚E
84˚E
85˚E
86˚E
87˚E
88˚E
89˚E
29˚N MAH0
n rab e DLP0
Ba
GUT0
TSKA0
SKT0 SPS2
ng
ri G
ad
MUL0
NPJ0 BBP0 KUS0 AMP0
Ga
28˚N
JML0
SHP0
MF
CHP0
ap
MB
Fa u
T
BMT0
KRN2
lai
BRW0
n
27˚N
TIBET
la G
SHB0 DAD2
k ho
T
CT M
MB
lt
29˚N
JOM0
MC
T SYA0
POK0
28˚N
RAM0 KKN0 GMB0 BAL0 NAGA DMN0 PKI0
TAN0
MF
T
HET0
MC
T
NIJ0
MF
INDIA
27˚N
T
26˚N 80˚E
81˚E
82˚E
90˚E 31˚N
30˚N
SMK0
Tha k
31˚N
3
83˚E
84˚E
85˚E
86˚E
87˚E
88˚E
89˚E
26˚N 90˚E
Figure 2. Structural scheme of the Himalayas of Nepal and location of GPS points.
Holocene terraces is of the order of 21.5 ± 2.5 mm yr−1 in central Nepal (Lav´e & Avouac 2000) and 19 ± 6 mm yr−1 (Mugnier et al. 2003) in western Nepal. The observations of Quaternary metric displacement in the frontal thrust belt indicate that the coseismic displacement episodically reaches the surface (Delcaillau 1992; Nakata et al. 1998). The consistency of the long-term contraction rates across the frontal part of the Himalayan thrust system, and the aseismic slip rate simulated below the Higher Himalayas, suggests that detachment slip efficiently accommodates most of the contraction and that most of this slip occurs through discrete seismic events (Lav´e & Avouac 2000; Mugnier et al. 2003). Nonetheless other Quaternary motions observed in Nepal are: (i) Reactivation of the MBT in western Nepal where right-lateral and north-downward motion has been described (Nakata 1989). (ii) Tectonics along the Bari Gad fault (Fig. 2) (Nakata 1989; Yeats & Lillie 1991) affected by right-lateral motion or extension depending on the orientation of the segment of the fault. (iii) Moderate E–W extension with a left-lateral component, less than 1 mm yr−1 (Fort et al. 1982) across the Thakkhola half-graben located north of the Higher Himalayas in southern Tibet at the boundary between western and central Nepal (Fig. 2).
Seismicity Present-day deformation of the Himalayas is characterized by big earthquakes. Three of these earthquakes (1905, 1934 and 1950) with magnitude around 8 are due to the underthrusting of India under Himalayas (Molnar 1987; Molnar & Pandey 1989) and have ruptured nearly half of the chain in the past 100 yr. For Nepal, historical seismicity is mainly deduced from major damage in the Kathmandu valley, and indicates major earthquakes in 1255, 1408, 1681, 1810, � C
2004 RAS, GJI, 157, 1–14
1833 and 1866. The 1934 Bihar, Nepal earthquake, that ruptured a 100–300 km long part of the Himalayan arc (Molnar & Pandey 1989), seems to be the recurrence of some of these events (Bilham et al. 1995), whereas the 1803, 1833 and 1866 events could be related to the rupture of a segment west of Kathmandu in central Nepal (Bilham 1995). A 500–800 km seismic gap (Fig. 1), between 77◦ N and 84◦ N (Bilham et al. 1995) has not clearly experienced a great earthquake for more than two centuries (reliable British historical seismicity) and perhaps since the huge 1255 earthquake. In this hypothesis, and assuming a constant convergence rate of 20 mm yr−1 , the maximum slip deficit in the seismic gap may be estimated to be 15 m, which may cause one or several magnitude >8 earthquakes. Intermediate magnitude (5–7) events have been recorded in the Himalayan-Tibet area. The focal mechanisms indicate the occurrence of shallow (10–20 km) earthquakes beneath the Lesser Himalayas with focal solutions interpreted as the activation of thrust planes gently dipping to the north (Ni & Barazangi 1984; CMT solutions on Fig. 1 from Singh 2000). A detailed study has been performed for one of these earthquakes. The M 6.6 Uttarkashi earthquake, west of Nepal, in India has been studied in detail by Cotton et al. (1996), and could exemplify these type of events. It indicated that the seismic event had been initiated at a depth of 12 ± 3 km south of the Great Himalayas along a surface dipping 11◦ towards the North and was characterized by a southward propagation of the rupture along a 20–25 km segment of the MHT. The rupture stopped close to the bottom of a crustal ramp inferred in this area by Srivastava & Mitra (1994). An intense microseismicity and frequent medium size earthquakes tend to cluster south of the Higher Himalayas (Pandey et al. 1995, 1999) all along the Himalayas of Nepal (Fig. 1) at a mid-crustal level (between 10 and 20 km). A detailed study of these microseismic clusters suggests a segmentation of the Himalayan arc (Pandey
March 25, 2004
4
22:52
Geophysical Journal International
gji2180
F. Jouanne et al.
CENTRAL NEPAL
MBT
Lesser Himalaya
higher Himalaya Tibet
MCT
MDT
MFT
A
sub Himalaya
STD
Indian Gangetic plain
A' 10
5
5
0 km
0 km
-5
-5
-10
-10
-15
-15 -20 -25 -30
MOHO
STD
MBT
B 5
MCT
WESTERN NEPAL B' 5
MFT
0 km
0 km
-5
-5
-10
-10 -15
MOHO
0
100 km
Figure 3. Cross-sections and projection of the microseismic activity. The area of maximum microseismic activity is interpreted as the result of a stress build-up consequence of a lateral evolution of the displacement along the MHT from a 2 cm yr−1 north of this cluster to an almost nul value south of it.
et al. 1999) and two major discontinuities segment the microseismicity belt at 82.5◦ E and 86.5◦ E. In western Nepal (between longitudes 80.5 ◦ E and 82.5◦ E) a cluster is oriented ca 118◦ NE, in central Nepal (between 82.5◦ E and 86.5◦ E) it is orientated ca 108◦ NE, and in eastern Nepal (between 86.5◦ E and 88.5◦ E) ca 95◦ NE. The projection along cross sections of the microseismic events (Fig. 3) reveals a noticeable change in shape of the clusters between central and western Nepal (Pandey et al. 1999): at the longitude of Katmandu (central Nepal) the cluster has a rounded form and is located in the vicinity of the flat-ramp transition of the MHT; in western Nepal the cluster is elongated and nearly horizontal. These clusters are interpreted to reflect stress building in the interseismic period, during which the d´ecollement beneath the Lesser Himalayas probably remains locked (Pandey et al. 1995; Bilham et al. 1997; Cattin & Avouac 2000) with aseismic creep being located beneath the Higher Himalayas. It may thus be inferred that these clusters following the southern boundary of the Higher Himalayas of Nepal, mark the tip of the aseismic slip zone beneath the Higher Himalayas and southern Tibet, and that the transition from the aseismic creep dislocation zone to the locked zone does not occur in the same context in central and western Nepal: in central Nepal this transition corresponds to the lower part of a ramp, close to a flat-ramp connection of the MHT; while in western Nepal it is located along a gently dipping segment of the MHT.
G E O D E T I C A N A LY S I S A N D R E S U L T S Network set-up Networks were installed in Nepal in 1991, 1992, 1995, 1997, 1998 and 2000 by several French (LDG and CNRS) and American (Colorado University) Institutions in collaboration with His Majesty’s Government of Nepal. The Colorado University network, measured for the first time in 1991, covered Nepal with points located from the Higher Himalayas to the Himalayan foreland (Bilham et al. 1997). The LDG network (1995, 1998, 2000) is focused on the deformation at the longitude of Katmandu and the IDYLHIM network (1995, 1997, 1998, 2000) is designed to study the possible central Nepal/western Nepal segmentation and to evaluate the slip deficit in the seismic gap between the 1934 Bihar, Nepal earthquake and the 1905 Kangra earthquake. The IDYLHIM network presents a dense arrangement of observation points in the Siwaliks of the outer Himalayas, designed to test the existence of possible aseismic creep along the frontal set of Quaternary thrusts, as inferred in central Nepal from spirit levelling comparisons (Jackson & Bilham 1994). These various surveys are connected by common benchmarks and by simultaneous observations in 1995, 1997, 1998 and 2000. In this study, the deformation field has been estimated using the available � C
2004 RAS, GJI, 157, 1–14
March 25, 2004
22:52
Geophysical Journal International
gji2180
Current shortening across the Himalayas
5
Table 1. Summarizes the observation at the GPS sites and indicates the date of observations, the number of sessions per point and the time span of the observation sessions. Station
Network
Latitude deg
Longitude deg
Campaign number
AMP0 BAL0 BBP0 BMT0 BRW0 CHI0 CHP0 DAD2 DDLO DLP0 DMN0 GMB0 GUT0 HET0 JML0 JOM0 KKN0 KRN2 KUS0 MAH0 MUL0 NAGA NIJ0 NPJ0 PKI0 PKR0 POK0 RAM0 SHP0 SKA0 SKT0 SMK0 SPS2 SYA0 TAN0
IDYLHIM LDG IDYLHIM IDYLHIM CIRES+IDYLHIM IDYLHIM IDYLHIM IDYLHIM IDYLHIM IDYLHIM IDYLHIM LDG IDYLHIM LDG IDYLHIM CIRES+IDYLHIM LDG IDYLHIM IDYLHIM CIRES+IDYLHIM IDYLHIM CIRES LDG CIRES+IDYLHIM LDG IDYLHIM CIRES+IDYLHIM LDG IDYLHIM IDYLHIM CIRES+IDYLHIM CIRES+IDYLHIM IDYLHIM LDG CIRES+IDYLHIM
28.030 27.745 28.196 27.786 27.507 28.641 27.951 29.334 29.534 28.983 27.608 27.896 28.824 27.316 29.277 28.781 27.800 27.543 28.010 28.963 28.249 27.693 27.183 28.134 27.575 28.199 28.199 28.199 29.527 28.583 28.586 29.967 28.407 28.171 27.874
82.247 85.794 82.094 82.540 83.418 81.316 82.504 80.601 80.775 82.818 85.108 85.895 81.353 85.008 82.191 83.718 85.279 82.788 82.095 80.148 82.347 85.521 85.187 81.575 85.398 83.978 83.978 83.978 80.721 81.634 81.635 81.826 81.691 85.329 83.554
3 2 2 3 2 2 3 2 2 3 3 2 2 3 2 2 3 2 2 3 3 3 2 4 3 3 3 3 4 3 3 3 3 3 3
1995–2000 CIRES data, and the LDG and CNRS (IDYLHIM, IT and PNRN programs) observations. Data acquisition Table 1 summarizes the observation duration at the GPS sites and indicates the date of observations, the number of sessions per point and the time span of the observation sessions. In 1995, both 12 hr and 24 hr sessions were conducted. In 1997, 1998 and 2000, 24 hr sessions were systematically conducted. The points were generally observed for three sessions. The measurements in 1995, 1997, 1998 and 2000 (IDYL and LDG networks) were taken with Ashtech dualfrequency receivers. In 1995, both codeless and z-code receivers were used, whereas z-code receivers were systematically used in 1997, 1998 and 2000. Choke-ring antennas have been used since 1997. GPS data analysis Data were analysed with the Bernese V4.2 software (Beutler et al. 2001) in the ITRF97 reference frame using precise orbits (Boucher et al. 1999), earth rotation parameters and data from IGS stations (Table 2). The antenna phase-centre offsets and the influence of elevation on phase-centre variations were corrected using the IGS antenna phase-centre table. The troposphere-induced propagation � C
2004 RAS, GJI, 157, 1–14
1995 2 1 3 3 2 3 2
3 5 2 3 2 3 12 4
1997
4
3
1998
2000
4 3 4 1 4 3 2 3 3 3 2 2 4 2 3 2 10 3
4
3 3 33 2 6 4 1 3 1 1
8
3 3
15
3 14 9 4 3
2 2
4 4 13 3 6 11 2 9 2 3 19 14 4 3 2 4
4 6
5 3 2
3
16 6 4 11 8 5 12 2 3 5 4 10 3 3 3 4
delays were estimated from the observations, with troposphere parameters being estimated every 2 hr. Analysis of 1995 data The 1995 data set formed by CIRES, LDG and IDYLHIM data (Table 1) and IGS station measurements (LHAS, KIT3, TAIW, SHAO, IRKT, IISC, POL2) were analysed according to the following strategy: an ionosphere-free analysis without ambiguity resolution in order to assess residual; a quasi-ionosphere-free resolution strategy (Beutler et al. 2001) allowing all data to be mixed in a single run with or without code measurement. Troposphere parameters were estimated with observations being weighted as a function of satellite elevation. The mean repeatability of these observations for 1995 is 2.5 mm, 3 mm and 20 mm for the north, east and vertical components respectively. The increase in repeatability versus baseline length (0.7 ppb for the north and 0.9 ppb for the east component) indicates that both orbits, considered as fixed, and the reference frame are well defined. Analysis of 1997, 1998 and 2000 data The 1997, 1998 and 2000 data sets (Table 1) were analysed with IGS station data (1997: BAHR IISC, IRKT, KIT3, LHAS, POL2, TAIW, SHAO, WUHN, XIAN; 1998: BAHR, IISC, IRKT, KIT3, LHAS, POL2, SHAO, XIAN, WUHN; 2000: BAHR, LHAS, IISC, IRKT,
March 25, 2004
6
22:52
Geophysical Journal International
gji2180
F. Jouanne et al.
Table 2. Velocities and associated 1σ uncertainties derived from the 1995, 1997, 1998 and 2000 observations expressed in the Eurasia fixed velocities of BOR1, BRUS, JOZE, KOSG, METS, ONSA, IRKT, POTS, WTZR, ZIMM, ZWEN set to zero and velocities of KIT3 and POL2 set to 2 mm yr−1 N and 0.5 mm yr−1 E), and in the India fixed reference frame defined by the minimization of the displacements of IISC in India, BRW0, KRN2, MAH0, NIJ0, NPJ0 points located in the Ganga Plain in Nepal (the motion of India relative to Eurasia has been described, in our analysis, by the pole, latitude 28.5◦ N, longitude 22.1◦ E, rotation 0.4◦ Myr−1 ). Eurasia Fixed
India fixed
GPS points
latitude deg
longitude deg
Campaign number
North
σ north
East
σ east
North
AMP0 BAHR BAL0 BBP0 BMT0 BRW0 CHP0 DAD2 DDL0 DLP0 DMN0 GMB0 GUT0 HET0 IISC JML0 JOM0 KKN0 KRN2 KUS0 LHASA MAH0 MUL0 NAGA NIJ0 NPJ0 PKI0 PKR0 POK0 RAM0 SHAO SHB0 SHP0 SKA0 SKT0 SMK0 SPS2 SYA0 TAEJ TAIWAN TAN0 WUHN XIAN
28.03 26.21 27.745 28.196 27.786 27.507 27.951 29.334 29.534 28.983 27.608 27.896 28.824 27.316 13.021 29.277 28.781 27.8 27.543 28.01 29.657 28.963 28.249 27.693 27.183 28.134 27.575 28.199 28.199 28.015 31.1 29.527 29.012 28.583 28.586 29.967 28.407 28.171 62.03 25.021 27.874 30.53 34.37
82.247 50.61 85.794 82.094 82.54 83.418 82.504 80.601 80.775 82.818 85.108 85.895 81.353 85.008 77.57 82.191 83.718 85.279 82.788 82.095 91.104 80.148 82.347 85.521 85.187 81.575 85.398 83.978 83.978 85.222 121.2 80.721 80.636 81.634 81.635 81.826 81.691 85.329 127.37 121.537 83.554 114.3 109.22
3 3 2 2 3 2 3 2 2 3 3 2 2 3 4 2 2 3 2 2 4 3 3 3 2 4 3 2 3 3 4 4 3 3 3 3 3 3 2 2 3 3 2
33.63 20.31 30.85 34.77 34.47 30.79 35.45 28.67 30.51 21.43 32.74 29.97 33.66 34.04 31.65 26 23.67 33.43 34.14 30.71 16.01 33.21 34.28 31.78 38.68 33.4 34.33 30.79 34.56 27.29 −5.37 27.51 34.67 30.89 30.52 21.75 33.94 26.96 −3.2 −5.43 35.1 −4.66 −7.33
0.78 0.36 2.28 1.6 0.68 1.7 1.94 1.96 2.26 1.3 0.64 2.26 1.56 0.98 0.38 1.8 1.7 0.58 2.96 1.02 0.24 0.86 1.58 0.34 1.96 0.42 0.56 1.2 0.76 0.56 0.3 0.52 0.86 0.44 0.48 1.18 0.98 0.8 2.18 1 0.78 0.5 1.82
9.55 3.29 8.41 14.19 9.47 10.51 10.9 7.67 7.37 7.75 9.29 8.2 9.68 9.65 16.87 9.89 9.08 10.13 7.65 7.23 19.34 9.84 9.08 10.52 9.71 10.09 10.65 12.89 10.12 12.59 11.71 8.79 9.67 6.49 9.42 9.37 10.1 11.37 8.71 18.64 10.22 11.02 9.18
0.8 0.52 2.32 1.54 0.7 1.54 1.98 1.76 2.02 1.2 0.64 2.14 1.5 1.18 0.38 1.68 1.56 0.58 2.6 1.4 0.22 0.76 1.74 0.32 2.1 0.38 0.6 1.08 0.86 0.54 0.4 0.48 0.76 0.4 0.46 1.1 0.88 0.78 1.98 1.22 0.78 0.58 2.08
−0.26 1.49 −4.46 2.32 0.35 −3.10 1.68 −4.57 −2.96 −12.11 −2.27 −5.35 0.25 −0.98 0.04 −6.99 −9.98 −1.45 −0.50 −3.49 −12.55 0.37 0.21 −2.94 3.24 −0.05 −0.55 −2.42 0.11 −6.07 −27.33 −5.37 1.50 −3.23 −2.87 −10.80 0.44 −6.86 −29.43 −21.68 0.76 −28.30 −28.21
KIT3, POL2, SHAO, WUHN) with resolution of carrier-phase ambiguities using: an ionosphere-free analysis without ambiguity resolution in order to assess residuals; Wuebbena–Melbourne ambiguity resolution (W¨ubbena 1985; Melbourne 1985); and resolution of ambiguities using the ionosphere-free combination introducing the solved Wuebbena–Melbourne ambiguities. The mean repeatability of these observations, for the north, east and vertical components respectively, is: 1.8, 4 and 10 mm in 1997; 1.5, 1.8 and 6 mm in 1998; and 0.9, 2.2 and 6.7 mm in 2000. The orbits, considered to be fixed, and the reference frame are well defined as shown by the relation between repeatability and baseline length for the north and east components respectively: 2 and 10 ppb in 1997; 0.04 and 0.01 ppb in 1998; and, 4 and −2 ppb in 2000.
σ north 1.18 1 2.44 1.8 1.1 1.9 2.12 2.16 2.42 1.38 1.08 2.42 1.78 1.32 1.02 1.96 1.9 1.06 3.1 1.34 0.9 1.22 1.8 0.94 2.14 0.98 1.04 1.5 1.16 0.86 0.88 1 1.24 1 1 1.44 1.32 1.18 2.32 1.32 1.18 0.98 2.02
East
σ east
−0.07 0.31 −1.37 0.65 0.10 −0.92 0.48 −1.17 −0.75 −3.30 −0.69 −1.63 0.07 −0.30 0.02 −1.85 −2.80 −0.44 −0.15 −0.98 −3.96 0.10 0.06 −0.90 1.00 −0.01 −0.17 −0.70 0.03 −1.82 −15.13 −1.36 0.39 −0.88 −0.78 −2.73 0.12 −2.04 −14.86 −12.34 0.22 −13.80 −11.86
1.12 1.14 2.46 1.74 1.06 1.72 2.12 1.92 2.16 1.26 1.04 2.3 1.68 1.44 0.88 1.82 1.74 1 2.72 1.6 0.86 1.1 1.92 0.88 2.24 0.88 1 1.36 1.18 0.78 1.22 0.9 1.1 0.9 0.92 1.34 1.18 1.12 2.34 1.68 1.12 1.2 2.3
For each campaign, one normal equation and its weighting coefficient were obtained by combining the daily normal equations and the overall weekly solutions obtained from CODE (Center Orbit Determination Europe). To test the hypothesis of displacement linearity through time, time series illustrating baseline variations have been plotted (examples are given on Fig. 4). The analysis of time series does not allow demonstration of non-linearity of displacements. The misfit locally evidenced between the linear interpolation is not meaningful because a colourated noise, revealed in the continuous GPS stations time series (Mao et al. 1999), has to be considered. We have not performed vertical velocity estimation, because different models of antenna have been used and repeatabilities of vertical component � C
2004 RAS, GJI, 157, 1–14
March 25, 2004
22:52
Geophysical Journal International
gji2180
Current shortening across the Himalayas Lhasa - NpJ0
Mah0/Shb0 ar
0.02 0
m 2m
.
21 Nov 95
Nov 97
Nov 98
Nov 2000
-0.02 -0.04 -0.06 -0.08
0.004 0.002 0 Nov 95 -0.002
Nov 98
-4
mm
Nov 2000
ye
ar −
-0.004
1
0 Nov 97
Nov 98
Nov 2000
6.8
-0.005 -0.01
mm
ye
ar −1
-3
.7
0.012 0.01
0.006 0.004 0.002 0 Nov 95 -0.002
ye
ar −
1
0.006
0.006
East component
0.004
−1
0.002 0
0.6 mm year Nov 95
Nov 98
-0.004 -0.006 -0.008
Nov 98
-0.002 -0.004
0.002
0.04
Nov 2000
Nov 97
0.004
-0.006 Nov 97
Nov 98
Nov 2000
-0.008
Lhasa-Shb0
2.4 North component mm /ye ar Nov 97
mm
0.008
0.05
Baseline variation in meter
0.008
Nov 98
0.008
East component
0.014
Pok0 / Brw0 0.01
Nov 97
-0.003
0 Nov 95
-0.02
Nov 95 0
-0.002
Ram0-Het0 0.02
North component r−
0.03 0.02
.4 m
Nov 95
1
13
0.01 0
ea my
Nov 97
Nov 98
Nov 2000
-0.01 -0.02
Baseline variation in meter
Nov 95
0.001
-0.001
Baseline variation in meter
0,005
Baseline variation in meter
0.01
0.002
-0.008
0.016
East component
North component
0.003
-0.006
0.018
0.015
-0.015
Baseline variation in meter
Nov 97
0.004
-0.01
0.02
Baseline variation in meter
North component
0.006
ye
smk0/dlp0 Baseline variation in meter
−1
North component
0.04
0.008
Baseline variation in meter
Baseline variation in meter
0.06
7
0.015
North component
0.01 0.005 0
Nov 95
Nov 97
Nov 98
− ear my m 6.6
1
Nov 2000
-0.005 -0.01 -0,015
-0.03
-0.02
-0.04
-0.025
-0.01
0.025
0.03
0.02
0.01 0.005 0 -0.005Nov 95
7m m/
yea r Nov 97
Nov 98
-0.01
Nov 2000
East component
0.02 0.01 0 Nov 95
Nov 97
-0.01
-0.015 -0.02 -0.025
-0.02
Nov 98
Nov 2000
-9.
5m
m
ye
ar −1
East component
0.015
Baseline variation in meter
East component
Baseline variation in meter
Baseline variation in meter
0.02 0.015
0.01
-3.2
0.005 0
Nov 95
mm
yea −1 r
Nov 97
Nov 98
Nov 2000
-0.005 -0.01 -0.015
-0.03
Figure 4. Examples of time series for points measured three or four times. Errors bars are drawn for a 1σ confidence level. As shown on these figures, baselines variations at different scales from long baselines (Lhasa-Npj0 or Lhasa-Shb0) to short baselines (Pok0-Brw0, Smk0-Dlp0) seem to occur at constant rates for the horizontal component.
(from 20 mm in 1995 to 6.7 mm in 2000) do not allow an accurate determination of vertical displacements. Velocities were then obtained from the weighted combination of campaign normal equations (1995, 1997, 1998 and 2000), assuming linear displacements. A weight of 0.0022, derived from Bernese analysis, has been adopted for the less accurate 1995 campaign, whereas a weight of 0.0018 has been adopted for the 1997, 1998 and 2000 campaigns.
(Figs 5a and b) as suggested by Kogan et al. (2000). To obtain a more readable velocity map in the Nepal area, characterized by important displacements and high-displacement gradients, vectors were also expressed in the India fixed reference frame (Fig. 6). This reference frame, has been defined by the determination of the rotation pole Eurasia/India (latitude: 28.5◦ N, longitude: 22.1◦ E, rotation: 0.4◦ Myr−1 ) that accounts for the displacements of IISC (Southern India), BRW0, KRN2, MAH0, NIJ0 and NPJ0 in the Ganga plain, in the Eurasia fixed reference frame.
Estimated velocities A natural reference frame for the India–Eurasia collision zone is the Eurasia fixed reference. It is defined by minimizing the velocities of stations located in stable Asia and Europe using a six-parameters Helmert transformation (three translation and three rotation parameters): the velocities of BOR1, BRUS, JOZE, KOSG, METS, ONSA, IRKT, POTS, WTZR, ZIMM (present in 1995, 1997, 1998 and 2000 combined solutions), ZWEN (present in 1998–2000 solutions) were minimized and the velocities of KIT3 and POL2 (present in 1995, 1997, 1998 and 2000) located in the Kazakh platform (Abdrakhmatov et al. 1996) were adjusted to 2 mm yr−1 N and 0.5 mm yr−1 E � C
2004 RAS, GJI, 157, 1–14
SISMOTECTONIC AND TECTONIC I N T E R P R E T AT I O N India/Eurasia motion Points located on the Indian lithosphere, south of the Himalayas, have geodetic displacements significantly lower than Nuvel 1A NNR predictions (Argus & Gordon 1991; DeMets et al. 1994) (Table 2 and Figs 5a and b). For example the estimated motion of Bangalore (IISC) is 36 mm yr−1 directed 28◦ NE (i.e. significantly slower than the 47 mm yr−1 Nuvel 1A NNR prediction directed 24◦ NE), but is
March 25, 2004
8
22:52
Geophysical Journal International
gji2180
F. Jouanne et al.
60E
80E
100E
120E
IRKT
POL2 KIT3
40N
40N
TAEJ
XIAN
SHAO LHASA
BAHR
20N
TAIW
20N
95% confidence ellipse
30 mm year−1
60E 80E
82E
IISC
80E
100E
84E
86E
120E 88E
90E
TIBET
30N
30N
28N
28N 95% confidence ellipse
30 mm
year−1
GAN
GA
INDIA
PLA
IN
26N
26N 80E
82E
84E
86E
88E
90E
Figure 5. Velocities drawn in the stable Eurasia reference. (a) Selected velocities of Nepal network frame (only five points are drawn to make the figure readable)and selected continuous GPS stations in the Eurasia fixed reference frame. This reference frame has been defined as follows: the velocities of BOR1, BRUS, JOZE, KOSG, METS, ONSA, IRKT, POTS, WTZR, ZIMM, ZWEN were minimized and the velocities of KIT3 and POL2 located in the Kazakh platform (Abdrakhmatov et al. 1997) were adjusted to 2 mm yr−1 N and 0.5 mm yr−1 E. (b) Velocities of the 34 sites of the LDG-IDYLHIM network in the Eurasia fixed reference frame.
in accordance with the 37 mm yr−1 value directed 22◦ NE GPS proposed by Paul et al. (2001). The current displacement of Bangalore is consistent with the displacement predicted using the revised plate reconstruction proposed by Gordon et al. (1999) (37 mm yr−1 with a 38◦ NE azimuth). This discrepancy with the plate reconstruction model, already reported by several authors (Chen et al. 2000; Shen et al. 2000; Paul et al. 2001; Wang et al. 2001), may have different origins: difficul-
ties in establishing the geological plate circuit (mainly in the Nuvel 1 A model) in a model using seafloor spreading rates, transformfault strikes and focal mechanisms; or, the existence of present-day shortening of the oceanic lithosphere, south of the nearly stable Indian continental lithosphere (Paul et al. 2001). In other words, the missing shortening might be absorbed through the oceanic domain located between the stable Indian margin and the oceanic ridges that limit the Indian plate. This hypothesis is also supported by � C
2004 RAS, GJI, 157, 1–14
March 25, 2004
22:52
Geophysical Journal International
gji2180
Current shortening across the Himalayas 80˚
81˚
82˚
83˚
84˚
85û
86˚
9
87˚
31˚
31˚
TIBET
M
30˚
30˚
SMK0
CT
SHB0 DDL0 DAD2
29˚
MAH0
JML0
SHP0
DLP0
MFT
GUT0
29˚
M
JOM0
CT
SKT0 SKA0 SPS2 BBP0MUL0
NPJ0
NEPAL
AMP0 KUS1 CHP0
28˚
POK0
TAN0
BMT0 KRN2
MBT
BRW0
MFT 10 mm year−1
SYA0 RAM0
28˚
GMB0 KKN0 BAL0 NAGA DMN0PKI0 HET0 NIJ0 0
M
CT
27˚
27˚
MFT
INDIA 26˚
26˚ 80˚
81˚
82˚
83˚
84˚
85˚
86˚
87˚
Figure 6. Velocities of the 34 sites of the LDG-IDYLHIM network in the India fixed reference frame. This reference frame, has been defined by the determination of the Eurasia/India rotation pole (latitude: 28.5◦ N, longitude: 22.1◦ E, rotation: 0.4◦ Myr−1 ). It allows to account for the displacements of IISC (southern India), BRW0, KRN2, MAH0, NIJ0 and NPJ0 in the Ganga plain, Eurasia being considered fixed.
significant seismicity in the oceanic domain of the Indian plate and the observed recent folding of the lithosphere (Curray & Munasinghe 1989). Active deformation of Himalayas From the velocities expressed in the India fixed reference frame (Fig. 6), a number of features can be highlighted: (i) Points located in the Ganga plain do not exhibit significant residual displacements. (ii) Points located on the first anticlines are also not affected by major motions; in view of this lack of displacement between these points and the benchmarks embedded in the Ganga plain, it may be inferred that there is an absence of major aseismic movements along the MHT that reaches the ground surface just south of these folds. (iii) A north–south velocity gradient is evidenced between the points located in the outer belt and those located in the Lesser Himalayas or in the Higher Himalayas. (iv) There is also no evidence of dextral strike-slip movement along the MBT in western Nepal (Nakata 1989); this feature appears to be of second order compared with the Himalayan convergence, as suggested by the displacement rate of 1 mm yr−1 (Nakata 1989). (v) There is no present-day extension along the Thakola graben, as shown by the lack of velocity difference between the points of Jomosson (JOM0) in the southern part of the east side of the Thakola graben, and the points of Dolpo (DLP0), and the overall E–W ex� C
2004 RAS, GJI, 157, 1–14
tension along the studied segment of the Himalayan chain is weak and diffuse. (vi) There is an E–W shortening in the Higher Himalayas north of Kathmandu (Fig. 7) which is compatible with the 1997 January 1 seismic event in this area. This Ml 5.6 seismic event has occurred, at 18 km depth, along a plane dipping 85◦ to the west with a 20 cm displacement of the hangingwall towards the east. The 1.7 cm horizontal component at the source does not probably induce a detectable horizontal displacement at the stations RAM0 and SYA0. Nonetheless, postseismic deformation, evidenced by the postseismic microseismicity lineament could affect the displacement of these two stations. This event is associated with an eastward displacement of the hangingwall whereas other fault plane solutions of M5–6 earthquakes indicate southward displacement of the hangingwall. This suggests a structural anomaly related with a lateral variation of the MHT geometry. Uniform strain rate tensors are calculated to show more clearly the strain location and shortening-axis variations (Fig. 8) through the Himalayan belt. Uncertainties in strain rates have been obtained using the following steps for a Monte Carlo simulation of errors: (i) Diagonalisation of variance–covariance matrix. (ii) Perturbation of velocity vectors in the basis formed by eigenvectors, where only the non-diagonal elements are non-nul, using random value with a normal distribution scaled to represent a 95 per cent confidence level.
March 25, 2004
10
22:52
Geophysical Journal International
gji2180
F. Jouanne et al.
Figure 7. Present-day deformation at the longitude of Kathmandu. Velocity field expressed by reference to the NIJ0 benchmark in the Ganga plain. Strain-rate tensors underline the existence of an E–W shortening north of Kathmandu, also expressed by a moderate earthquake indicating a coseismic E–W horizontal displacement.
(iii) Decomposition of perturbed vectors in N, E, up components. (iv) Estimation and drawing of perturbed strain rate tensors. The E–W extension that characterizes the southern Tibet area is evidenced on the single mesh of the network that belongs to this area (i.e. the SMK0-SHB0-JML0 triangle). The area that undergoes most of the current deformation is characterized by a strong shortening that exceeds 1. 10−7 yr−1 and locally reaches 3 · 10−7 yr−1 . It is surrounded to the north by the Higher Himalayas–southern Tibet area, and to the south by the outer belt of the Himalayas affected by a nearly negligible present-day deformation. This strain distribution suggests that it could be induced by displacement locking along the MHT below the Lesser Himalayas, around the microseismicity cluster. In this hypothesis, the Higher Himalayas are located above the northern part of the MHT affected by aseismic creep, the Lesser Himalayas undergo strain accumulation induced by displacement locking, and the Outer Himalayas, located above the locked part of the MHT, is characterized by a lack of any considerable instantaneous deformation. Fig. 8 also illustrates a spatial variation in the orientation of the shortening-axis between western and central Nepal, east of the 83◦ E meridian. In this area, there is both a change in orientation of microseismicity clusters and a change in shortening-axis directions. This could indicate a major change in the MHT geometry, as proposed by Larson et al. (1999).
Simulation of the present-day velocity field The hypothesis that Nepal experiences interseismic strain and stress accumulation, as revealed by the microseismicity distribution and geodetic velocity field, has been expressed by several authors
(Pandey et al. 1995, 1999; Bilham et al. 1997; Larson et al. 1999; Jouanne et al. 1999; Cattin et al. 2000). In this study, the existence of MHT segmentation is tested with a dislocation model using two dislocations extending down-dip from the bottom of the locked zone to a lower edge located at numerical infinity affected by a uniform aseismic creep, one for central Nepal and the other for western Nepal. It is assumed that the interseismic deformation is related to uniform aseismic creep (Okada 1985) on buried planar thrust-fault surfaces locked at their southern tips. These dislocations approximate ductile deformation of the lower crust around the MHT, and their tips correspond to a flat-ramp connection or a ductile–brittle transition. The strike of the dislocations is assumed to be parallel to the average structural direction (MBT, MFT, etc.) and to the direction of the microseismicity clusters i.e., close to 105◦ NE for central Nepal and 117◦ NE for western Nepal (Fig. 9). The microseismicity distribution and the horizontal velocity field are both used to define the limits of the dislocations: the simulated horizontal displacements must fit with the horizontal displacements measured by GPS, and the southern boundary of the dislocations must be located in the microseismicity clusters. We have performed a systematic search through space parameters to seek the best fitting set of parameters. We have considered constant orientations of the dislocations, well constrained by the trend of the microseismicity clusters assumed to reflect the stress build-up at the southern tip of the dislon (transition between creeping and absence of displacement along the MHT). The space parameters have been determined by: the displacement components (from 19–21 mm yr−1 for the thrust component to 0– 5 mm yr−1 for the dextral strike-slip component); the dip of the dislocations (from 9 to 12◦ ); the depths of the tip of the two dislocations (from 15 to 25 km); and the horizontal location of the tip of the dislocations (−10 to +10 km in the microseismicity cluster). To test all the possibilities described above, 30 262 runs have been performed. We have selected, as the most probable solutions, the five parameter sets characterized by the five lowest WRMS. The best solutions are dislocations with: a 9–10◦ dip for the two dislocations; a 19 mm yr−1 thrust component for western Nepal and a 19–20 mm yr−1 for the central Nepal; 0–1 mm yr−1 dextral strikeslip component for western Nepal and 0–2 mm yr−1 for central Nepal dislocation; and a locking depth around 20–21 km for western Nepal and 17–21 km for central Nepal. The existence of 2–3 mm yr−1 misfit obtained for points of the Siwaliks could suggest an aseismic creep localized in space. This hypothesis would suggest that aseismic creep evidenced from comparison of spirit levelling in the external part of Himalayas (Jackson & Bilham 1994; Gahalaut & Chander 1997) could be a very local phenomenon and does not give an accurate estimate of an aseismic component on the scale of the Himalayan belt. This two-dislocation model is close to the one proposed by Larson et al. (1999) in one aspect: the transition zone between the two dislocations is located around 84◦ E. Nonetheless clear differences are also observed concerning the position and strike of the tip line. The fit of our dislocation model to the data suggests that the width of the locked zone between the tip of the dislocation and the rupture surface along the MFT, is slightly greater in western Nepal than in eastern Nepal, whereas Larson et al. (1999) calculation suggests a width much greater in eastern Nepal than in western Nepal. For the western dislocation we use twice as many data as Larson et al. (1999) and therefore expect to have a more constrained solution. For the eastern dislocation, our solution is only valid for central Nepal, and does not apply to eastern Nepal. Furthermore, we are aware that the dislocation model is only a first order � C
2004 RAS, GJI, 157, 1–14
March 25, 2004
22:52
Geophysical Journal International
gji2180
Current shortening across the Himalayas
11
Figure 8. Strain-rate tensors computed from the velocity field. Tensors characterized by their eigenvalues and eigenvectors are drawn at the barycenter of triangles used for their computations. Errors in strain rates for a 95 per cent confidence level have been obtained using a Monte Carlo simulation of errors. Perturbed tensors simulating the errors for a 95 per cent confidence level, are drawn as grey bars around the unperturbed solutions. Strain-rate tensors show an area undergoing most of the current deformation that is surrounded to the north by the Higher Himalayas–southern Tibet area with an E–W extension, and to the south by the outer belt of the Himalayas affected by a nearly negligible present-day deformation. A spatial variation in the orientation of the shortening-axis between western and central Nepal, east of the 83◦ E meridian, illustrates the segmentation of the present-day deformation of Himalayas probably related to a segmentation of the MHT.
approach to the interseismic deformation (Vergne et al. 2001). This approach could induce artefacts and neglect any transition zone as inferred by Dragert et al. (1994). Since this approach used alone does not efficiently allow determination of the size of the locked zone, and because we have incorporated microseismologic data in our study, we believe that our model is more accurate than the previous one.
the brittle deformation and the ductile deformation zone, presumably, gradually locked the displacement. Furthermore intermediate magnitude earthquakes could occur along the part of the lower flat located in the brittle regime and stop against some ramp acting as a crustal asperity. The area, from east of the Dhaulaghiri mountain to the Thakkhola graben appears as a major transition:
Comparison between present-day deformation and neotectonics of the Himalayas
(i) In the high relief distribution (the >8000 m peaks are located east of 83◦ 30 ). (ii) In the microseismicity distribution. (iii) In the location of Quaternary faulting in the Lesser and Higher Himalayas. (iv) In the organisation of the drainage pattern (Van der Beek et al. 2003).
The good fit between measured and simulated velocity fields supports the hypothesis of two distinct dislocations representing two distinct segments of the ductile shear zones along which the Indian lithosphere is underthrusted beneath Tibet. A comparison with the structural cross-sections proposed through Nepal (Schelling & Arita 1991; De Celles et al. 1998; De Celles et al. 2001; Mugnier et al. 2003) and with the distribution of the microseismic events (Pandey et al. 1999), suggests that the locking line of the dislocation in central Nepal probably corresponds to a geometrical connection between a flat area and a ramp of the MHT, and that the locking line in western Nepal is located along the lower flat segment of the MHT. In the first case, stress accumulation is well localized. In western Nepal, stress concentration is less localized, and a transition zone between � C
2004 RAS, GJI, 157, 1–14
The current deformation pattern also suggests a transition zone between 83◦ and 85◦ , and has been modelled by a jump in the MHT geometry at 84◦ . The disagreements between the positions inferred from different data sets suggest a broad transition zone. It is suggested that the Darma–Bari Gad fault system and the Thakkhola graben roughly delineate (on a map) a crustal wedge (in map view) located at the transition between two different segments of the Himalayan detachment above the Indian crust. Around the Bari Gad dextral strike slip fault itself, between the JOM0, DLP0, MUL0 and TAN0 points, the adjustment between observed and simulated
March 25, 2004
12
22:52
Geophysical Journal International
gji2180
F. Jouanne et al. 80˚
81˚
82˚
83˚
84˚
85˚
86˚
87˚
88˚
89˚
90˚
31˚
31˚
30˚
30˚ Tibet
29˚
29˚
28˚
28˚ Nepal
10 mm year−1 observed displacement
27˚
27˚
simulated displacement
India
26˚
26˚ 80˚
81˚
82˚
83˚
84˚
85˚
86˚
87˚
88˚
89˚
90˚
Figure 9. Simulation of the velocity field using a dislocation model. Two dislocations corresponding to central and western Nepal are used in this interseismic displacement field simulation. Observed displacements drawn with their 95 per cent confidence level ellipses and simulated displacements are represented for each point of the network illustrating the good fit between observed and simulated vectors.
displacements underline that a significant displacement along this strike-slip fault is not required to explain the present-day displacements. The Bari Gad fault is then probably not affected by a significant displacement, compatible with the 1.2 mm yr−1 . quaternary strike-slip component proposed by Nakata (1989). Simulations also suggest a present-day oblique slip along the two dislocations (1–2 mm yr−1 dextral strike-slip component), in agreement with several observations: (i) Oblique convergence in the Himalayas and southern Tibet plateau (McCaffrey & Nabelek 1998). (ii) Displacement partitioning observed along the active Quaternary faults of the outer belt of western Nepal, i.e. dextral slip along the steep MBT, and long-term, 18 mm yr−1 , Holocene pure thrusting along the frontal active faults of the Siwaliks (Mugnier et al. 1999). The agreement of these long-term contraction rates across the frontal part of the Himalayan thrust system, and the aseismic slip rate simulated below the Higher Himalayas, suggests that detachment slip efficiently accommodates most of the contraction and that most of this slip occurs episodically (Mugnier et al. 2003).
C O N C LU S I O N The geodetic, geological and seismological data presented are used to understand the present-day deformation process of the Himalayan thrust wedge. In the outer belt, the MHT and its southernmost branch, the MFT, were active during Quaternary times. Historical seismicity indicates that this activity continues in this area, at least episodically, except in western Nepal where it may have been locked for the last 800 yr in a seismic gap. Beneath the Higher Himalayas and southern Tibet, the MHT accommodates convergence as creep. Between the outer belt and the Higher Himalayas, a midcrustal microseismicity belt runs parallel to the structural trend of the chain, from east to west. An interruption of the microseismicity
belt between meridian 84◦ and 82◦ 5 separates central Nepal, where the microseismicity clusters correspond to a crustal ramp on the MHT, from western Nepal, where earthquakes are distributed along a rather flat segment of this thrust surface. These two microseismicity clusters are interpreted as tip lines where the aseismic creep displacement on MHT surface is locked. This is believed to generate elastic strain in the Himalayan belt and attenuation of displacements towards the foreland. The present-day displacement field was measured by GPS networks from 1995 to 2000 and the updated solution presented in this paper indicates: (i) A 37 mm yr−1 (with a 38◦ N azimuth) displacement rate between India and Asia. (ii) A 21 mm yr−1 N–S rate of displacement and a 6.8 mm yr−1 E–W component between Tibet (Lhasa) and the Indian plate (NpJ0). (iii) A more than 13 · 10−8 yr−1 deformation-rate along the entire south border of the Higher Himalayan range. (iv) With an ca 30.10−8 yr−1 local shortening rate. (v) A less than 3.10−8 yr−1 deformation rate in the outer part of the Himalayan belt. The displacement field in Himalayas is satisfactorily simulated by a dual-dislocation elastic model involving thrust and strike-slip components. The thrust component is 19 mm yr−1 and the dextral strikeslip component 1–2 mm yr−1 . The misfit between the present-day displacement field above the locked zone and the dislocation model is generally not significant, suggesting that the aseismic component along the external zone of the MHT is negligible. If some current deformation occurs in the outer belt, it necessarily affects restricted zones of the detachment during the six years of the study. The agreement of the long-term contraction rates across the frontal part of the Himalayas and the aseismic slip rate simulated below the Higher Himalayas, suggests that most of the slip in the outer belt occurs through earthquakes, and supports the hypothesis of a serious slip deficit in western Nepal. The two-dislocation model suggests that the width of the locked zone between the MFT and the creeping � C
2004 RAS, GJI, 157, 1–14
March 25, 2004
22:52
Geophysical Journal International
gji2180
Current shortening across the Himalayas zone is of the same order, but rather greater, in western Nepal than in central Nepal. As the width of the locked zone gives an upper bound for the width of the rupture, it is suggested that earthquakes as great as, or greater than, those that affected central–eastern Nepal (i.e. ≥8.4 M from the 1934 Bihar earthquake) could affect western Nepal. AC K N OW L E D G M E N T S Idylhim is a French-Nepali project sponsored by CNRS-INSU (France) programs IDYL, IT and PNRN, and the Idylhim members are N. L. Chaudury, G. R. Chitrakar, A. Galy, U. P. Gautam, J. P. Glot, B. Kaffle, B. P. Koirala, P. Leturmy, R. Ranabhat, S. N. Sapkota, P. L. Shrestha, M. C. Thakury, U. R. Timilsina, U. R. Tiwari, G. Vidal and B. De Voogd. The authors gratefully acknowledge the availability of Himalayan GPS data acquired by the Nepal Survey Department, the University of Colorado at Boulder and the University of Alaska at Fairbanks, with support from the US National Science Foundation. The maps in this paper were generated using the public domain Generic Mapping Tools (GMT) software (Wessel & Smith 1998). REFERENCES Abdrakkhmatov, K.Y. et al., 1996. Relatively recent construction of the Tien Shan inferred from GPS measurements of present day crustal deformation rate, Nature, 384, 450–453. Avouac, J.-P., Bollinger, L., Lav´e J., Cattin R. & Flouzat M., 2001. Le cycle sismique en Himalaya, C. RAS. - Serie lia, Volume 333, Issue 9, 15 November 2001, pp. 513–552. Beutler, G. et al., 2001. Bernese GPS software version 4.2, eds Hugentobler, U., Schaer, S., Fridez, P., Astronomical Institute, University of Berne, Switzerland. Bilham, R., 1995. Location and magnitude of the 1833 Nepal earthquake and its relation to the rupture zones of contiguous great Himalayan earthquakes, Current Science, 69(2), 155–187. Bilham, R., Bodin, P. & Jackson, M., 1995. Entertaining a great earthquake in Western Nepal: Historic inactivity and development of strain, J. Nepal Geol. Soc., 11, 73–88. Bilham, R., Larson, K., Freymueller, J. & Idylhim members, 1997. GPS measurements of present-day convergence across the Nepal Himalaya, Nature, 386, 1–94. CMT, Harvard Centroid Moment Tensor database, 1998. Boucher, C., Altamimi, Z. & Sillard, P., 1999. The 1997 International Terrestrial Reference Frame (ITRF97), IERS Technical Note 27, Central Bureau of IERS-Observatoire de Paris, Paris. Cattin, R. & Avouac, J.P., 2000. Modeling mountain building and the seismic cycle in the Himalaya of Nepal, J. G. R., Solid Earth, 105, 6, 13,389– 13,407. Chen, Z. et al., 2000. GPS measurements from eastern Tibet and theirs implications for India/Eurasia intercontinental deformation, J. geophys. Res., 105, 16 215–16 227. Cotton, F., Campillo, M., Deschamps, A. & Rastogo, B., 1996. Rupture history and seismotectonics of the 1991 Uttarkashi, Himalayas earthquake, Tectonophysics, 258, 35–51. Curray, J.R. & Munasinghe, T., 1989. Timing of intraplate deformation, northeastern India Ocean, Earth planet. Sci. Lett., 94, 71–77. Delcaillau, B., 1992. Les Siwalik de l’Himalaya du Nepal oriental, in, ´ M´emoire et Documents de G´eographie, p. 205, Editions du CNRS, France. De Celles, P.G., Gehrels G.E., Quade J., Ojha, T.P. & Kapp, P.A., 1998. Neogene foreland basin deposits, erosional unroofing and the cinematic history of the Himalayan fold-thrust belt, Western Nepal, Geol. Soc. Bulletin, 110, 2–21. De Celles, P., Robinson, D., Quade, J., Ojha, T.P., Garzione C., Copeland, P. & Upreti B.N., 2001. Stratigraphy, structure, and tectonic evolution of the Himalayan fold-thrust belt in western Nepal, Tectonics, 20, 487–509. � C
2004 RAS, GJI, 157, 1–14
13
DeMets, C., Gordon, R.G., Argus D.F & Stein S., 1994. Effect of recent revisions to the geomagnetic reversal time scale on estimates of current plate motions. Geophys. Res. Lett., 21, 2191–2194. Dragert, H., Hyndam, R.D., Rogers, G.C. & Wang K., 1994. Current deformation and the width of the seismogenic zone of the northern Cascadia subduction thrust, J. geophys. Res., 99, 653–668. Fort, M., Freytet, P. & Colchen, M., 1982. Structural and sedimentological evolution of the Thakkhola Mustang graben (Nepal Himalayas), Z. Geomorph. N. F., 42, 75–98. Gahalaut, V.K. & Chander R., 1997. Evidence for an earthquake cycle in the NW outer Himalayas near 78◦ longitude, from precision levelling observation, Geophys. Res. Lett., 24, 225–228. Ganser, A., 1964. Geology of the Himalayas, p. 289, London, Wiley InterScience. Gordon, R.G., Argus, D.F. & Heflin, M.B., 1999. Revised estimate of the angular velocity of India relative to Eurasia (Abstract), EOS, Trans. Am. geophys. Un., 80(46), Fall Meet. Suppl., F273. Harrison T. Mark, Ryerson F.J., Le Fort P., Yin An, Lovera Oscar M. & Catlos E.J., 1997. A Late Miocene-Pliocene origin for the Central Himalayan inverted metamorphism, E. P. S. L., Vol. 146, Issues 1-2, pp. E1-E. Hodges, K.V., Parrish R.R. & Searle M.P., 1996. Tectonic evolution of the central Annapurna Range, Nepalese Himalaya, Tectonics, 15, 1264–1291. Jackson, M. & Bilham, R., 1994. Constraints on Himalayan deformation inferred from vertical velocity field in Nepal and Tibet, J. geophys. Res., 99, 13 897–13 912. Jouanne, F. et al., 1999. Oblique convergence in the Himalayas of Western Nepal deduced from preliminary results of GPS measurements, Geophys. Res. Lett., 26, No. 13, p. 1933. Kogan, M.G. et al., 2000. Geodetic constraints on the rigidity and relative motion of Eurasia and North America, Geoph. Res. Let., 27, 14, 2041– 2044. Larson, K., Burgmann, R., Bilham, R. & Freymuller, J., 1999. Kinematics of the India-Eurasia collision Zone from GPS measurements, J. geophys. Res., 104, 1077–1093. Lav´e, J. & Avouac, J.P., 2000. Active folding of fluviatile terraces across the Siwaliks Hills, Himalayas of central Nepal, implications for himalayan seismotectonics, J. geophys. Res., 105, 5735–5770. Liu, Q., Avouac, J.P., Tapponnier, P. & Zhang, Q., 1992. Holocene movement along the Southern part of the Karakoram fault, in International Symposium on the Karakoram and Kunlun mountains, June 5–9, Chin. Acad. of Sci., Xinjing China. McCaffrey, R. & Nabelek, J., 1998. Role of oblique convergence in the active deformation of the Himalayas and southern Tibet plateau, Geology, 26, 691–694. Mao, A., Harrison, C.G.A. & Dixon, T.H., 1999. Noise in GPS coordinate time series, J. geophys. Res., 104, 2797–2816. Molnar, P., 1987. The distribution of intensity associated with the 1905 Kangra Earthquake and bounds on the extent of the Rupture Zone, J. Geol. Soc. of India, 29, 211–229. Melbourne, W.G., 1985. The Case for Ranging in GPS Based Geodetic Systems, in Proceeding 1st International Symposium on Precise Positioning with the Global Positioning System, Vol. 1, pp. 403–412, ed. Goad, C., US Department of Commerce, Rockville, MD. Molnar, P., 1987. The distribution of intensity associated with the 1905 Kangra earthquake and bounds of the extend of the rupture zone, J. Soc. India, 29, 221–229. Molnar, P. & Pandey, M.R., 1989. Rupture zones of Great Earthquakes in the Himalayan region, in Frontiers of Seismology in India, Vol. 98, pp. 61–70, ed. Brune, J.N., Proc. Indian Acad. Sci. Mugnier, J.L., Delcaillau, B., Huyghe, P. & Leturmy, P., 1998. The BreakBack Thrust splay of the Main Dun Thrust: evidence for an intermediate displacement scale between seismic/aseismic fault slip and finite geometry of thrust systems, J. Struct. Geol., 20, 857–864. Mugnier, J.L., Leturmy, P., Mascle, G., Huyghe, P., Chalaron, E., Vidal, G., Husson, L. & Delcaillau, B., 1999. The Siwaliks of Western Nepal: geometry and kinematics, in Advances on the Geology of the Himalaya, focus on Nepal, Vol. 17, pp. 629–642, eds Le Fort, P. & Upreti, B.N., J. Asian Earth Sci., spec.
March 25, 2004
14
22:52
Geophysical Journal International
gji2180
F. Jouanne et al.
Mugnier, J.L., Huyghe, P., Leturmy, P. & Jouanne, F., 2003. Episodicity and rates of thrust sheet motion in Himalaya (Western Nepal), in Thrust Tectonics and Hydrocarbon Systems, ed. Mc Clay, AAPG Mem., 82, 1–24. SPI Publisher Services, Ashland, VA. Nakata, T., 1989. Active faults of the Himalayas of India and Nepal, Geol. Soc. Am., spec., 232, 243–264. Nakata, T., Kumura, K. & Rockwell, T., 1998. First successfull paleoseismic Trench study on active faults in the Himalaya. AGU 1998 fall meeting, EOS, Trans. Am. geophys. Un., 79, p. 45. Ni, J. & Barazangi, M., 1984. Seismotectonics of the Himalayan Collision Zone: Geometry of the Underthrusting Indian Plate beneath the Himalaya, J. geophys. Res., 89(B2), 1147–1163. Okada, Y., 1985. Surface deformation to shear and tensile faults in a half space, Bull. seism. Soc. Am., 75, 1135–1154. Pandey, M.R., Tandukar, R.P., Avouac, J.P., Lav´e, J. & Massot, J.P., 1995. Evidence for recent interseismic strain accumulation on a mid-crustal ramp in the Central Himalayas of Nepal, Geophys. Res. Lett., 22, 751– 758. Pandey, M.R., Tandukar, R.P., Avouac, J.P., Vergne, J. & H´eritier, Th., 1999. Seismotectonics of the Nepal Himalayas from a local seismic network, in Advances on the Geology of the Himalaya, Focus on Nepal, 17, pp. 703–712, eds Le Fort, P. & Upreti, B.N., J. Asian Earth Sci., spec. Paul, J. et al., 2001. The motion and active deformation of India, G.R.L., Vol. 28, 4, pp. 647–650. Pecher, A., 1991. The contact between the higher Himalayan crystallines and the Tibetan sedimentary series: Miocene large-scale dextral shearing, Tectonics, 10, 587–598. Shen, Z.-K., Zhao, C., Yin, A., Li, Y., Jackson, D.D., Fang, P. & Dong, D., 2000. Contemporary crustal deformation in east Asia constrained by Global Positioning System measurements, J. geophys. Res., 105, 5721– 5734.
Singh, D.D., 2000. Seismotectonics of the Himalayas and its vicinity from centroid-moment tensor (CMT) solution of earthquakes, J. Geodyn., 30, 507–537. Srivastava, P. & G. Mitra, 1994. Thrust geometries and deep structure of the outer and lesser Himalayas, Kumaon of the Himalayan fold-and-thrust belt; Tectonics, 13, 89–109. Upreti, B.N. & Le Fort, P., 1999. Lesser Himalayan Crystalline Nappes of Nepal: problem of their origin, in Advances on the geology of the Himalaya, focus on Nepal geology J. Asian Earth Sci., spec. 328, 225– 238. Van der Beek, P.A., Champel, B., & Mugnier, J.L., 2003. Drainage development in regions of active fault-propagation folding controlled by detachment dip, Geology, 30, 471–474. Vergne, J., Cattin, R. & Avouac, J.P., 2001. On the use of dislocation to model interseismic strain and stress buid-up at intracontinental thrust faults, Geophys. J. Int., 147, 155–162. Wang, Qi. et al., 2001. Present-Day Crustal Deformation in China Constrained by Global Positioning System Measurements, Science, 294, 574– 577. Wessel, P. & Smith W.H.F., 1998. New improved version of the Generic Mapping Tools released, EOS Trans. AGU, 79, 579. W¨ubbena, G., 1985. Software Developments for Geodetic Positioning with GPS using TI 4100 Code and Carrier Measurements, in Proceeding 1st International Symposium on Precise Positioning with the Global Positioning System, Vol. 1, pp. 403–412, ed. Goad, C., US Department of Commerce, Rockville, MD. Yeats, R. & Lillie, R., 1991. Contemporary tectonics of the Himalayan fault system: folds, blind thrusts and the 1905 Kangra earthquake, J. Struct. Geol., 13, 215–225. Zhao, W., Nelson, K.D. & project INDEPTH Team, 1993. Deep seismic reflection evidence for continental underthrusting beneath southern Tibet, Nature, 366, 555–559.
� C
2004 RAS, GJI, 157, 1–14