David Hunter Lecturer Graphic Design & researcher Ravensbourne, London, UK
Data Walking: TRANSECTS THROUGH SPACE AS INFORMATION
Data Walking: TRANSECTS THROUGH SPACE AS INFORMATION A research project exploring data gathering and data visualisation
Data Walking: TRANSECTS THROUGH SPACE AS INFORMATION A research project exploring data gathering and data visualisation _The aim of the project is to collect environmental data while walking around a specific area to build a rich picture of that area over time _Encourage engagement with technology and data visualisation _Develop new techniques and innovative outcomes
Concept & Initiation
_Artistic walks with Mnemonic City collective, using walking to discover, discuss, and share memories and stories _Cities as data rich environments _Using walking to cut paths or transects through this ‘data space’
Considerations
_Ubiquity of low cost equipment to sense the environment _Technology enabling a designer to work end-to-end from data gathering, analyzing, editing, authoring, and visualising _Measuring environmental data without allowing scientific rigour or fair tests to impede exploration _The act of doing brings about greater insight _Open Source data and tools; collaborative
First Walks Equipment Arduino Uno Adafruit GPS Shield Photo resistor (light) Microphone (sound)
First Walks Equipment Arduino Uno Adafruit GPS Shield Photo resistor (light) Microphone (sound) Outcome Processing Unfolding Maps library
First Walks
First Walks
First Walks
First Walks
First Walks
First Walks
First Walks
PHASE one: Stratford to Barbican CENTRE
_Funding from Ravensbourne and Barbican Centre _Exhibition outlet (Interfaces, Fish Island Labs) _Additional sensors _Multidimensional data representation
Process Build Device
Walk
Process Data
Model
Print
2 x arduino light sound temperature dust gas photos (iPhone)
Stratford to Barbican 4 walks in 24hrs 3 day walks 1 night walk 8km per walk
Processing graph data reduce points photo texture create cylinders create DXF
3DS Max model cylinders texture
8 cylinders 2 x 15hrs clean glue
Process Build Device 2 x arduino light sound temperature dust gas photos (iPhone)
Process Walk Stratford to Barbican 4 walks in 24hrs 3 day walks 1 night walk 8km per walk
Process Process Data Processing graph data reduce points photo texture create cylinders create DXF
Process Process Data Processing graph data reduce points photo texture create cylinders create DXF
Process Process Data Processing graph data reduce points photo texture create cylinders create DXF
Process Process Data Processing graph data reduce points photo texture create cylinders create DXF
Process Process Data Processing graph data reduce points photo texture create cylinders create DXF
Process Process Data Processing graph data reduce points photo texture create cylinders create DXF
Process Process Data Processing graph data reduce points photo texture create cylinders create DXF
Process Process Data Processing graph data reduce points photo texture create cylinders create DXF
Process Model 3DS Max model cylinders texture
Process Print 8 cylinders 2 x 15hrs clean glue
OUTCOME
PHASE two: New York and Amsterdam
_Simplify data gathering method to only using a smartphone _Explore potential of programming outcomes for printed matter and maps
Analysing PHOTOS
_Divide images into horizontal layers _Each layer roughly equates to an altitude _Rank colours in each layer to see which are most prevalent
Plotting PHOTOS
_Plot photos using GPS information extracted from each image’s Exif data
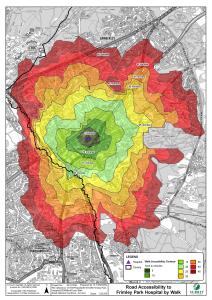
Custom Heatmap
_Create a custom heatmap using the colour from each image plotted to it’s location and interpolate the colour for all pixels between points.
Stack Maps
_A heatmap is made for each layer and then can be stacked on top of each other to make a virtual 3D map of the city as a colour space
Slice Maps
_Custom tool made in Processing to slice through this virtual data space and create transects
DEFINE ROUTES
_Using time data from each photo to define the routes walked each day when photos were taken in close time sequence.
Cleave City Along Routes
_Routes are used to slice through the city and recreate the view of the actual walk
GRID
_Grids traversing the whole city space can be created
Video
OUTCOME
Phase 3: North Greenwich
_Funded by Ravensbourne Research Office _Focus on North Greenwich area _6 months, 1 walk per month _Procure equipment for Ravensbourne
Phase 3: North Greenwich
_Engage student community to take part in project _Pre-walk session to discuss what to gather make data gathering devices including sensors on micro controllers and smartphones _ Data gathered on each walk used to create maps, charts, data experiences, or artistic works by participants to represent the area and the process of the project _ Outcomes will be compiled into a printed publication and public launch/exhibition _Website, Open Source data and tools using Github
ROUTES
Charting January
February
Mapping LIGHT
Mapping Sound
Mapping Sound
Mapping People
Combining WALK DATA
Combining WALK DATA
Combining WALK DATA
Website & Github
Analysis
_Lots of data _Little output _Broad range of courses involved-Graphic Design, Design & Coding, Post Graduate
_Low student engagement-make it their own project value content (John Paul Dowling)
_Workshop successful _Better communication about the project-Design Facilitator (Aaron Harvey)
Plan
_Extend for six months-Full year coverage, more data, types of data, what can we measure?
_More student engagement, set as optional brief? _Schedule deadlines and time to develop outcomes _Printed outcome with local printer Aspect Press-Project document / Data Walking manual
_Exhibition at local gallery space NOW Gallery
Thank you! datawalking.com github/dhdpic/DATA_WALKING
[email protected] davidhunterdesign.com @dhdpic ravensbournegraphicdesign.com ravensbourne.ac.uk/research