DEEP ADAPTATION UNDER MOTION-INDUCED BLINDNESS CONDITION Florent Caetta & Andrei Gorea Laboratoire Psychologie de la Perception, Paris Descartes University & CNRS, Paris, France
Introduction Motion-induced blindness (MIB; 1) refers to the spontaneous disappearance and reappearance of highly salient stimuli when superimposed on a moving pattern. Here we examine the extent to which MIB condition affect the dynamic of adaptation. It is well known that adaptation increases the detection threshold of the adapted stimuli and reduces their perceived luminance. These adaptation consequences were assessed in two experiments, one where target’s brightness was monitored over time (Experiment 1) and another where this target’s detection threshold was measured following different target exposure times (Experiment 2).
Experiment 1: brightness tracking over time
Experiment 2: time course of detection threshold
Method Figure 1 illustrates the stimulating display of Exp. 1. By means of sliding the mouse forward and backward 5 Sjs adjusted the luminance of a slowly drifting probe (square in the right hemifield) to match the brightness of the target (square in the left hemifield). Probe’s drift prevented its own adaptation (as confirmed in a preliminary experiment). In case of target’s disappearance, Sjs pressed the left mouse button for as long as the target remained invisible. The probe was physically removed during these periods. Brightness was assessed over a 1 min period for the target presented alone (”Absent Mask” – AM) and when superimposed on a static (”Static Mask” – SM) or moving background (“Moving Mask” – MM).
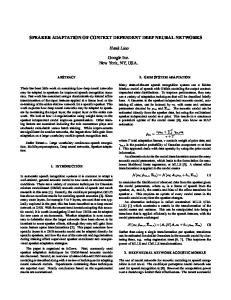
Method Figure 3 illustrates the stimulating display of Exp. 2. Two adapting squares appeared either in the left or right hemifield. An auditory beep delivered at 1, 9 or 19 s after the beginning of the trial prompted observers to initiate the onset of a test square presented at the location of one of the two adapting squares on the condition that none was phenomenally suppressed (if they were the trial was aborted). Subject had to decide on the location of the test square (upper or lower position; 2AFC). Detections thresholds for each adaptation period were assessed via two interleaved one-up-two-down staircases that independently monitored target’s luminance for each adaptation interval. As in Experiment 1, thresholds were measured for the AM, SM and MM conditions.
Figure 1. Experimental display in the brightness tracking Experiment.
Figure 3. Experimental display in the detection threhold Experiment.
Results Figure 2 displays the mean luminance of the probe matched to the brightness of the target with the black, green and red tracks for the AM, SM and MM conditions, respectively. The general observations are: (i) the rapid adaptation phase is the about the same for the SM and MM conditions; (ii) adaptation plateaux are also very similar for the SM and MM conditions, and below the plateau of the AM condition; (iii) as a consequence of the above, the inflection points of the adaptation tracks occur at about the same time (≈ 4 s) for the SM and MM conditions and significantly later for the AM condition (≈ 8 s). Contrary to expectation, the brightness adaptation time-course does not discriminate between the SM and MM conditions but, as expected, does discriminate between MM and AM conditions.
Results Figure 4 displays mean luminance detection thresholds (L θ) as a function of adaptation time for AM (circles), SM (squares) and MM (triangles) conditions. For all conditions thresholds increase from 2 to 10 s adaptation intervals and level off thereafter. Compared with the detection thresholds assessed after 2 s adaptation time, which are about equal across conditions, the detection thresholds after 20 s of adaptation increase by factors of 1.84, 1.98 and 2.60 for the AM, SM and MM conditions, respectively. Hence, the plateau for the MM condition (L θ, ΜΜ = 54.10) is about 1.50 higher than the plateau for the SM and AM conditions (L θ, AM, SM = 36.73).
70 60
120
50
100 Lθ
Luminance (cd/m²)
140
80 60
40 30
40
MM SM AM
20 0
10
20
30 Time (s)
40
50
MM SM AM
20 60
10
Figure 2. Mean time courses of brightness for conditions AM (black lines), SM (green lines) and MM (red lines). Solid lines are exponential decay fits.
Discussion
0
2
4
6
8
10 12 Time (s)
14
16
18
20
22
Figure 4. Mean luminance detection thresholds (L θ ) as a function of exposure time for conditions AM (circles), SM (squares) and MM (triangle). Vertical lines are ± 1 SE across observers.
• Brightness time-course of a target superimposed on a MM (MIB) is very similar to that of a target superimposed on a SM but is much faster and pronounced than in the AM condition. • Target detection thresholds show similar time-courses for the SM & AM conditions but increase faster and level off at higher levels for the MM condition. • The apparent disagreement between the brightness and detection adaptation-dependent functions may well be due to distinct underlying adaptation processes but also to Sjs using distinct reference brightness criteria across the different stimulus configurations [2], criteria that are not operant in the 2AFC detection task. • In all events, taken as a whole, the present experiments suggest a deeper adaptation state under MIB than under the remaining conditions and hence support the notion that adaptation is one critical MIB cause. References [1] Bonneh, Y. S., Cooperman, A., & Sagi, D. (2001). Motion-induced blindness in normal observers. Nature, 411, 798–801. [2] Caetta, F., Gorea, A., & Bonneh, Y. S. (2007). Sensory and decisional factors in motion-induced blindness. Journal of Vision, 7(7):4, 1–12.