Optics and Lasers in Engineering 50 (2012) 1059–1062
Contents lists available at SciVerse ScienceDirect
Optics and Lasers in Engineering journal homepage: www.elsevier.com/locate/optlaseng
Detection of defects from fringe patterns using a pseudo-Wigner–Ville distribution based method Gannavarpu Rajshekhar a, Sai Siva Gorthi b, Pramod Rastogi a,n a b
´rale de Lausanne, 1015 Lausanne, Switzerland Applied Computing and Mechanics Laboratory, Ecole Polytechnique Fe´de Rowland Institute at Harvard University, Cambridge, MA 02142, USA
a r t i c l e i n f o
abstract
Available online 9 February 2012
The paper presents a method to identify defects from fringe patterns. In the proposed method, the phase derivatives are computed from a fringe pattern using the two-dimensional Pseudo-Wigner–Ville distribution. Since the phase derivative varies rapidly in the vicinity of the defect, the relative change in the derivatives for the normal and defect-containing fringe patterns is compared with respect to a preset threshold to identify the defect in the fringe pattern. The robustness of the method for detecting defects of various sizes and at different noise levels is shown using simulated fringe patterns. & 2012 Elsevier Ltd. All rights reserved.
Keywords: Phase derivative Defect detection Pseudo-Wigner–Ville distribution
1. Introduction Optical interferometric techniques such as electronic speckle pattern interferometry and holographic interferometry are quite popular in experimental mechanics and non-destructive testing and have various advantages like non-invasive nature, wholefield behavior and good resolution. In these techniques, the information about a measured physical quantity is contained in a fringe pattern. For many applications such as quality control and industrial inspection, the automated detection of defects or faults like cracks, debonds, etc. from fringe patterns is desired. A defect or fault is characterized by rapid fringe density variations in the fringe pattern. The classification of different types of faults occurring in fringe patterns is detailed in [1]. Various methods based on fringe density estimation [2,3], pattern classification [4–7], discontinuity tracking [8], wavelet transform [9], windowed Fourier transform [10], etc. have been proposed for the detection of defects from fringe patterns. In this paper, we propose a two-dimensional pseudo-Wigner– Ville distribution [11] based method for automated defect detection. The method is presented in the context of digital holographic interferometry (DHI). The theory of the proposed method is discussed in the next section. The analysis of the method is presented in Section 3. The applicability of the method for other interferometric techniques is presented in Section 4, followed by conclusions.
2. Theory The reconstructed interference field in DHI is given as
Gðx,yÞ ¼ aðx,yÞ exp½jfðx,yÞ�
where aðx,yÞ is the amplitude, fðx,yÞ is the interference phase and x and y refer to the spatial coordinates along the horizontal and vertical directions. The real part of the reconstructed interference field constitutes a fringe pattern. In the proposed method, two fringe patterns, i.e. one defectfree (reference) and the other with defects are considered. Such fringe patterns commonly arise in non-destructive testing applications like condition monitoring where fringe evolution over time is monitored for defects and consequently, a sequence of fringe patterns is captured [1]. Between the two fringe patterns, the change of phase is abrupt near the defect. Effectively, in the vicinity of the defect, the difference in the phase derivatives corresponding to the two fringe patterns is pronounced compared to other regions. Hence, by using the information about the phase derivatives, the defect could be identified. To obtain the phase derivatives from Gðx,yÞ, two-dimensional pseudo-Wigner–Ville distribution (2D-PSWVD) [11] was applied. Compared to the popular digital shearing approach [12,13], the 2D-PSWVD based technique directly provides the phase derivatives with respect to x and y without unwrapping operation and is also robust against noise. The 2D-PSWVD is given as Z 1Z 1 Gðx,y, o1 , o2 Þ ¼ wðt1 , t2 ÞGðx þ t1 ,yþ t2 ÞGn ðx�t1 ,y�t2 Þ �1
�1
�exp½�2jðo1 t1 þ o2 t2 Þ� @t1 @t2 n
Corresponding author. E-mail address: pramod.rastogi@epfl.ch (P. Rastogi).
0143-8166/$ - see front matter & 2012 Elsevier Ltd. All rights reserved. doi:10.1016/j.optlaseng.2012.01.005
ð1Þ
ð2Þ
where w is a real symmetric window and ‘n’ denotes the complex conjugate. The phase derivatives with respect to x and y, i.e.
1060
G. Rajshekhar et al. / Optics and Lasers in Engineering 50 (2012) 1059–1062
qffiffiffiffiffiffiffiffiffiffiffiffiffiffiffiffiffiffiffiffiffiffiffiffiffiffiffiffiffiffiffiffiffiffiffiffiffiffiffiffiffiffiffiffiffiffiffiffiffiffiffiffiffiffiffiffiffiffiffiffiffiffiffiffiffiffiffiffiffiffiffiffiffiffiffiffiffiffiffiffiffiffiffiffiffiffiffiffiffiffiffi ðf2x ðx,yÞ�f1x ðx,yÞÞ2 þ ðf2y ðx,yÞ�f1y ðx,yÞÞ2 qffiffiffiffiffiffiffiffiffiffiffiffiffiffiffiffiffiffiffiffiffiffiffiffiffiffiffiffiffiffiffiffiffiffiffiffiffiffiffi ¼ f21x ðx,yÞ þ f21y ðx,yÞ
½fx ¼ @f=@x, fy ¼ @f=@y� correspond to the spatial frequencies ½o1 , o2 � at which the 2D-PSWVD attains its peak. So we have, ½fx , fy � ¼ arg max Gðx,y, o1 , o2 Þ
ð4Þ
ð3Þ
o1 , o2
Denoting the phases corresponding to the reference and defectcontaining fringe patterns as f1 and f2 , the respective phase derivatives ½f1x , f1y � and ½f2x , f2y � are computed using the 2DPSWVD as shown above. To design a suitable detection criterion for locating defects, the relative change or difference in the phase derivatives corresponding to the two fringe patterns is considered. Treating the phase derivatives with respect to x and y as vectors in a Euclidean space, ~ ¼ ½f , f � and f ~ ¼ ½f , f �, the phase derivative i.e. f 1d 1x 1y 2d 2x 2y change can be analogously interpreted as the distance between the two vectors which is computed by the vector norm. Accordingly, the relative phase derivative difference can be computed as ~ �f ~ J Jf rðx,yÞ ¼ 2d 1d 2 ~ J Jf 1d 2
where ‘J J2 ’ denotes the vector norm. Finally, by selecting a threshold value say thr, the defect region can be identified by the following algorithm:
rðx,yÞ Z thr x,yA defect region else x,y A defect-free region
if
Accordingly, the steps involved in the detection of defects using the proposed method can be summarized as follows: 1. The 2D-PSWVD is computed for the reference and defectcontaining fringe patterns using Eq. (2). 2. The phase derivatives are obtained for the two fringe patterns using Eq. (3).
50
100
100
y
y
50
150
150
200
200 50
100
x
150
200
50
100
50
100
x
150
200
150
200
50
y
100 150 200
x
50
y
100 150 200 50
100
150
200
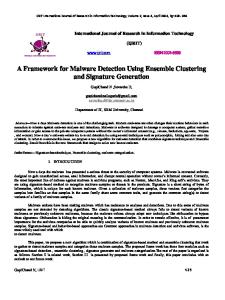
x Fig. 1. (a) Reference fringe pattern. (b) Fringe pattern with defects. (c) Relative phase derivative difference. (d) Identified defect regions and (e) Highlighted defect regions.
G. Rajshekhar et al. / Optics and Lasers in Engineering 50 (2012) 1059–1062
3. The relative phase derivative difference r for the two fringe patterns is measured using Eq. (4). 4. For each pixel with spatial coordinates (x,y) in the fringe pattern, rðx,yÞ is compared with certain threshold value; if the relative phase derivative difference exceeds the threshold, the pixel corresponds to a defect. For the analysis, the threshold value was selected as 30%. However, it needs to be emphasized that the choice of the threshold depends on various factors such as fringe quality, noise, etc. and could be varied based on the application.
3. Analysis For the analysis, reconstructed interference field (N � N pixels) corresponding to the reference fringe pattern was simulated as
Gðx,yÞ ¼ exp½jo0 x� þ Zðx,yÞ 8x,y A ½1,N ¼ 256�
ð5Þ
where o0 ¼ 30=N and Zðx,yÞ is the additive white Gaussian noise added using MATLAB’s ‘awgn’ function at signal-to-noise-ratio (SNR) of 20 dB. The real part of Gðx,yÞ, i.e. the reference fringe
1061
pattern is shown in Fig. 1(a). Similarly, the simulated fringe pattern containing defects of various sizes is shown in Fig. 1(b). The proposed method was applied to locate the defects. For the 2D-PSWVD calculations, a 11 � 11 Gaussian window was applied using MATLAB’s ‘gausswin’ function. For the analysis, the pixels near the borders of the fringe patterns were neglected to ignore the phase derivative estimation errors at the edges. The computed relative phase derivative difference, i.e. rðx,yÞ is shown in Fig. 1(c). From the figure, it is clear that near the defects, the relative phase derivative difference shows a pronounced increase compared to other neighboring regions. Using the detection algorithm of the proposed method, the defect regions were identified as shown in Fig. 1(d). To improve detection accuracy, the pixels surrounded by a defect region’s pixels were also considered part of the defect region. Finally, the highlighted defect regions in the fringe pattern are shown in Fig. 1(e). The results show that the proposed method is capable of identifying multiple defects of varying sizes from the fringe patterns. To test the robustness of the proposed method against noise for defect detection, different fringe patterns with and without defects were simulated at varying levels of SNR. For an SNR of 16 dB, the reference fringe pattern, defect-containing fringe pattern and the highlighted defect regions using the proposed method are shown in
Fig. 2. Reference fringe pattern, defect-containing fringe pattern and the highlighted defects at SNR of 16 dB for (a)–(c), 12 dB for (d)–(f), 8 dB for (g)-(i).
1062
G. Rajshekhar et al. / Optics and Lasers in Engineering 50 (2012) 1059–1062
Fig. 2(a)–(c). Similarly, the corresponding figures for SNRs of 12 dB and 8 dB are shown in Fig. 2(d)–(f) and Fig. 2(g)–(i). These figures demonstrate that the proposed method provides reliable identification of defects even in the presence of high noise.
4. Extension to other optical techniques Though the method is presented in the context of DHI, its applicability can be extended to other optical interferometric techniques such as electronic speckle pattern interferometry and classical holographic interferometry. In these techniques, the obtained fringe pattern is of the following form: Iðx,yÞ ¼ aðx,yÞ þbðx,yÞcos½fðx,yÞ�
ð6Þ
where Iðx,yÞ is the fringe intensity, aðx,yÞ is the background intensity, bðx,yÞ is the fringe amplitude and fðx,yÞ is the interference phase. Using a normalization operation [14] and real to analytic signal conversion [15] in presence of a carrier, a complex signal similar to the one in Eq. (1) can be obtained. Subsequently, the proposed method can be applied in the same manner as discussed above.
5. Conclusions The paper presents an elegant method for identifying defects in fringe patterns. To locate the defects, the proposed method relies on the relative phase derivative difference between the normal and defect-containing fringe patterns. The main advantages of the proposed method are the ability to identify defects of varying sizes and robustness against noise. The authors believe that the proposed method would greatly enhance the applicability of optical interferometric techniques in non-destructive testing and evaluation applications.
References [1] Osten W, Jueptner WP, Mieth U. Knowledge-assisted evaluation of fringe patterns for automatic fault detection. Proc SPIE 1994;2004:256–68. [2] Tichenor DA, Madsen VP. Computer analysis of holographic interferograms for nondestructive testing. Opt Eng 1979;18:469–72. [3] Robinson DW. Automatic fringe analysis with a computer image-processing system. Appl Opt 1983;22(14):2169–76. [4] Juptner WP, Kreis TM, Mieth U, Osten W. Application of neural networks and knowledge-based systems for automatic identification of fault-indicating fringe patterns. Proc SPIE 1994;2342:16–26. ¨ [5] Kruger S, Wernicke G, Osten W, Kayser D, Demoli N, Gruber H. Fault detection and feature analysis in interferometric fringe patterns by the application of wavelet filters in convolution processors. J Electron Imaging 2001;10(1): 228–33. [6] Kallmeyer F, Krueger S, Wernicke G, Gruber H, Demoli N, Osten W, et al. Optical processing for the detection of faults in interferometric patterns. Proc SPIE 2002;4777:371–81. [7] Yannick Caulier TW, Spinnler K, Bourennane S. Specific features for the analysis of fringe images. Opt Eng 2008;47:057201. [8] Federico A, Kaufmann GH. Retrieval of phase derivative discontinuities in digital speckle pattern interferometry fringes using the Wigner–Ville distribution. Proc SPIE 2004;5531:127–33. [9] Li X. Wavelet transform for detection of partial fringe patterns induced by defects in nondestructive testing of holographic interferometry and electronic speckle pattern interferometry. Opt Eng 2000;39(10):2821–7. [10] Qian K, Seah HS, Asundi A. Fault detection by interferometric fringe pattern analysis using windowed Fourier transform. Meas Sci Technol 2005;16(8): 1582–7. [11] Rajshekhar G, Gorthi SS, Rastogi P. Estimation of displacement derivatives in digital holographic interferometry using a two-dimensional space–frequency distribution. Opt Express 2010;18(17):18041–6. [12] Zou Y, Pedrini G, Tiziani H. Derivatives obtained directly from displacement data. Opt Commun 1994;111(5–6):427–32. [13] Schnars U, Juptner WPO. Digital recording and reconstruction of holograms in hologram interferometry and shearography. Appl Opt 1994;33(20): 4373–7. [14] Quiroga JA, Antonio Gomez-Pedrero J, Garcia-Botella A. Algorithm for fringe pattern normalization. Opt Commun 2001;197(1–3):43–51. [15] Lawrence Marple Jr. S. Computing the discrete-time analytic signal via FFT. IEEE Trans Signal Process 1999;47(9):2600–3.