J Neurophysiol 92: 939 –948, 2004; 10.1152/jn.00111.2004.
Differential Temporal Coding of Rhythmically Diverse Acoustic Signals by a Single Interneuron G. Marsat and G. S. Pollack Department of Biology, McGill University, Montreal, Quebec H3A1B1, Canada Submitted 4 February 2004; accepted in final form 17 March 2004
Marsat, G. and G. S. Pollack. Differential temporal coding of rhythmically diverse acoustic signals by a single interneuron. J Neurophysiol 92: 939 –948, 2004; 10.1152/jn.00111.2004. The omega neuron 1 (ON1) of the cricket Teleogryllus oceanicus responds to conspecific signals (4.5 kHz) and to the ultrasonic echolocation sounds used by hunting, insectivorous bats. These signals differ in temporal structure as well as in carrier frequency. We show that ON1’s temporal coding properties vary with carrier frequency, allowing it to encode both of these behaviorally important signals. Information-transfer functions show that coding of 4.5 kHz is limited to the range of amplitude-modulation components that occur in cricket songs (⬍32 Hz), whereas coding of 30-kHz stimuli extends to the higher pulse rates that occur in bat sounds (⬃100 Hz). Nonlinear coding contributes to the information content of ON1’s spike train, particularly for 30-kHz stimuli with high intensities and large modulation depths. Phase locking to sinusoidal amplitude envelopes also extends to higher AM frequencies for ultrasound stimuli. ON1s frequency-specific behavior cannot be ascribed to differences in the shapes of information-transfer functions of low- and high-frequencytuned receptor neurons, both of which are tuned more broadly to AM frequencies than ON1. Coding properties are nearly unaffected by contralateral deafferentation. ON1’s role in auditory processing is to increase binaural contrast through contralateral inhibition. We hypothesize that its frequency-specific temporal coding properties optimize binaural contrast for sounds with both the spectral and temporal features of behaviorally relevant signals. INTRODUCTION
Sensory information is often conveyed by the temporal structures of signals. This is particularly evident for acoustic signals. Speech, bird song, and communication sounds of many other species are characterized by stereotypic rhythms of modulation of frequency and/or amplitude. Behavioral tests have shown that these temporal features carry much of the signal’s information (e.g., Ghazanfar et al. 2001; Shannon et al. 1995). Crickets communicate using songs composed of rhythmical sequences of sound pulses. Both the carrier frequency of songs and their temporal structures are important cues for signal recognition. Sounds with spectral and temporal properties similar to those of cricket song elicit orientation and locomotion toward the sound source (reviewed in Pollack 1998). Crickets also hear the echolocation calls of hunting, insectivorous bats; such sounds elicit evasive responses (Nolen and Hoy 1986). Cricket songs and bat calls differ both in spectrum and in temporal pattern. Songs of the cricket species studied here, Teleogryllus oceanicus, have a dominant carrier frequency of Address for reprint requests and other correspondence: G. S. Pollack, Dept. of Biology, McGill University, 1205 Doctor Penfield Ave., Montreal, PQ, H3A1B1, Canada (E-mail:
[email protected]). www.jn.org
ca. 4.5 kHz with higher harmonics that are lower in intensity by ⱖ20 dB. The sound pulses that comprise the songs are 20 –35 ms in duration and occur at rates from ca. 7 to 32 pulses/s (Balakrishnan and Pollack 1996). Bat calls are ultrasonic (⬎20 kHz) and consist of series’ of brief sound pulses (typically 1–20 ms) occurring at rates ⱕ200 pulses/s (Wimsalt 1970). The auditory system of T. oceanicus is specialized to detect sound frequencies similar to those that occur in cricket songs and bat calls. This is apparent at both the receptor-neuron and interneuron levels, where individual neurons respond most strongly to either cricket- or bat-like frequencies (Atkins and Pollack 1987; Imaizumi and Pollack 1999). The identified interneuron omega neuron 1 (ON1) is unusual in that it is dually tuned with enhanced sensitivity to both ranges of sound frequency (Atkins and Pollack 1986). Each ON1 receives excitatory input mainly from the receptors of one ear and inhibits neurons that receive input from the opposite ear, thus enhancing binaural contrast and, presumably, facilitating sound localization (Faulkes and Pollack 2000; Horsemann and Huber 1994; Selverston et al. 1985). Work in several systems has shown that the temporal coding properties of neurons are matched to the structures of behaviorally important signals (Machens et al. 2001; Nagarajan et al. 2002; Rieke et al. 1995; Theunissen et al. 2000). ON1 is unusual among auditory neurons in that this single neuron processes two different classes of signal, cricket songs and bat calls, that differ in carrier frequency, temporal structure, and behavioral consequence. ON1 is specialized for the differing carrier frequencies of these signals. Here we show that it is also specialized to encode their differing temporal structures. MATERIALS AND METHODS
Electrophysiology Teleogryllus oceanicus were reared in the laboratory. Virgin females were used for experiments at age 10 –21 days after the final molt. They were mounted on a support ventral-side uppermost with the front legs (the site of the ears) held flexed against the pronotum in a position similar to that adopted during flight. The prothoracic ganglion was exposed by ventral dissection, supported on a metal platform, and bathed in physiological saline (Strausfeld et al. 1983). ON1 was recorded extracellularly from its soma-contralateral processes in the prothoracic ganglion using blunt glass microelectrodes filled with 1M NaCl (resistance, 5–10 M⍀). ON1 can be identified unambiguously in this recording configuration by its increased sensitivity to electrode-contralateral sound (threshold lower by 10 –20 dB) (see Pollack 1986 for further details) as well as by its greater The costs of publication of this article were defrayed in part by the payment of page charges. The article must therefore be hereby marked “advertisement” in accordance with 18 U.S.C. Section 1734 solely to indicate this fact.
0022-3077/04 $5.00 Copyright © 2004 The American Physiological Society
939
940
G. MARSAT AND G. S. POLLACK
sensitivity, and longer latency, to 4.5-kHz stimuli than to ultrasound (Faulkes and Pollack 2000). Receptor neurons were recorded intracellularly at the entrance of the leg nerve to the prothoracic ganglion. Threshold for recorded neurons at 4.5 and/or 30kHz was defined as the minimum sound level (accuracy of ⫾1 dB for ON1, ⫾2.5 dB for receptors) that consistently evoked ⬎1 spike per 30-ms sound pulse. Recordings were digitized (16 bits, sampling rate: 10 kHz; Digidata 1320A, Axon Instruments) and analyzed off-line.
Sound stimuli Stimuli were either 30-ms sound pulses (including 5-ms linear onset and offset ramps) presented at 2-pulse/s, 15-s tones (4.5kHz or 30 kHz) the amplitude of which was modulated sinusoidally (100% modulation depth, amplitude-modulation (AM) rates: 1–140 Hz; sinusoidal amplitude modulation: SAM) or 15- to 30-s tones that were modulated in amplitude by multiplication with a low-pass-filtered Gaussian signal (⬍200 Hz) with SD of 3 dB except where otherwise noted (random amplitude modulation: RAM). Stimuli were produced by National Instruments AD/DA boards with 12 bits of resolution, at a sampling rate of either 100 or 200 kHz. Sounds were broadcast from loudspeakers situated perpendicular to the cricket’s longitudinal axis, ipsilateral to the ear driving the recorded neuron. For ON1, 30- and 4.5-kHz stimuli were presented in alternation; low- and high-frequency receptor neurons were stimulated with 4.5- or 30 kHz stimuli, respectively. Stimuli were followed by silent recovery periods of 45 s (15-s stimuli) or 90 s (30-s stimuli). Sound level was calibrated using Bru¨ el and Kjaer instruments (4135 microphone, 2610 sound-level meter).
Data analysis Temporal coding properties of neurons can be described in terms of the information contained within their spike trains about changes in a stimulus. We used two approaches to compute information-transfer functions. We derived the maximum information content of the spike train from the variation between responses to repeated presentations of an identical RAM stimulus, yielding an upper-bound estimate of information transfer (although, in our experiments, this corresponds to the actual information-transfer rate; see following text). We also constructed estimates of the stimulus based on an optimal linear filter relating the neuron’s spike train to preceding stimulation (reverse reconstruction) and derived a lower bound on information transfer from the difference between the actual and estimated stimulus. We used two methods to compute the upper bound on information transfer. First, we described the neuron’s response to each trial, ri(t), as firing rate in successive 0.5-ms-wide bins, (i.e., firing rate per bin either 0 or 2,000 Hz). These arrays were averaged across trials, yielding r (t). r (t) represents the component of the response that is determined by variations in stimulus amplitude. Deviations from r(t) on individual trials were assumed to be due to additive noise, ni(t), and were calculated as ri(t) ⫺ r(t). Signalto-noise ratio as a function of AM frequency, SNR( f ) was calculated as PR ( f )/PNi( f ), where PN ( f ) and PNi( f ) are, respectively, the power spectrum of r(t) and the mean of the power spectra of ni(t) (Haag and Borst 1997). Information transfer was calculated as I( f ) ⫽ log2[1 ⫹ SNR( f )] (Borst and Theunissen 1999). This method was applied to five ON1s with the RAM stimulus repeated 30 times. Second, spike timing was compared between pairs of responses by calculating response-to-response coherence (Roddey et al. 2000). Each individual response, expressed as firing rate, (r(t)), was separated into overlapping, Hanning-windowed, 300-ms segments and converted to the frequency domain (R( f )) using the fast Fourier transform. The coherence of a pair of responses i and j was calculated INFORMATION-TRANSFER FUNCTIONS.
J Neurophysiol • VOL
as: Coh ⫽ 冑 具Ri共 f 兲*Rj共 f 兲典具Rj共 f 兲*Ri共 f 兲典/具Ri共 f 兲*Ri共f兲典具Rj共 f 兲*Rj共 f 兲典, where * indicates complex conjugation and 具 典 indicates averaging across the 300-ms response segments. For each neuron, coherence was calculated for all pair wise combinations of responses to the same stimulus and averaged across response pairs, yielding Coh. Information was calculated as I( f ) ⫽ ⫺log2(1 ⫺ Coh) (Borst and Theunissen 1999). The two methods of calculating upper-bound information-transfer functions were compared for five ON1 neurons, and the results were indistinguishable. Here, we present results from the second method. Receptor neurons can be recorded for only a few minutes (Imaizumi and Pollack 1999), and we were able to repeat RAM stimuli only two to three times. The first method cannot be applied with such small sample sizes, but these are sufficient data for the second method (Roddey et al. 2000); thus only the second method was used for receptors. If signal power and noise power both have Gaussian probability distributions, the upper bound on information transfer equals the actual information transfer rate (Borst and Theunissen 1999). For the subset of ON1s that were tested with 30 stimulus repetitions, we confirmed that these requirements were met by comparing the distributions of signal (in this case, R ( f )) and noise [Ni( f ), for all i] with Gaussian distributions having the same mean ⫾ SD (KolmogorovSmirnov test; range of P values, 0.11– 0.6). Lower-bound information transfer functions, reflecting linearly coded information, were derived from reconstructions of the stimulus envelope based on an optimum linear filter describing the relationship between the stimulus and ON1’s firing rate (Clague et al. 1997; Theunissen et al. 1996). Arrays representing firing rate, r(t) and the stimulus envelope, s(t), were expressed as variations around their respective means, yielding r⬘(t) and s⬘(t). These arrays were segmented and Fourier-transformed as described above, yielding R⬘( f ) and S⬘( f ). The frequency-domain representation of the linear reverse filter for response i was calculated as: Hi( f ) ⫽ 具R⬘i( f )*S⬘i( f )典/具R⬘i( f )R⬘i( f ) *典. Hi( f ) was converted to the time domain, hi(t), using the inverse Fourier transform. The result of these operations is equivalent to the cross-correlation of r⬘i(t) and s⬘i(t), divided by the autocorrelation of r⬘i(t) (Press et al. 1992.). hi(t) was convolved with ri(t) to reconstruct the neuron’s estimate of the stimulus, esti(t). Noise, ni(t), was computed as si(t) ⫺ esti(t). Signal-to-noise ratio, SNRi( f ), was computed as the power spectrum of estt(t) divided by that of ni(t). SNRi( f ) was averaged for all i and information transfer was calculated from SNR( f ) as in the preceding text. Firing rate adapts markedly during the first few seconds of the response, yet an assumption behind our calculations is that the response statistics are stationary over time (Rieke et al. 1997). To restrict our analysis to the stable, i.e., adapted, portion of the response, the first 5 s were excluded. We summarize information-transfer functions by the maximum rate of information transfer, the AM rate at which information transfer is maximum, and the half-width, defined as the (possibly noncontiguous) range of AM frequencies at which information rate is greater than half the maximum. SYNCHRONIZATION COEFFICIENT. Synchronization coefficient was calculated for responses to SAM stimuli as 冑共兺x i 兲2 ⫹ 共兺yi兲2/n , where xi and yi are, respectively, the cosine and sine of the phase of the sinusoidal AM envelope at which the ith spike occurs, and n is the number of spikes included in the analysis (Goldberg and Brown 1969). Synchronization coefficient ranges from 0 to 1 and reflects both the extent of spike clustering during each cycle of AM and the consistency of response phase from cycle to cycle. Calculations were performed using programs written for Scilab (www.scilab.org). Statistical tests were performed using Statistica 5.5 (Statsoft, Tulsa, OK).
92 • AUGUST 2004 •
www.jn.org
FREQUENCY-SPECIFIC TEMPORAL CODING OF ACOUSTIC SIGNALS RESULTS
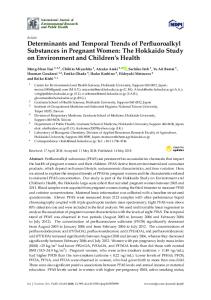
Dependence of temporal coding on carrier frequency ON1 shows enhanced sensitivity to both cricket-like (4.5 kHz) and ultrasonic (⬎20 kHz) frequencies, but threshold is lower for the former frequency range (4.5 kHz: 53.6 ⫾ 3.5 dB SPL; 30 kHz: 65.8 ⫾ 4.6, n ⫽ 15) (cf. Atkins and Pollack 1986). To compare coding in these two ranges, we presented stimuli at equivalent intensities relative to threshold (20 dB above threshold unless otherwise stated, denoted as ⫹20 dB). Figure 1A shows excerpts of the responses of a single ON1 to repeated presentations of RAM stimuli with the identical modulation envelope but with carrier frequency of either 4.5 or 30 kHz. The spiking patterns differ for the two stimuli. This is most obvious in the second half of the response segments shown, where ON1’s spike train more precisely reflects features of the stimulus envelope for the 30-kHz stimulus. We characterized ON1’s coding of the stimulus envelope by comparing responses to repeated presentation of the identical RAM stimulus (see METHODS). The result of this analysis, the information-transfer function, quantifies, as a function of the frequency of AM, the information content of the neuron’s spike train pertaining to changes in stimulus amplitude. These functions vary with carrier frequency (Fig. 1B). For 4.5-kHz stimuli, the rate of information transfer drops markedly for AM frequencies ⬎25 Hz; at AM frequencies ⬎50 Hz, little or no information about the AM envelope is coded in the neuron’s spike train. For 30-kHz stimuli, information rate drops more gradually, approaching 0 only at AM rates ⬎100 Hz. This is reflected by the half-width of the curve, which is greater for 30
FIG. 1. Coding of random amplitude modulation (RAM) stimuli by omega neuron 1 (ON1). A: responses of ON1 to repeated presentations of RAM stimuli with either cricket-like (4.5 kHz; left) or bat-like (30 kHz; right) carrier frequencies. Top: stimuli; middle: example spike trains; bottom: raster plots showing spike trains for 25 presentations of the stimulus. B: mean ⫾ SE information transfer function of 15 ON1s for 4.5- and 30-kHz carriers played at the same intensity (⫹20 dB) relative to threshold.
J Neurophysiol • VOL
941
kHz (4.5 kHz: 31.9 ⫾ 1.3 Hz; 30 kHz: 69.7 ⫾ 2.9 Hz; paired t-test, P ⬍ 10⫺5). Information transfer reaches higher peak rate for 4.5 kHz (1.9 ⫾ 0.1 bits/s) than for 30 kHz (1.1 ⫾ 0.1; P ⬍ 10⫺6), but the frequency at which the peak occurs is similar for the two carrier frequencies (4.5 kHz: 12.2 ⫾ 1.6 Hz; 30 kHz: 18.2 ⫾ 4.1; P ⬎ 0.1). Effects on coding of stimulus intensity and modulation depth The curves shown in Fig. 1B were derived from responses to stimuli presented at equivalent sound levels relative to threshold (⫹20 dB), with envelope SD of 3 dB. Under these conditions, mean firing rate is lower for 30-kHz stimuli (24.4 ⫾ 1.8 vs. 46.2 ⫾ 2.3 spikes/s, paired t-test, P ⬍ 10⫺5). However, this does not account for the difference in shape of the information transfer functions, which is apparent over a range of stimulus intensities and firing rates (Fig. 2, A and B). For example, firing rates are similar for responses to 4.5 kHz, 20 dB above threshold (Fig. 2A, 46.2 ⫾ 2.3 spikes/s) and 30 kHz, 30 dB above threshold (Fig. 2B, 43.7 ⫾ 3.3 spikes/s; P ⫽ 0.5), yet half-width is still greater for 30 kHz (81.7 ⫾ 2.9 vs. 31.9 ⫾ 1.3 Hz for 4.5 kHz; P ⬍ 10⫺9). Mean firing rates are also similar for the two carrier frequencies even at the same mean stimulus intensity (⫹20 dB) when modulation depth is greater (see following text), and again the information-transfer curves maintain their frequency-specific shapes (Fig. 2, C and D). For 4.5-kHz stimuli, information-transfer curves change only slightly, though significantly, with changes in stimulus intensity (Fig. 2A). Peak information rate varies slightly (though not monotonically) with intensity (ANOVA: P ⫽ 0.04), frequency at which the peak occurs increases (ANOVA: P ⬍ 10⫺7), and half-width increases (ANOVA: P ⬍ 10⫺4). For 30 kHz, peak information rate increases markedly with increasing intensity (ANOVA: P ⬍ 10⫺10), but other features of the curves are unchanged (ANOVA: frequency at which information rate is maximal, P ⫽ 0.6; half-width, P ⫽ 0.6). Coding is strongly affected by changing the depth of modulation, i.e., the SD of the stimulus envelope, even though overall (rms) sound level is constant (⫹20 dB; Fig. 2, C and D). For both carrier frequencies, the peak information-transfer rate increases with modulation depth (ANOVA: P ⬍ 10⫺5 for 4.5 kHz, P ⬍ 10⫺4 for 30 kHz), but other parameters of the information-transfer curves are unchanged. For 4.5 kHz, mean firing rate does not change significantly with modulation depth (range: 41.3 ⫾ 3.2 to 42.5 ⫾ 2.8 spikes/s ANOVA: P ⫽ 0.98), although it does increase for 30-kHz stimuli (Fig. 2D, inset; ANOVA: P ⫽ 0.03). For envelope SD of 7 dB, mean firing rate is similar for the two carrier frequencies (paired t-test, P ⫽ 0.27) although, as stated earlier, the information-transfer curves clearly differ in shape (half-widths: 37.3 ⫾ 1.9 Hz for 4.5 kHz; 108.7 ⫾ 6.2 for 30 kHz, paired t-test, P ⫽ 0.0008). ON1’s coding of information about changes in stimulus amplitude could, in principle, be accounted for by a linear relationship between amplitude and spike rate. Alternatively, this relationship might also include nonlinear components. Linear and nonlinear coding (if present) both contribute to the information-transfer functions in Figs. 1 and 2. We estimated how much information was transmitted with a linear code by reconstructing the stimulus envelope using a linear reverse filter (see METHODS). Time-domain representations of the reverse filters (i.e., the filter impulse functions) are shown in Fig.
92 • AUGUST 2004 •
www.jn.org
942
G. MARSAT AND G. S. POLLACK
FIG. 2. Effect of intensity and modulation depth on information transmission. A and B: mean information transfer rate of ON1 (n ⫽ 15) in responses to stimuli presented at various intensities (rms) above threshold (envelope SD: 3 dB) with a carrier frequency of 4.5 kHz (A) or 30 kHz (B). C and D: mean information transfer rate of ON1 (n ⫽ 10) in responses to stimuli with the same intensity relative to threshold (⫹20 dB) but different modulation depths, with a carrier frequency of 4.5 kHz (C) or 30 kHz (D). Modulation depth is quantified as the SD of the modulation envelope (see C, inset). The firing rates shown are mean ⫾ SE. Firing rate did not change in C (range: 41.3 ⫾ 3.2 to 42.5 ⫾ 2.8 spikes/s).
3A. The impulse function derived from responses to 30-kHz stimuli is narrower than that for 4.5 kHz, and latency between its peak and ON1’s action potential is shorter by several milliseconds (cf. Faulkes and Pollack 2000). The stimulus estimate derived from the response to 4.5 kHz reflects mainly slower changes in stimulus amplitude, whereas that derived from the 30-kHz response captures more rapid amplitude changes (Fig. 3B). Linear estimates of information transfer are compared with the actual information-transfer rates in Fig. 3C. For the conditions illustrated, envelope SD of 7 dB, stimulus intensity 30 dB above threshold, the linear estimates capture only a portion of the information in the spike train. Nevertheless, the information-transfer functions based on linear estimates retain their characteristic carrier-frequency-specific shapes (half-width: 33.3 ⫾ 1.1 vs. 86.7 ⫾ 12.4 Hz; frequency of maximum information: 15.3 ⫾ 3.1 vs. 28.6 ⫾ 0.8 Hz; maximum information rate: 1.57 ⫾ 0.06 vs. 0.75 ⫾ 0.02 bits/s; 4.5 vs. 30 kHz, respectively; P ⬍ 0.001 for all comparison). As shown in Fig. 2, the information transfer rate increases with increasing stimulus intensity and envelope SD. Total information transfer can be partitioned into linear and nonlinear components (Fig. 3D). For 4.5-kHz stimuli, both linear and nonlinear components increase in parallel, but for 30-kHz stimuli, the increase in information is due predominantly to a marked increase in the nonlinear component. For 30-kHz stimuli with high intensity and SD, linear coding accounts for ⬍20% of the overall information content of ON1’s spiking response. Responses to SAM stimuli For computational reasons, our analysis of information transfer excluded the initial few seconds of the response (see METHODS), but behavioral responses (avoidance of ultrasound; attraction to cricket song) occur with short latency J Neurophysiol • VOL
[avoidance: 25–70 ms (Nolen and Hoy 1986) attraction: 300 – 400 ms (Pollack 2003)]. Another way to assess temporal coding, which can be applied even to the early portion of a response, is to examine responses to SAM stimuli. For low AM frequencies, ON1’s initial response captures the temporal structures of SAM stimuli with both 4.5- and 30-kHz carrier frequencies; however for high AM frequencies, the spike train reflects the amplitude envelope only for the 30-kHz stimulus (Fig. 4). We examined coding of SAM stimuli quantitatively by plotting the relationships between synchronization coefficient and AM frequency (synchronization-coefficient modulation transfer function: scMTF) and between firing rate and SAM frequency (firing-rate modulation transfer function: frMTF). To analyze synchronization during the initial portion of the response, we computed synchronization coefficients for responses to the first four cycles of AM. Initial synchronization is best at lower AM frequencies for both 4.5- and 30-kHz stimuli (Fig. 5A). However, synchronization to high AM frequencies is better for ultrasound stimuli (ANOVA, P ⬍ 0.0001; Tukey test, P ⬍ 0.05 for AM rates 45, 65, and 100 Hz), resulting in a less sharply tuned scMTF (half-widths: 36.2 ⫾ 11.4 for 4.5 kHz and 63.7 ⫾ 30.5 for 30 kHz; P ⫽ 0.008). We measured initial firing rate as the maximum instantaneous rate (i.e., inverse of the smallest interspike interval) during the response to the first cycle of AM. This measure thus reflects sensitivity to the rate of change of amplitude rather than to the repetition rate of AM cycles. For both carrier frequencies, instantaneous firing rate was low for low AM frequencies and increased to an approximate plateau (Fig. 5B). For rates ⬎25 Hz, however, firing rate was higher for ultrasound stimuli, (ANOVA, P ⬍ 0.0001; Tukey test, P ⬍ 0.05 for all AM frequencies ⬎25 Hz). We also examined coding of SAM stimuli after adaptation was established, by computing MTFs for the response during the last 10 s of a 15-s stimulus. As for the initial response, synchronization at high AM frequencies was greater for ultra-
92 • AUGUST 2004 •
www.jn.org
FREQUENCY-SPECIFIC TEMPORAL CODING OF ACOUSTIC SIGNALS
943
Coding properties of auditory receptor neurons
FIG. 3. Nonlinearity of ON1’s coding. A: impulse responses of ON1’s linear reverse filters for RAM stimuli with 4.5- or 30-kHz carrier frequency (intensity ⫹20 dB, envelope SD: 3 dB). Thin lines represent individual neurons (n ⫽ 10); thick lines are their means. The vertical arrow indicates the timing of ON1’s spike. B: estimates, for a representative ON1, of stimulus modulation envelopes determined by linear reverse reconstruction. C: comparison of information-transfer curves representing actual information and information coded linearly. Curves are means of five neurons. Stimulus intensity (rms): 30 dB above threshold; SD of the modulation envelope: 7 dB. D: total information rate (summed over all AM frequencies) for stimuli with different mean intensities, modulation depths (i.e., envelope SDs), and carrier frequencies. Information transmission that cannot be accounted for by linear coding (white) is is attributed to nonlinear coding (gray). Data are means ⫾ SE of 5 neurons.
sound stimuli (Fig. 5C; ANOVA, P ⬍ 0.0001; Tukey test, P ⬍ 0.05 for AM rates ⬎25 Hz). However, the frMTF differed markedly from that at the onset of the response. Whereas instantaneous firing rate at response onset is greater for 30 kHz, during the adapted portion of the response, mean firing rate is lower for 30 kHz (ANOVA, P ⬍ 10⫺6; Fig. 5D). The frMTFs for the two carrier frequencies also differ in shape. Firing reaches a peak at higher SAM frequencies for 30 kHz carrier than for 4.5 kHz (median frequency: 45 Hz for 30 kHz, 18 Hz for 4.5 kHz, Wilcoxon test, P ⫽ 0.002). J Neurophysiol • VOL
ON1’s coding properties might simply mirror the coding properties of auditory receptor neurons. We examined this possibility by recording receptor responses to RAM stimuli. Based on frequency sensitivity, receptors fall into three groups, which are most sensitive to the low frequencies that occur in cricket song (low-frequency receptors), to ultrasound, or to a mid-range of frequencies (Imaizumi and Pollack 1999). Most of the latter also respond strongly to ultrasound; here, we consider these last two groups together as high-frequency receptors. Low-frequency receptors comprise two distinct groups that differ in anatomy as well as in a number of physiological parameters, including threshold (Imaizumi and Pollack 2001). Based on anatomy, low-frequency receptors are either MT types (midline-terminating) or BC types (bifurcating arbors). The former type has lower threshold. Receptors with threshold, at 4.5 kHz, ⱕ55 dB SPL were classed here as low-threshold (putative MT types), and those with thresholds ⱖ65 dB SPL as high-threshold (putative BC types). Six receptors of each threshold class were stained with Lucifer yellow; in all cases, their structures matched their putative anatomical designation. We also stained four high-frequency receptors; their structures also matched that described previously (Imaizumi and Pollack 2001) for mid-frequency and ultrasound receptors (which are anatomically indistinguishable). ON1’s frequency-specific coding properties differ from those of receptors. Information-transfer functions of receptors (Fig. 6) peak at higher AM frequencies and are broader than the corresponding functions for ON1 (i.e., low-frequency receptors vs. ON1’s response to 4.5-kHz carrier; high-frequency receptors vs. ON1’s response to 30-kHz carrier; see figure legend for statistics). Surprisingly, for the stimulus conditions we used (10 –15 dB above threshold, envelope SD of 3 dB), only 4 of the 10 low-threshold, low-frequency receptors that we recorded showed statistically significant coding of the stimulus envelope as assayed by jackknife resampling (Efron and Tibshirani 1993); Fig. 6A includes only these four receptors. All of the high-threshold, low-frequency receptors significantly coded the stimulus envelope (Fig. 6B). Informationtransfer rates of both groups of low-frequency receptors are
FIG. 4. Responses to sinusoidally amplitude-modulated (SAM) stimuli vary with carrier frequency. Top: SAM stimuli, middle: ON1 spike trains, and bottom: instantaneous firing rate, i.e., inverse of inter-spike interval for lowand high SAM frequencies (left and right, respectively), for stimuli with 4.5and 30-kHz carriers (top and bottom), at rms intensity 20 dB above threshold.
92 • AUGUST 2004 •
www.jn.org
944
G. MARSAT AND G. S. POLLACK
FIG. 5. Modulation transfer functions. A: mean ⫾ SE synchronization coefficient (SC) of responses of 17 ON1s as a function of SAM frequency, calculated for the 1st 4 cycles of stimulation. B: maximum firing rate during the response to the 1st cycle. C: synchronization coefficient during the adapted portion of the response, i.e., starting 5 s after sound onset. D: mean firing rate of the adapted response.
lower than that of ON1. By contrast, information rates of high-frequency receptors (all of which coded significantly) are higher than that of ON1 (Fig. 6C). As for ON1 (see Fig. 3D), coding by receptors includes both linear and nonlinear components (Fig. 6D). For 4.5-kHz stimuli of equivalent intensity and modulation depth (envelope SD, 3 dB), the proportion of the total information transfer ascribed to nonlinear coding is similar for receptor neurons and ON1 (low-frequency, low-threshold receptors versus ON1, 10 dB above threshold: P ⬎ 0.3; low-frequency, high-threshold receptors versus ON1, 30 dB above threshold: P ⬎ 0.15). For 30-kHz stimuli, however, nonlinear coding is more pronounced in ON1 than in receptors (high-frequency receptors vs. ON1, 10 dB above threshold: P ⬍ 0.02). Frequency-specific coding characteristics do not require contralateral inhibition Wiese and Eilts (1985) suggested that ON1’s temporal selectivity is determined by the dynamics of reciprocal inhibition between the left and right ON1s. We tested this hypothesis by comparing information-transfer functions before and after cutting the contralateral auditory nerve, thus removing input from the contralateral ear. Information-transfer curves were largely unaffected by unilateral deafening (Figs. 7A) although, for 4.5-kHz stimuli, there was a slight increase in peak information-transfer rate and decrease in the frequency at which information is maximal (paired t-test; P ⫽ 0.03 in both cases). Responses to SAM stimuli were also similar before and after removing contralateral input. As expected, mean firing rate increased when contralateral inhibition was removed, but the shapes of the frMTFs were unchanged (Fig. 7B; no difference in SAM frequency of maximal firing rate: Wilcoxon test, P ⬎ 0.5 for 4.5 kHz and P ⬎ 0.3 for 30 kHz). Similarly, the shapes of the scMTFs were unaffected (Fig. 7C; no difference in half-width, paired t-test, P ⬎ 0.5 for both carriers). Coding properties and natural stimuli ON1’s frequency-specific temporal coding properties are well suited to behavioral requirements. In Fig. 8A, we compare J Neurophysiol • VOL
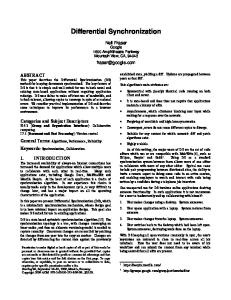
ON1’s information-transfer curve for cricket-like carrier with the temporal structure of the species’ calling song. It is clear that ON1’s coding properties are well matched to the song’s structure. We also show behavioral selectivity for stimuli consisting of sound pulses presented at different rates (Pollack and El-Feghaly 1993). These stimuli differ substantially from the RAM stimulus used to derive the information-transfer function, and so behavioral and neural curves are not directly comparable. Nevertheless, the behavioral curve is centered on only one peak in the song spectrum, whereas ON1’s coding includes the entire song spectrum, Thus ON1’s coding properties do not appear to account for behavioral selectivity. Figure 8B shows ON1’s information-transfer function for bat-like stimuli, along with the ranges of pulse rates found in the calls of several species of bat. ON1’s enhanced coding of high AM frequencies encompasses much of the range of pulse rates in these bat sounds. In addition, bat pulses may be very brief (⬍2 ms) (Jones 1999; Jones and Corben 1993) and thus rapidly modulated in amplitude. Such stimuli elicit strong, phase-locked responses in ON1 (see Fig. 5, A and B). DISCUSSION
Coding characteristics The temporal characteristics of ON1’s response differ for cricket- and bat-like sound frequencies. Information in ON1’s spike train about stimuli with cricket-like carrier frequency is restricted to a narrow range of AM frequencies below ca. 32 Hz, similar to the range of temporal components of intraspecific communication signals. The drop off of information is more gradual for bat-like carrier frequencies, extending ON1’s coding into the higher range of AM frequencies that occur in bat echolocation signals (Fig. 8). ON1’s differential coding of signals with cricket- and bat-like carriers is also apparent in its ability to synchronize to SAM stimuli, as well as in its firing rates to such stimuli. Thus these two approaches to studying temporal coding lead to qualitatively similar conclusions. A limitation of the information-theoretic approach is that it cannot be used to characterize coding during the initial, nonstationary portion of the response, even though it is during this
92 • AUGUST 2004 •
www.jn.org
FREQUENCY-SPECIFIC TEMPORAL CODING OF ACOUSTIC SIGNALS
period that behavioral responses are initiated. Avoidance responses to ultrasound, in particular, are initiated after only a few spikes in AN2, occurring with high instantaneous rate (Nolen and Hoy 1984, 1986). We characterized coding by ON1 during this period using responses to SAM stimuli. Like AN2, ON1 responds strongly at the onset of ultrasound stimuli, with instantaneous firing rate approaching 500 spikes/s. Moreover, maximum instantaneous firing rate is highest for stimuli with rapid rates of AM (Fig. 5B), a characteristic of bat sound pulses. Thus ON1s initial response to ultrasound is well suited to influence even the onset of ultrasound-elicited behavioral responses. Moreover, neither ultrasound-avoidance responses nor attraction to cricket songs are restricted to only the first few milliseconds after stimulus onset. Positive phonotaxis to cricket-song stimuli persists for minutes (e.g., Pollack and ElFeghaly 1993). Recent infrared movies of bat-insect encounters show that these may continue for several seconds as the bat
945
follows its intended prey through successive evasive maneuvers (Simmons 2003). Although ON1’s responses to SAM stimuli change as it adapts, its temporal coding characteristics remain well matched to the structures of cricket songs and bat calls (Fig. 5, A and C). Nabatiyan et al. (2003) also studied temporal selectivity of ON1 of another cricket species, Gryllus bimaculatus. Their stimuli were trains of sound pulses with cricket-like carrier frequency presented at different pulse rates. They found that maximum instantaneous firing rate per pulse increased with increasing pulse period, reaching a plateau at the pulse period that occurs in the species’ song. They present a model in which the number of spike-rate peaks per chirp varies in a band-pass manner with pulse period, mirroring the behavioral effectiveness of the stimuli. Because of differences in the design of stimuli, we cannot compare our results directly with theirs. However, the coding properties that we describe do not appear to account for behavioral selectivity to temporal pattern (Fig. 8A). Schildberger (1984) described neurons in the brain that respond selectively to behaviorally effective sound-pulse rates. Anatomical evidence suggests that the source of input to these brain circuits is the ascending neurons, AN1 and AN2. If ON1 (which, in mature adults, is a local, prothoracic neuron) (Atkins and Pollack 1986) affects brain recognition circuits, it must do so indirectly, through its inhibition of the ascending neurons. ON1’s coding properties include both linear and nonlinear components. The nonlinear component is most evident for responses to higher intensities and larger envelope SDs. The underlying cause may be high-intensity in both cases; because rms intensity was held constant, peak stimulus intensity increased with envelope SD (see Fig. 2C, inset). The nonlinear contribution to coding was much more pronounced for 30-kHz FIG. 6. Information-transfer functions of receptor neurons. Stimuli were presented at 10 –15 dB above threshold, with either 4.5-kHz (A and B) or 30-kHz (C) carrier frequency. A: coding by low-frequency, low-threshold, receptor neurons. Only 4 of the 10 receptors that we recorded significantly coded the stimulus temporal pattern as assayed by jackknife resampling (Efron and Tibshirani 1993). Information-transfer functions for the noncoding receptors are not shown. Mean stimulus intensity for the receptor neurons was 62.5 dB SPL. Coding of 4.5-kHz stimuli by ON1, at mean intensity of 63.6 dB SPL (10 dB above threshold), is also shown for comparison. Key applies to B and C as well. Frequency at which information transfer is maximum: ON1, 4.6 ⫾ 0.8 (SE) Hz; receptors that coded significantly, 42.5 ⫾ 22.9 Hz; t-test, P ⬍ 0.004. Half-widths: ON1, 24.5 ⫾ 1.6 Hz; receptors that coded significantly, 86.9 ⫾ 16.0 Hz; P ⬍ 10⫺5. Maximum information rate: ON1, 1.5 ⫾ 0.1 bits/s; receptors that coded significantly, 0.7 ⫾ 0.1 bits/s; P ⬍ 0.001. B: as in A except comparing low-frequency, high-threshold receptors (mean stimulus intensity: 79.6 dB SPL) and ON1, 4.5-kHz responses (mean intensity 83.6 dB SPL; 30 dB above threshold). All of the low-frequency, high-threshold receptors coded significantly. Frequency at which information transfer is maximum: ON1, 20.4 ⫾ 1.9 Hz; receptors, 46.7 ⫾ 5.6 Hz; P ⫽ 0.0003. Half-widths: ON1, 34.7 ⫾ 1.5 Hz; receptors, 119.8 ⫾ 9.2 Hz; P ⬍ 10⫺5. Maximum information rate: ON1, 1.6 ⫾ 0.1 bits/s; receptors: 0.9 ⫾ 0.1 bits/s; P ⬍ 0.009. C: coding by high-frequency receptors (mean stimulus intensity: 76.5 dB SPL) and ON1, 30-kHz responses, mean stimulus intensity 75.8 dB SPL (10 dB above threshold). All of the high-frequency receptors coded significantly. Frequency at which information transfer is maximum: ON1, 19.1 ⫾ 3.5 Hz; receptors, 47.6 ⫾ 5.0 Hz; P ⫽ 0.0002; half-widths: ON1, 69.7 ⫾ 6.1 Hz; receptors, 91.1 ⫾ 4.5 Hz, P ⫽ 0.001. Maximum information rate: ON1, 0.8 ⫾ 0.1 bits/s; receptors: 1.6 ⫾ 0.1 bits/s; P ⬍ 0.0009. D: mean ⫾ SE total information rate of receptors. All low-threshold, low-frequency receptor neurons were included, rather than only those with significant coding, so as not to over-represent the total information carried by this receptor class. Information transmission that cannot be accounted for by linear coding (white) is is attributed to nonlinear coding (gray).
J Neurophysiol • VOL
92 • AUGUST 2004 •
www.jn.org
946
G. MARSAT AND G. S. POLLACK
1997). Nonlinear coding also increases with stimulus intensity in wind-sensitive sensory neurons of cricket cerci (Roddey et al. 2000). In this case, however, nonlinearity is most prominent for stimulus frequencies that are poorly coded at low intensities. As a result, selective coding of particular frequencies is lost as intensity increases. Enhanced coding of behaviorally relevant features of natural stimuli, as we have shown for ON1, has been described previously. For example, in auditory receptors of bullfrogs and grasshoppers, the rate of information transmission is highest for signals with temporal structures similar to those of conspecific communication signals (Machens et al. 2001; Rieke et al. 1995). Similarly, coding of AM by electroreceptors of weakly electric fish improves as the bandwidth of the stimulus envelope is restricted to match the range of AM frequencies found in natural signals (Wessel et al. 1996). Recently, it has been shown that neurons in the brains of electric fish also exhibit different coding properties specific to signal geometries characteristic of signals from prey and conspecifics (Chacron et al. 2003). Like ON1, these neurons have different coding properties for different behaviorally relevant signals.
FIG. 7. Effects of removal of contralateral input on temporal coding. Curves are means ⫾ SE (n ⫽ 10). A: information tranfer functions. B: mean adapted firing rate as a function of AM frequency. C: mean synchronization coefficient (during the adapted portion of the response) as a function of AM frequency.
stimuli. Other features of our data also point to nonlinear response properties for this carrier frequency. Mean firing rate increases at greater-than-linear rate with increasing intensity of 30-kHz RAM stimuli over the range of intensities 10 –30 dB above threshold, whereas the increase for 4.5-kHz stimuli is approximately linear (see Fig. 2B, inset). Moreover, when stimulus intensity was held constant, mean firing rate increased with envelope SD (and thus peak stimulus intensity), but only for 30-kHz stimuli. Increasingly nonlinear coding with increasing stimulus intensity has been described previously. In the visual system of flies, linear coding accurately describes the responses of motion-sensitive interneurons, provided that the changes in velocity of the stimulus are small. For larger changes in velocity, nonlinear coding accounts for a substantial fraction of the information. As for ON1, the shape of the function describing coding as a function of stimulus frequency is similar whether or not nonlinear coding is taken into account (Haag and Borst J Neurophysiol • VOL
FIG. 8. Comparison of ON1’s temporal coding with the temporal structures of behaviorally relevant sounds. A: mean normalized information-transfer function of ON1 for RAM stimuli with 4.5-kHz carrier (mean stimulus intensity 73. 6 dB SPL, 20 dB above threshold), together with the spectrum of the amplitude envelope of the calling song of T. oceanicus (derived by FFT analysis of 10-s-long song segments from each of 6 crickets). Also shown is the temporal selectivity of behavioral responses to song models (70 dB SPL) (data from Pollack and El-Feghaly 1993). B: information transfer function for 30-kHz stimuli, (mean stimulus intensity 95.8 dB SPL, 30 dB above threshold) together with the ranges of pulse repetition rates produced by 6 species of insectivorous bat (Kulzer et al. 1984; Schnitzler and Kalko 2001; Wimsalt 1970) (South-eastern Australian bat call library, http://batcall.csu.edu.au/ batcall/batcall1.html), indicated by horizontal bars. The top 2 bars represent species that occur in the same region of Australia as T. Oceanicus. The remaining species are representative of genera that also occur in this region.
92 • AUGUST 2004 •
www.jn.org
FREQUENCY-SPECIFIC TEMPORAL CODING OF ACOUSTIC SIGNALS
Possible mechanisms Receptor neurons implement a first stage of temporal filtering, with broad selectivity to low AM rates (Fig. 6). Selectivity of ON1 for ultrasound stimuli is only slightly sharper than that of high-frequency receptors. For 4.5-kHz sound frequencies, this second stage of filtering is much sharper. The difference in the range of AM frequencies coded by ON1 for the two carrier frequencies cannot be explained by sharper filtering by lowfrequency receptors compared with ultrasound receptors. Wiese and Eilts (1985) proposed that temporal selectivity of ON1 might result from inhibitory interactions with its contralateral partner. In this case, the characteristics of contralateral inhibition would be expected to differ for low- and high-carrier frequencies. Indeed, the timing of contralateral inhibition does differ for these two frequencies (Faulkes and Pollack 2000). However, we found nearly no difference in ON1’s temporal coding properties, either in information transfer functions or in the MTFs, when its contralateral partner was deafferented. In our experiments, stimuli were presented from an azimuth of 90° on the neuron’s most sensitive side, a location that would only weakly stimulate the contralateral ON1 (Pollack 1986). We cannot rule out the possibility that, for stimuli arising closer to the midline, the resulting stronger contralateral inhibition might influence temporal coding. Nevertheless, the fundamental coding properties that we describe do not require contralateral inhibition. Mechanisms contributing to temporal filtering in other systems include synaptic plasticity (Fortune and Rose 2000), passive filtering, active conductances (Fortune and Rose 1997), and network structure (Grothe 1994; see Pollack 2001 for review). If passive filtering were to explain ON1’s properties, receptor neurons tuned to low and to high sound frequencies would be expected to terminate at different regions within ON1s dendritic tree. One subset of low-frequency receptors (MT) and ultrasound receptors terminate in nearly the same region of auditory neuropil, overlapping with ON1’s dense dendritic branches (Imaizumi 2000; Imaizumi and Pollack 2001). It seems unlikely that passive filtering would differ greatly for inputs from these two groups of receptor neurons. The other subset of low-frequency receptors (BC) terminate lateral and posterior of ON1’s dense dendritic arbor and probably make few if any direct connections with ON1 (Imaizumi and Pollack 2001; Pollack and Imaizumi 1999). Nevertheless, the nature of input from low-frequency and ultrasound receptors to ON1 differs markedly. Ultrasound receptors elicit large, monosynaptic, unitary excitatory postsynaptic potentials (EPSPs) (Faulkes and Pollack 2001), whereas discrete, unitary EPSPs are not seen for low-frequency stimuli; rather, a smooth, graded depolarization occurs (Pollack 1994). This might result from summation of small, monosynaptic EPSPs from many low-frequency receptors. Consistent with this, low-frequency receptors outnumber high-frequency receptors by a factor of 3– 4 (Imaizumi and Pollack 1999, 2001). Moreover, the information content of responses of single low-frequency receptors is less than that of ON1 (Fig. 6), suggesting that pooling of inputs from many receptors may be required to account for ON1’s coding properties. By contrast, information content of single high-frequency receptors exceeds that of ON1, suggesting that pooling might not be required in this case. J Neurophysiol • VOL
947
Another possible explanation for the difference in EPSPs elicited by low and high frequencies is that low-frequency input to ON1 may be mainly polysynaptic (Faulkes and Pollack 2001). If the putative intervening neuron(s) were nonspiking, then a smooth, graded EPSP might be expected in ON1. In any case, low-frequency-elicited EPSPs in ON1 rise and decay more slowly than those evoked by ultrasound, and it is possible that this difference in EPSP shape contributes to ON1’s temporal properties. Of course, if ON1’s low-frequency input is primarily polysynaptic, then its filtering properties for lowfrequency stimuli may be imposed by the intervening circuitry. Behavioral significance ON1 enhances binaural contrast through contralateral inhibition, thus facilitating sound localization (Atkins et al. 1984; Horseman and Huber 1994; Schildberger and Ho¨ rner 1988). Among ON1’s contralateral targets are the ascending neurons AN1 and AN2, which carry information about cricket songs and bat calls, respectively, to the brain. The timing and strength of ON1’s response to a temporally patterned stimulus will thus influence its inhibition of its targets (Faulkes and Pollack 2000). We hypothesize that ON1’s frequency-specific coding of temporal pattern affects the efficiency of contralateral inhibition so as to maximize bilateral differences among its targets specifically for stimuli with both the carrier frequencies and temporal structures of behaviorally relevant signals. This would enhance localization cues precisely for those stimuli that must be localized, whereas less relevant sounds would be perceived as spatially more diffuse. Thus the coding properties we describe might implement a type of spatially selective attention. ACKNOWLEDGMENTS
We thank Drs. Ronald Chase and Ru¨ diger Krahe for comments on an earlier version of this manuscript. GRANTS
This work was supported by the Natural Sciences and Engineering Research Council and Canadian Institute of Health Research. REFERENCES
Atkins G, Ligman S, Burghardt F, and Stout JF. Changes in phonotaxis by the female Acheta domesticus L. after killing identified acoustic interneurons. J Comp Physiol [A] 154: 795– 804, 1984. Atkins G and Pollack GS. Age dependent occurrence of an ascending axon on the omega neuron of the cricket, Teleogryllus oceanicus. J Comp Neurol 243: 527–534, 1986. Atkins G and Pollack GS. Correlation between structure topographic arrangement and spectral sensitivity of sound sensitivity of sound-sensitive interneurons in crickets. J Comp Neurol 266: 398 – 412, 1987. Balakrishnan R and Pollack GS. Recognition of courtship song in the field cricket, Teleogryllus oceanicus. Anim Behav 51: 353–356, 1996. Borst A and Theunissen FE. Information theory and neural coding. Nat Neurosci 2: 947–957, 1999. Chacron MJ, Doiron B, Maler L, Longtin A, and Bastian J. Non-classical receptive field mediates switch in a sensory neuron’s frequency tuning. Nature 423:77, 2003. Clague H, Theunissen F, and Miller JP. Effects of adaptation on neural coding by primary sensory interneurons in the cricket cercal system. J Neurophysiol 77: 207–220, 1997. Efron B and Tibshirani RJ. An Introduction to the Bootstrap. New York: Chapman, 1993.
92 • AUGUST 2004 •
www.jn.org
948
G. MARSAT AND G. S. POLLACK
Faulkes Z and Pollack GS. Effects of inhibitory timing on contrast enhancement in auditory circuits in crickets (Teleogryllus oceanicus). J Neurophysiol 84: 1247–1255, 2000. Faulkes Z and Pollack GS. Mechanisms of frequency-specific responses of omega neuron 1 in crickets (Teleogryllus oceanicus): a polysynaptic pathway for song? J Exp Biol 204: 1295–1305, 2001. Fortune ES and Rose GJ. Passive and active membrane properties contribute to low-pass temporal filtering in Eigenmannia. J Neurosci 17: 3815–3825, 1997. Fortune ES and Rose GJ. Short-term synaptic plasticity contributes to the temporal filtering of electrosensory information. J Neurosci 20: 7122–7130, 2000. Ghazanfar AA, Flombaum JI, Miller CT, and Hauser MD. The units of perception in the antiphonal calling behavior of cotton-top tamarins (Saguinus oedipus): Playback experiments with long calls. J Comp Physiol [A] 187: 27–35, 2001. Goldberg JM and Brown PB. Functional organization of the dog superior olivary nucleus: an anatomical and electrophysiological study. J Neurophysiol 31: 639 – 656, 1969. Grothe B. Interaction of excitation and inhibition in processing of pure tone and amplitude-modulated stimuli in the medial superior olive of the mustached bat. J Neurophysiol 71: 706 –721, 1994. Haag J and Borst A. Encoding of visual motion information and reliability in spiking and graded potential neurons. J Neurosci 17: 4809 – 4819, 1997. Horseman G and Huber F. Sound localization in crickets. II. Modeling the role of a simple neural network in the prothoracic ganglion. J Comp Physiol [A] 175: 399 – 413, 1994. Imaizumi K. Peripheral representation of sound frequency in cricket auditory system: beyond tonotopy (PhD thesis). Montreal, Quebec, Canada: McGill University, 2000. Imaizumi K and Pollack GS. Neural coding of sound frequency by cricket auditory receptors. J Neurosci 19: 1508 –1516, 1999. Imaizumi K and Pollack GS. Neural representation of sound amplitude by functionally different auditory receptors in crickets. J Acoust Soc Am 109: 1247–1260, 2001. Jones G. Scaling of echolocation call parameters in bats. J Exp Biol 202: 3359 –3367, 1999. Jones G and Corben C. Echolocation calls from six species of Microchiropteran bats in south-eastern Queensland. Aust Mammal 16: 35–38, 1993. Kulzer E, Nelson JE, McKean JL, and Moehres FP. Prey catching behavior and echolocation in the Australian ghost bat, Macroderma gigas (Microchiroptera: Megadermatidae). Aust Mamm 7: 37–50, 1984. Machens CK, Stemmler MB, Prinz P, Krahe R, Ronacher B, and Herz AV. Representation of acoustic communication signals by insect auditory receptor neurons. J Neurosci 21: 3215–3227, 2001. Nabatiyan A, Poulet JFA, Polavieja GG, and Hedwig B. Temporal pattern recognition based on instantaneous spike rate coding in a simple auditory system. J Neurophysiol 90: 2484 –2493, 2003. Nagarajan SS, Cheung SW, Bedenbaugh P, Beitel RE, Schreiner CE, and Merzenich MM. Representation of spectral and temporal envelope of twitter vocalization in common marmoset primary auditory cortex. J Neurophysiol 87: 1723–11737, 2002. Nolen TG and Hoy RR. Initiation of behavior by single neurons: the role of behavioral context. Science 226: 992–994, 1984. Nolen TG and Hoy RR. Phonotaxis in flying crickets. I. Attraction to the calling song and avoidance of bat-like ultrasound are discrete behaviors. J Comp Physiol [A] 159: 423– 439, 1986. Pollack GS. Discrimination of calling song models by the cricket, Teleogryllus oceanicus: the influence of sound direction on neural encoding of the stimulus temporal pattern and on phonotactic behavior. J Comp Physiol [A] 158: 549 –561, 1986.
J Neurophysiol • VOL
Pollack GS. Synaptic inputs to the omega neuron of the cricket Teleogryllus oceanicus: differences in EPSP waveforms evoked by low and high frequencies. J Comp Physiol [A] 174: 83– 89, 1994. Pollack GS. Neural processing of acoustic signals. In: Comparative Hearing: Insects, edited by Hoy RR, Popper AN, and Fay RR, New York: Springer, 1998, p. 139 –196. Pollack GS. Analysis of temporal patterns of communication signals. Curr Opin Neurobiol 11: 734 –738, 2001. Pollack GS. Sensory cues for sound localization in the cricket Teleogryllus oceanicus: interaural difference in response strength versus interaural latency difference. J Comp Physiol [A] 189: 143–151, 2003. Pollack GS and El-Feghaly E. Calling song recognition in the cricket Teleogryllus oceanicus: comparison of the effects of stimulus intensity and sound spectrum on selectivity for temporal pattern. J Comp Physiol [A] 171: 759 –765, 1993. Pollack GS and Imaizumi K. Neural analysis of sound frequency in insects. Bioessays 21: 295–303, 1999. Press WH, Flanney BP, Teukolsky SA, and Vetterling, WT. Numerical Recipes in C: The Art of Scientific Computing. Cambridge, MA: Cambridge University Press, 1992. Rieke F, Bodnar DA, and Bialek W. Naturalistic stimuli increase the rate and efficiency of information transmission by primary auditory afferents. Proc R Soc Lond B Biol Sci 262: 259 –265, 1995. Rieke F, Warland D, de Ruyter van Steveninck R, and Bialek W. Spikes: Exploring the Neural Code. Cambridge, MA: MIT Press, 1997. Roddey JC, Girish B, and Miller JP. Assessing the performance of neural encoding models in the presence of noise. J Comput Neurosci 8: 95–112, 2000. Schildberger K. Temporal selectivity of identified auditory neurons in the cricket brain. J Comp Physiol [A] 155: 171–185, 1984. Schildberger K and Ho¨rner M. The function of auditory neurons in cricket phonotaxis. I, Influence of hyperpolarisation of identified neurons on sound localization. J Comp Physiol [A] 163: 621– 631, 1988. Schnitzler HU and Kalko EKV. Echolocation by insect-eating bats. Bioscience 51: 557:569, 2001. Selverston AI, Kleindienst HU, and Hubert F. Synaptic connectivity between cricket auditory interneurons as studied by photoinactivation. J Neurosci 5: 1283–1292, 1985. Shannon RV, Zeng FG, Kamath V, Wygonski J, and Ekelid M. Speech recognition with primarily temporal cues. Science 270: 303–305, 1995. Simmons JA. Observing echolocating bats in real time at night. First Conference on Acoustic Communication by Animals, College Park, MD, 2003. Strausfeld NJ, Seyan HS, Wholers D, and Bacon JP. Lucifer yellow histology. In: Functional neuroanatomy, edited by Strausfeld NJ. Berlin: Spinger-Verlag, 1983, p. 132–155. Theunnissen FE, Roddey JC, Stufflebeam S, Clague H, and Miller JP. Information theoretic analysis of dynamical encoding by four identified primary sensory interneurons in the cricket cercal system. J Neurophysiol 75: 1345–1364, 1996. Theunissen FE, Sen K, and Doupe AJ. Spectro-temporal receptive fields of non-linear auditory neurons obtained using natural sounds. J Neurosci 20: 2315–2331, 2000. Wessel R, Koch C, and Gabbiani F. Coding of time-varying electric field amplitude modulations in a wave-type electric fish. J Neurophysiol 75: 2280 –2293, 1996. Wiese K and Eilts K. Evidence for matched frequency dependence of bilateral inhibition in the auditory pathway of Gryllus bimaculatus. Zool Jb Physiol 89: 181–201, 1985. Wimsalt WA. Biology of bats. New York: Academic, 1970.
92 • AUGUST 2004 •
www.jn.org