2722
IEEE JOURNAL ON SELECTED AREAS IN COMMUNICATIONS, VOL. 31, NO. 12, DECEMBER 2013
Dynamic Request Splitting for Interactive Cloud Applications Mohammad Hajjat, Shankaranarayanan P N, David Maltz, Sanjay Rao, and Kunwadee Sripanidkulchai
Abstract—Deploying interactive applications in the cloud is a challenge due to the high variability in performance of cloud services. In this paper, we present Dealer– a system that helps geo-distributed, interactive and multi-tier applications meet their stringent requirements on response time despite such variability. Our approach is motivated by the fact that, at any time, only a small number of application components of large multi-tier applications experience poor performance. Dealer continually monitors the performance of individual components and communication latencies between them to build a global view of the application. In serving any given request, Dealer seeks to minimize user response times by picking the best combination of replicas (potentially located across different data-centers). While Dealer requires modifications to application code, we show the changes required are modest. Our evaluations on two multi-tier applications using real cloud deployments indicate the 90%ile of response times could be reduced by more than a factor of 6 under natural cloud dynamics. Our results indicate the cost of inter-data-center traffic with Dealer is minor, and that Dealer can in fact be used to reduce the overall operational costs of applications by up to 15% by leveraging the difference in billing plans of cloud instances. Index Terms—Request Splitting, Cloud Computing, Performance Variability, Interactive Multi-tier Applications, Geodistribution.
I. I NTRODUCTION LOUD computing promises to reduce the cost of IT organizations by allowing them to purchase as much resources as needed, only when needed, and through lower capital and operational expense stemming from the cloud’s economies of scale. Further, moving to the cloud greatly facilitates the deployment of applications across multiple geographically distributed data-centers. Geo-distributing applications, in turn, facilitates service resilience and disaster recovery, and could enable better user experience by having customers directed to data-centers close to them. While these advantages of cloud computing are triggering much interest among developers and IT managers [23], [42], a key challenge is meeting the stringent Service Level Agreement (SLA) requirements on availability and response times for interactive applications (e.g. customer facing web applications, enterprise applications). Application latencies directly impact business revenue [10], [15]– e.g., Amazon found every 100ms of latency costs 1% in sales [10]. Further, the SLAs typically require bounds on the 90th (and higher) percentile latencies [13], [31].
C
Manuscript received December 15, 2012; revised July 4, 2013. M. Hajjat, S. P N, and S. Rao are with Purdue University. D. Maltz is with Microsoft. K. Sripanidkulchai is with NECTEC Thailand. Digital Object Identifier 10.1109/JSAC.2013.131212.
Meeting such stringent SLA requirements is a challenge given outages in cloud data-centers [2], [11], and the high variability in the performance of cloud services [25], [35], [46], [50]. This variability arises from a variety of factors such as the sharing of cloud services across a large number of tenants, and limitations in virtualization techniques [46]. For example, [35] showed that the 95%ile latencies of cloud storage services such as tables and queues is 100% more than the median values for four different public cloud offerings. In this paper, we argue that it is critically important to design applications to be intrinsically resilient to cloud performance variations. Our work, which we term Dealer, is set in the context of geo-distributed, multi-tier applications, where each component may have replicas in multiple data-centers. Dealer enables applications to meet their stringent SLA requirements on response times by finding the combination of replicas –potentially located across multiple data-centers– that should be used to serve any given request. This is motivated by the fact that only a small number of application components of large multi-tier applications experience poor performance at any time. Multi-tier applications consist of potentially large number of components with complex inter-dependencies and hundreds of different request types all involving different subsets of components [29]. Dealer dynamically learns a model of the application that captures component interaction patterns. Application structure is abstracted as a component graph, with nodes being application components and edges capturing inter-component communication patterns. To predict which combination of replicas can result in the best performance, Dealer continually monitors the performance of individual component replicas and communication latencies between replica pairs. Operating at a component-level granularity offers Dealer several advantages over conventional approaches that merely pick an appropriate data-center to serve user requests [27], [37], [41], [47]. Modern web applications consist of many components, not all of which are present in each data-center, and the costs are extremely high to over-provision each component in every data-center to be able to handle all the traffic from another data-center. Dealer is able to redistribute work away from poorly performing components by utilizing the capacity of all component replicas that can usefully contribute to reducing the latency of requests. In large multi-tier applications (with potentially hundreds of components), it is possible that only a small number of components are temporarily impacted. Hence, redirecting entire user requests to a remote data-center leaves local
c 2013 IEEE 0733-8716/13/$31.00 �
HAJJAT et al.: DYNAMIC REQUEST SPLITTING FOR INTERACTIVE CLOUD APPLICATIONS
Front end
Business Service
Download(2)
Download(1)
BL−BE(2)
BL−BE(1)
BL1(2)
BL1(1)
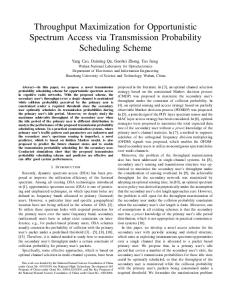
(a) Thumbnails application architecture and data-flow. The application is composed of a Front-End (FE), Back-End (BE), and two Business-Logic components BL1 (creates thumbnail) and BL2 (creates Gray-scale, rotating images).
0 BE−BL(2)
Role
5000
BE−BL(1)
Queue
FE−BE(2)
BL2 Work orker erRol Worker Role e
10000
FE−BE(1)
BL1
Upload(2)
blob
15000
Upload(1)
Role
TotalTime(2)
BE
blob
20000
Work orker erRol Worker Role e
TotalTime(1)
Load Balancer
Queue eb II Ro RoWeb II le IIS le Role SS
Delay (in msec)
FE
2723
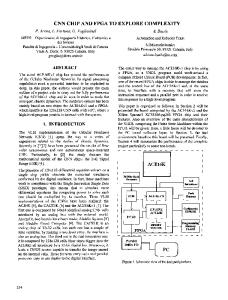
Fig. 2. Box plot for total response time, and contributing processing and communication delays for Thumbnail application.
Users Configuration Service
DB
Order Service
(b) StockTrader architecture and data-
flow. Components include a front-end (FE), Business Server (BS), Order Service (OS) (handles buys/sells), Database (DB), and a Config Service (CS) that binds all components. The precise dataflow depends on request type. Fig. 1. Applications Testbed.
functional components (already paid for) unutilized. Such money waste can be alleviated using Dealer which splits requests dynamically across replicas in remote data-centers while utilizing functional local resources to the extent possible. Additionally, in application deployments which use instances with different pricing plans (e.g., on-demand and long-term reserved instances), Dealer can utilize the difference in pricing options to even achieve more cost savings. This is because Dealer has the potential of allowing applications to use more instances with cheaper pricing plans across all remote datacenters before requiring the start of the more expensive cloud instances locally. While much of the Dealer design is independent of the particular application, integrating Dealer does require customization using application-specific logic. First, stateful applications have constraints on which component replicas can handle a given request. While Dealer proposes desired split ratios (or probabilities with which a request must be forwarded to different downstream component replicas), the application uses its own logic to determine which component replicas can handle a given request. Further, application developers must properly instrument their applications to collect the percomponent performance data needed for Dealer. However, in our experience, the work required by application developers is modest. We have evaluated Dealer on two stateful multi-tier applications on Azure cloud deployments. The first application is data-intensive, while the second application involves interactive request processing. Under natural cloud dynamics,
using Dealer improves application performance by a factor of 3 for the 90th and higher delay percentiles, compared to DNS-based data-center-level redirection schemes which are agnostic of application structure. Overall, the results indicate the importance and feasibility of Dealer. II. P ERFORMANCE AND W ORKLOAD VARIABILITY In this section, we present observations that motivate Dealer’s design. In §II-A, we characterize the extent and nature of the variability in performance that may be present in cloud data-centers. Our characterization is based on our experiences running multi-tier applications on the cloud. Then, in §II-B, we characterize the variability in workloads of multitier applications based on analyzing web server traces of a large campus university. A. Performance variability in the cloud We measure the performance variability with two applications. The first application, Thumbnail [20] involves users uploading a picture to the server (FE) and getting back either a thumbnail (from BL1) or a rotated image (from BL2). The second application, StockTrader [3], is an enterprise web application that allows users to buy/sell stocks, view portfolio, etc. Figure 1(a) and Figure 1(b) respectively show the component architecture and data-flow for each application. We ran each application independently in two separate data-centers (DC1 and DC2), both located in the U.S. Each application deployment was subjected to the same workload simultaneously, without using any load-balancing or redirection techniques across data-centers to eliminate dependency between them. Also, we note that all application components were over-provisioned properly to ensure we capture performance variability intrinsic to the cloud, rather than studying variability that may arise due to workload fluctuations. More details of how we configured the deployments are presented in §V-A. We instrumented each application to measure the total response time, as well as the delays contributing to total response time. The contributing delays include processing delays encountered at individual application components, communication delay between components (internal data-center communication delays), and the upload/download
2724
IEEE JOURNAL ON SELECTED AREAS IN COMMUNICATIONS, VOL. 31, NO. 12, DECEMBER 2013
FE
FE DB BS 1 -0.08 -0.11 DB 1 0.5 BS 1 OS
a) StockTrader
FE-BE
OS -0.04 0.03 0.14 1 FE-BS
FE-BS -0.31 -0.01 0.08 -0.37 1 FE-CS
FE-CS 0.03 -0.01 -0.02 -0.03 0.01 1 BS-CS
BS-CS -0.32 0.04 0.09 -0.4 0.87 -0.01 1 BS-OS
BS-OS -0.07 0.05 0.14 0.66 -0.31 -0.02 -0.34 1 OS-CS
OS-CS -0.04 0.02 0.14 0.74 -0.37 -0.03 -0.41 0.71 1
FE-BE BL BL-BE BE-BL 1 0.49 -0.03 0.08 BL 1 0.03 0.08 BL-BE 1 0.02 BE-BL 1
b) Thumbnail
Fig. 3. Performance correlation across components of the same application in the same data-center.
delays (Internet communication delays between users and each data-center). We now present our key findings: All application components show performance variability: Figure 2 considers the Thumbnail application and presents a box plot for the total response time (first two) and each of the individual contributing delays for each data-center. The Xaxis is annotated with the component or link whose delay is being measured and the number in parenthesis represents the data-center to which it belongs (DC1 or DC2). For example, BL-BE(1) represents the delay between the Business-Logic (BL) and the Back-End (BE) instances, at DC1. The bottom and top of each box represent the 25th and 75th percentiles, and the line in the middle represents the median. The vertical line (whiskers) extends to the highest data points within 3 × w of the upper quartile, where w is defined as the difference between the 75th and 25th percentiles. Points larger than this value are considered outliers and shown separately. Several interesting observations are shown in Figure 2. First, there is significant variability in all delay values. For instance, while the 75%ile of total response time is under 5 seconds, the outliers are almost 20 seconds. Second, while the median delay with DC1 is smaller than DC2, DC1 shows significantly more variability. Third, while the Internet upload delays are a significant portion of total response time (since the application involves uploading large images), the processing delays at BL, and the communication delays between the BE and BL show high variability, and contribute significantly to total response times. Our experiments indicate that the performance of the application components vary significantly with time, and is not always correlated with the performance of their replicas in other data-centers. Not all components in a single data-center may see poor performance simultaneously: Public clouds are highly shared platforms. In a single data-center, performance problems may impact some cloud services but not others. Such heterogeneity in performance may happen due to many factors such as multi-tenancy, software bugs, scheduled upgrades, maintenance operations, failures, etc. For example, [18] reports that a service disruption impacted only a subset of customers inside
TABLE I C ROSS - CORRELATION OF EACH COMPONENT ’ S PROCESSING TIME AND INTER - COMPONENT COMMUNICATION DELAY ACROSS TWO DATA - CENTERS , FOR Thumbnail AND StockTrader APPLICATIONS .
Response 0.09
FE-BE 0.04
Thumbnail BL 0.06
BE-BL 0.03
BL-BE 0.02
Response 0.04
FE 0.27
StockTrader BS -0.01
OS -0.02
DB 0.01
FE-BS 0.33
FE-CS 0.01
BS-OS -0.01
OS-CS -0.03
BS-CS 0.27
a data-center. It also reports that only compute services were impacted and that other resources such as storage services were performing normally in the same data-center. Figure 3 studies the cross-correlation coefficients across all combinations of total response time and constituent delays (i.e., component processing time and inter-component communication delay) for each application, in a single data-center. The tables show that while some constituent delays show some correlation in performance due to inter-component dependency (e.g., OS and BS-OS in StockTrader), we also find that many constituent delays show weak correlation. Moreover, we also investigated the periods of poor performance for both Thumbnail and StockTrader. In general, we observed that only a subset of constituent delays contribute to poor performance at any given time. Performance problems intrinsic to the cloud may impact replicas differently across data-centers: We now investigate the degree of correlation between replicas of the same component across multiple data-centers. We note that we study correlations in the absence of load-balancing techniques since our focus is on studying variability intrinsic to the cloud, rather than workload induced variability. For total response time and every contributing delay, the average value in every 30 seconds window is computed and cross-correlated with the value in the other data-center. Table I shows the correlation coefficients for each processing and communication delay across two data-centers, for all applications. The table shows that all delays show low correlation across data-centers. More generally, there have been several real world incidents where specific cloud services (e.g., storage service) have experienced performance degradation or failure in some data-centers but not others [2], [11], [18], [30]. This is due to many factors (such as power outages, software upgrades, maintenance operations, multitenancy effects, etc.) that impact data-centers differently. B. Workload Dynamics We now show the nature and extent of short-term variability in workload for multi-tier applications and the implications on cloud deployments. Short-term variability necessitates large margins even in cloud deployments: While cloud computing allows for dynamic invocation of resources during peak periods, starting up new server instances takes several minutes (typically 10 minutes) in many commercial cloud deployments today.
HAJJAT et al.: DYNAMIC REQUEST SPLITTING FOR INTERACTIVE CLOUD APPLICATIONS
5
Component 1 4
3 2 1 0 0
5
10
15
Day 5
Component 2 4
3 2 1 0 0
5
10
15
Day
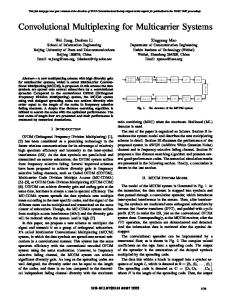
Fig. 4. Short-term variability in workload for three components in a multi-tier web-service deployed in a large campus network. The peak and average rates are computed during each 10 minutes window and the peak-to-average ratio over each window is plotted as a function of time.
Further, besides the time to provision new instances, it may take even longer to warm up a booted server; e.g., by filling its cache with relevant data to meet its SLA. Therefore, applications typically maintain margins (i.e., pools of servers beyond the expected load [22], [32], [44]) to handle fluctuations in workload. To examine workload variability and margin requirements for multi-tier applications, we collect and study the workload of a web-service in a large campus network. In the service, all requests enter through a front-end, which are then directed to different downstream components based on the type of request (e.g., web, mail, department1, department2, etc.) Figure 4 illustrates the variability in workload for the front-end and two downstream components. While the peakto-average ratio is around 1.5 for the front-end, it is much higher for each of the other components, and can be as high as 3 or more during some time periods. The figure indicates that a significant margin may be needed even in cloud deployments to handle shorter-term workload fluctuations. Margin requirements are variable and heterogeneous
2725
across different tiers of multi-tier applications: Figure 4 also shows that different application tiers may require different margins. While the margin requirement is about 50% for the front-end, it is over 300% for the other components during some time periods. In addition, the figure also illustrates that the exact margin required even for the same component is highly variable over time. The high degree of variability and heterogeneity in margins make it difficult to simply overprovision an application component on the cloud since it is complicated to exactly estimate the extent of over-provisioning required, and over-provisioning for the worst-case scenario could be expensive. Moreover, failures and regular data-center maintenance actions make the application work with lower margins and render the application vulnerable to even modest workload spikes. Workload peaks happen at different times across different tiers of multi-tier applications: We study the correlation across workload peaks seen by the different components of an application. For that, we measure the correlation coefficient between the traffic of Component1 and Component2 (Figure 4). We found out that the correlation coefficient for the two components is 0.092, which indicates the traffic patterns of the two components are not correlated and that traffic peaks happen at different times. This may limit the effectiveness of load-balancing techniques from utilizing idle resources in multi-tier applications, as we shall discuss in §V. III. Dealer D ESIGN R ATIONALE In this section, we present the motivation behind Dealer’s design, and argue why traditional approaches don’t suffice. Dealer is designed to enable applications meet their SLA requirements despite performance variations of cloud services. Dealer is motivated by two observations: (i) in any data-center, only instances corresponding to a small number of application components see poor performance at any given time; and (ii) the latencies seen by instances of the same component located in different data-centers are often uncorrelated. Dealer’s main goal is to dynamically identify a replica of each component that can best serve a given request. Dealer may choose instances located in different data-centers for different components, offering a rich set of possible choices. In doing so, Dealer considers performance and loads of individual replicas, as well as intra- and inter-data-center communication latencies. Dealer is distinguished from DNS-based [27], [41], [47] and server-side [37] redirection mechanisms, which are widely used to map users to appropriate data-centers. Such techniques focus on alleviating performance problems related to Internet congestion between users and data-centers, or coarse-grained load-balancing at the granularity of data-centers. Dealer is complementary and targets performance problems of individual cloud services inside a data-center. There are several advantages associated with the Dealer approach: • Exploit heterogeneity in margins across different components: In large multi-tier applications with potentially hundreds of components [29], only a few services might be temporarily impacted in any given data-center. Dealer can reassign work related to these services to other replicas in remote data-centers if they have sufficient margins. For instance,
2726
IEEE JOURNAL ON SELECTED AREAS IN COMMUNICATIONS, VOL. 31, NO. 12, DECEMBER 2013
C1
GTM Systems
U1
C2 Ci
Cj
DC1
... . . .
C1
U2
C2 Cj DCk Ci . . . . . .
Uk
C1
. . .
C2 Cj DCm Ci . . . TFim,jn
C1 C2
Ci
Un
Dealer
Cj
. . .
DCn
...
Fig. 5. System overview
Dealer could tackle performance problems with storage elements (e.g., a blob) by using a replica in a remote data-center, while leveraging compute instances locally. Complete request redirection, however, may not be feasible since instances of other components (e.g., business-logic servers) in the remote data-center may not be over-provisioned adequately over their normal load to handle the redirected requests. In fact, Figure 4 shows significant variation in workload patterns of individual components of multi-tier applications, indicating the components must be provisioned in a heterogeneous fashion. • Utilize functional cloud services in each data-center: Dealer enables applications to utilize cloud services that are functioning satisfactorily in all data-centers, while only avoiding services that are performing poorly. In contrast, techniques that redirect entire requests fail to utilize functional cloud services in a data-center merely due to performance problems associated with a small number of other services. Further, the application may be charged for the unutilized services (for example, they may correspond to already pre-paid reserved compute instances [1]). While Dealer does incur additional inter data-center communication cost, our evaluations in §VI-A indicate these costs are small. • Responsiveness: Studies have shown that DNS-based redirection techniques may have latencies of over 2 hours and may not be well suited for applications which require quick response to link failures or performance degradations [36]. In contrast, Dealer targets adaptations over the time-scale of tens of seconds. IV. S YSTEM D ESIGN In this section we present the design of Dealer. We begin by presenting an overview of the design, and then discuss its various components. Table II describes the summary of notations used throughout the paper. A. System Overview Figure 5 describes the high level design of our system for an application with multiple components {C1 , C2 , ..}. We consider a multi-cloud deployment where the application is deployed across n data-centers, with instances corresponding to each component located in every one of the data-centers. Note that there might be components like databases which are
only present in one or a subset of data-centers. We represent the replica of component Ci in data-center m as Cim . Traffic from users is mapped to each data-center using standard mapping services used today based on metrics such as geographical proximity or latencies [41]. Let Uk denote the set of users whose traffic is mapped to data-center k. Traffic corresponding to Uk can use the entire available capacity of all components in data-center k, as well as the excess capacity of components in all other data-centers. For each user group Uk , Dealer seeks to determine how application requests must be split in the multi-cloud deployment. In particular, the goal is to determine the number of user requests that must be directed between component i in data-center m to component j in data-center n, for every pair of combinations. In doing so, the objective is to ensure the overall delay of requests can be minimized. Further, Dealer periodically recomputes how application requests must be split given dynamics in behavior of cloud services. Complex multi-tier applications may have hundreds of different request types all involving different subsets of application components. The design of techniques for determining the exact paths of all requests remains an active area of research despite many notable recent advances [33], [38], [43]. Dealer does not require such knowledge, and instead, it dynamically learns a model of the application that captures component interaction patterns. In particular, Dealer estimates the fraction of requests that involve communication between each pair of application components, and the average size of requests between each component pair. In addition, Dealer estimates the processing delays of individual components replicas, and communication delays between components, as well as the available capacity of component replicas in each data-center (i.e., the load each replica can handle). We will discuss how all this information is estimated and dynamically updated in the later subsections.
B. Determining delays There are three key components to the estimation algorithms used by Dealer when determining the processing delay of components and communication delays between them. These include: (i) passive monitoring of components and links over which application requests are routed; (ii) heuristics for smoothing and combining multiple estimates of delay for a link or component; and (iii) active probing of links and components which are not being utilized to estimate the delays that may be incurred if they were used. We describe each of these in turn: Monitoring: Monitoring distributed applications is a well studied area, and a wide range of techniques have been developed by the research community and industry [8], [24], [28] that can be used for measuring application performance. Of these techniques, X-Trace [28] is the most suitable for our purposes, since it can track application performance at the granularity of individual requests. However, integrating the monitoring code with the application is a manual and time consuming process. To facilitate easy integration of XTrace with the application, we automate a large part of the
HAJJAT et al.: DYNAMIC REQUEST SPLITTING FOR INTERACTIVE CLOUD APPLICATIONS
TABLE II N OTATION TABLE . Uk Ci Cim W
Set of users whose traffic is mapped to data-center k. Application component i. Replica of component i in data-center m. Number of windows used for calculating the weighted moving average (WMA). D im,jn (t) Measured Delay matrix at time t. If i �= j, the delay represents the communication delay from Cim to Cjn . When i = j (m must be equal to n), the delay represents the processing delay of Cim . Dim,jn (t) Smoothed Delay matrix at time t. Each delay value is com¯ matrix puted by combining the most recent W values of D using WMA. Nim,jn (t) Number of delay samples obtained in window t for requests from Cim to Cjn (if i = j, then m = n must hold). T Fim,jn Split Ratio matrix; number of user requests that must be directed from Cim to Cjn . DR(i, t) Damping Ratio; upper bound of fraction of requests that needs to be assigned to combination i at time t. Rank(i, t) Ranking of combination i at the end of time-window t with respect to other combinations. The combination with lowest mean delay value gets a ranking of 1, and the best combination gets assigned the highest possible ranking. Req(i, t) Number of requests sent on combination i during time t.
integration effort using Aspect Oriented Programming (AOP) techniques [5]. We write an Aspect to intercept each function when it is called and after it returns, which constitutes the pointcuts. We record the respective times inside the Aspect. The measured delay values are then reported periodically to a central monitor. A smaller reporting time ensures greater agility of Dealer. We use reporting times of 10 seconds in our implementation, which we believe is reasonable. Smoothing delay estimates: It is important to trade-off the agility in responding to performance dips in components or links with potential instability that might arise if the system is overly aggressive. To achieve that, we apply smoothing on the delay estimates collected. While several techniques exist, we use the linearly weighted moving average (WMA) for its simplicity and suitability. For each link and component, the average delay and number of delay samples seen during the last W time windows of observation is considered. Then, the smoothed delay matrix is calculated as follows: Dim,jn (t) �t =
τ =t−W +1 D im,jn (τ ) ∗ (W + τ �t τ =t−W +1 (W + τ − t) ∗
− t) ∗ Nim,jn (τ ) Nim,jn (τ )
(1)
Briefly, the weight depends on the number of samples seen during a time-window, and the recency of the estimate. As Table II shows, Dim,jn (t) represents the smoothed delay matrix calculated using WMA at time-window t, Dim,jn (t) captures the measured delay matrix, and Nim,jn (t) is the number of delay samples obtained in that window. The term (W+τ -t) is a linearly increasing function that assigns higher weights to more recent time-windows (the oldest time-window gets a weight of 1, and the most recent window gets a weight of W at time t). Moreover, since request rates may fluctuate greatly (with some time-windows potentially having no or only a few delay samples with possible outliers), we also incorporate Nim,jn (t) into WMA. This gives a higher
2727
weight for representative time-windows with more requests. The use of WMA ensures that Dealer reacts to prolonged performance episodes that last several seconds, while not aggressively reacting to extremely short-lived problems within a window. W determines the number of windows for which a link/component must perform poorly (well) for it to be avoided (reused). Our empirical experience has shown choosing W values between 3 and 5 are most effective for good performance. Probing: Dealer uses active probes to estimate the performance of components and links that are not currently being used. This enables Dealer to decide if it should switch requests to a replica of a component in a different data-center, and determine which replica must be chosen. Probe traffic is generated by test-clients using application workload generators (e.g., [9]). We restrict active probes to read-only requests that do not cause changes in persistent application state. While this may not accurately capture the delays for requests involving writes, we have found the probing scheme to work well for the applications we experiment with. We also note that many applications tend to be read-heavy and it is often more critical to optimize latencies of requests involving reads. To bound probes’ overhead, we limit the probe rate to 10% of the application traffic rate. Moreover, since a path that has generally been good might temporarily suffer poor performance, Dealer biases the probes based on the quality of the path [30]. Biasing the probing ensures that such a path is likely to be probed more frequently, which ensures Dealer can quickly switch back to it when its performance improves. We note the probing overhead may be restricted by combining estimates obtained by (i) using passive user-generated traffic to update component processing delays and intercomponent link latencies; and (ii) limiting active probes to measuring inter-data-center latency and bandwidth only. Further, rather than having each application measure the bandwidth and latency between every pair of data-centers, cloud providers could provide such services in the future, amortizing the overheads across all applications. C. Determining request split ratios In this section, we discuss how Dealer uses the processing delays of components and communication times of links to compute the split ratio matrix TF. Here, T Fim,jn is the number of user requests that must be directed between component i in data-center m to component j in data-center n, for every pair. In determining the split ratio matrix, Dealer considers several factors including i) the total response time; ii) stability of the overall system; and iii) capacity constraints of application components. In our discussion, a combination refers to an assignment of each component to exactly one data-center. For instance, in Figure 5, a mapping of C1 to DC1 , C2 to DCk , Ci to DCm and Cj to DCm represents a combination. The algorithm iteratively assigns a fraction of requests to each combination. The TF matrix is easily computed once the fraction of requests assigned to each combination is determined. We now present the details of the algorithm. Considering total response time: Dealer computes the mean delay for each possible combination as the weighted sum
2728
IEEE JOURNAL ON SELECTED AREAS IN COMMUNICATIONS, VOL. 31, NO. 12, DECEMBER 2013
Algorithm 1 Determining request split ratios. 1: procedure C OMPUTE S PLIT R ATIO () 2: 3: 4: 5: 6:
7: 8: 9: 10: 11: 12: 13: 14: 15: 16: 17: 18: 19:
Let ACim be the available-capacity matrix for Cim , initialized as described in §IV-D Let Tij be the requests matrix, indicating the number of requests per second between application components i and j � Let Ti = j Tji ; i.e., the load on Ci Let FA be fraction of requests that has been assigned to combinations, initialized as F A ← 0 Let L be a combination of components (described in IV-C), where component Ci is assigned to data-center d(i) (i.e., replica Ci,d(i) ) Goal: Find T Fim,jn : the number of requests that must be directed between Cim and Cjn Foreach combination L, sorted by mean delay values For each Cim in L im fi ← AC Ti minf ← min∀i (fi ) ratio = min(minf , DR(L, t)) Rescale damping ratios if necessary For each Cim in L ACim ← ACim − ratio ∗ Ti T Fid(i),jd(j) ← T Fid(i),jd(j) + ratio ∗ Tij , ∀i, j F A ← F A + ratio Repeat until FA = 1 end procedure
of the processing delays of nodes and communication delay of links associated with that combination. The weights are determined by the fraction of user requests that traverse that node or link [30]. Once the delays of combinations are determined, Dealer sorts the combinations in ascending order of mean delay such that the best combinations get utilized the most, thereby ensuring a better performance. Ensuring system stability: To ensure stability of the system and prevent oscillations, Dealer avoids abrupt changes in the split ratio matrix in response to minor performance changes. To achieve this, Dealer gradually increases the portion of requests assigned to a given combination, and limits the maximum fraction of requests that may be assigned to it. The limit (which we refer to as the damping ratio) is based on how well that combination has performed relative to others, and how much traffic was assigned to that combination in the recent past. In particular, the damping ratio (DR) for combination i is calculated periodically as follows: eight(i,t) DR(i, t) = �WW eight(j,t) , where j (2) � t W eight(i, t) = τ =t−W +1 Rank(i, τ ) ∗ Req(i, τ ) Here, Rank(i, t) refers to the ranking of combination i, and Req(i, t) describes the number of requests served by i at time-window t, as shown in Table II. The idea behind using Rank(i, t) is to give more weight for better combinations. Further, to achieve stability when assigning requests to combinations, we also use Req(i, t) to gradually increase the number of requests a good combination is allowed to have. The algorithm computes the weight of a combination based on its rank and the requests assigned to it in each of the last W windows. Similar to §IV-B, we found that W values between 3 and 5 results in the best performance. Honoring capacity constraints: In assigning requests to a combination of application components, Dealer ensures the capacity constraints of each of the components is honored as
Algorithm 2 Dynamic capacity estimation. 1: procedure C OMPUTE T HRESH (T, D)
2: if D > 1.1 ∗ DelayAtT hresh then 3: if T <= T hresh then 4: LowerT hresh ← 0.8 ∗ T 5: ComponentCapacity ← T hresh 6: else 7: T hresh ← unchanged 8: ComponentCapacity ← T hresh 9: end if 10: else if D <= DelayAtT hresh then 11: if T >= T hresh then 12: T hresh ← T 13: ComponentCapacity ← T + 5%of T 14: else 15: T hresh ← unchanged 16: ComponentCapacity ← T hresh 17: end if 18: end if 19: end procedure
described in Algorithm 1. Dealer considers the combinations in ascending order of mean delay (line 8). It then determines the maximum fraction of requests that can be assigned to that combination without saturating any component (lines 9-11). Dealer assigns this fraction of requests to the combination, or the damping ratio, whichever is lower (line 12). The available capacities of each component and the split ratio matrix are updated to reflect this assignment (lines 14-16). If the assignment of requests is not completed at this point, the process is repeated with the next best combination (lines 17-18). D. Estimating capacity of components We now discuss how Dealer determines the capacity of components (i.e., the load each component can handle). Typically, application delays are not impacted by an increase in load up to a point which we term as the threshold. Beyond this, application delays increase gradually with load, until a breakdown region is entered where vastly degraded performance is seen. Ideally, Dealer must operate at the threshold to ensure the component is saturated while not resulting in degraded performance. The threshold is sensitive to request mix changes. Hence, Dealer relies on algorithms for dynamically estimating the threshold, and seeks to operate just above the threshold. Dealer starts with an initial threshold value based on a conservative stress test assuming worst-case load (i.e., requests that are expensive for each component to process). Alternately, the threshold can be obtained systematically (e.g., using knee detection schemes [39]) or learnt during boot-up phase of an application in the data-center, given application traffic typically ramps up slowly before production workloads are handled. Since the initial threshold can change (e.g., due to changes in request mix), Dealer dynamically updates the threshold using Algorithm 2. The parameter DelayAtThresh is the delay in the flat region learnt in the initialization phase, which is the desirable levels to which the component delay must be restricted. At all times, the algorithm maintains an estimate of Thresh, which is the largest load in recent memory
HAJJAT et al.: DYNAMIC REQUEST SPLITTING FOR INTERACTIVE CLOUD APPLICATIONS
where a component delay of DelayAtThresh was achieved. T and D represent the current request load on the component, and the delay experienced at the component respectively. The algorithm strives to operate at a point where D is slightly more than DelayAtThresh, and T slightly more than thresh. If Dealer operated exactly at thresh, it would not be possible to know if thresh has increased, and hence discover if Dealer is operating too conservatively. The algorithm begins by checking if the delay is unacceptably high (line 2). In such case, if T ≤ T hresh, (line 3) the threshold is lowered. Otherwise (line 6), the threshold remains unchanged and the component capacity is lowered to the threshold. If D is comparable to DelayAtThresh (line 10), it is an indication the component can take more load. If T ≥ T hresh (line 11), then the threshold is too conservative, and hence it gets increased. Further, ComponentCapacity is set to slightly higher than the threshold to experiment if the component can absorb more requests. If however T < T hresh, (line 14), then ComponentCapacity is set to Thresh to allow more requests be directed to that component. We note that the intuition behind the choice of parameters is to increase the load the component sees by only small increments (5%) but back-off more aggressively (by decreasing the load in each round by 20%) in case the delay starts increasing beyond the desired value. We believe the choice of parameters is reasonable; however, we defer testing the sensitivity of the algorithm to these parameters as a future work. Finally, the reason behind using component’s delay is because it gives a direct way of knowing if a component is saturated. While other metrics such as CPU and memory utilization could be used, using such metrics to infer response time may not be straightforward. For example, a component may have a limit on the number of requests it can handle, after which all requests will get queued. In such a case, an increase in response time due to queuing at the component may be coupled with low CPU and memory utilization. In fact, we observed that Azure Webrole instances (small instances, with .NET Framework v2.0 and 3.5) can handle up to 12 concurrent connections [7], after which response time increases, without significantly affecting the CPU and memory utilization. E. Integrating Dealer with applications We integrated Dealer with both Thumbnail and StockTrader, and we found that the overall effort involved was small. Integrating Dealer with applications involves: i) adding logic to re-route requests to replicas of a downstream component across different data-centers; and ii) maintaining consistent state in stateful applications. Re-routing requests. To use Dealer, application developers need to make only a small change to the connection logic – the code segment inside a component responsible for directing requests to downstream components. Dealer provides both push and pull API’s for retrieving split ratios (§IV-C). Instead of forwarding all requests to a single service endpoint, the connection logic now allocates requests to downstream replicas in proportion to the split ratios provided by Dealer. Integration with stateful applications. While best practices emphasize that cloud applications should use stateless services
2729
whenever possible [4], [6], some applications may have stateful components. In such cases, the application needs to affinitize requests to component replicas so that each request goes to the replicas that hold the state for processing the request. Integrating Dealer with such applications does not change the consistency semantics of the application. Dealer does not try to understand the application’s policy for allocating requests to components. Instead, it proposes the desired split ratios to the application, and the application uses its own logic to determine which replicas can handle a request. In integrating Dealer with stateful applications, it is important to ensure that related requests get processed by the same set of stateful replicas due to data consistency constraints. For instance, the StockTrader application involves session state. To integrate Dealer, we made sure all requests belonging to the same user session use the same combination, and Dealer’s split-ratios only determine the combination taken by the first request of that session. StockTrader persists user session information (users logged in, session IDs, etc.) in a database. We modified the application so that it also stores the list of stateful replicas for each session. We also note that some web applications maintain the session state in the client side through session cookies. Such information could again be augmented to include the list of stateful replicas. To guarantee all requests within the same session follow the same combination, the application must be modified to propagate meta-data (such as a unique session ID and the list of stateful replicas associated with it) along all requests between components. Many web applications (such as StockTrader) use SOAP and RESTful services that provide Interceptors which can be easily used to propagate meta-data with very minimal modifications. In the StockTrader application, we used SOAP Extensions [17] to propagate meta-data. In other cases where Interceptors cannot be used, endpoint interfaces can be changed or overloaded to propagate such data. The propagated meta-data is then used by components to guide the selection of downstream replicas [30]. While handling such state may require developer knowledge, we found this required only moderate effort from the developer in the applications we considered. As future work, we would like to integrate Dealer with a wider set of applications with different consistency requirements and gain more experience with the approach.
V. E XPERIMENTAL E VALUATION In this section, we evaluate the importance and effectiveness of Dealer in ensuring good performance of applications in the cloud. We begin by discussing our methodology in §V-A. We then evaluate the effectiveness of Dealer in responding to various events that occur naturally in a real cloud deployment (§V-B). These experiments both highlight the inherent performance variability in cloud environments, and evaluate the ability of Dealer to cope with them. We then evaluate Dealer using a series of controlled experiments which stress the system and gauge its effectiveness in coping with extreme scenarios such as sharp spikes in application load and failure of cloud components.
2730
IEEE JOURNAL ON SELECTED AREAS IN COMMUNICATIONS, VOL. 31, NO. 12, DECEMBER 2013
A. Evaluation Methodology We study and evaluate the design of Dealer by conducting experiments on Thumbnail and StockTrader (introduced in §II). Cloud testbed and application workloads: All experiments were conducted on Microsoft Azure by deploying each application simultaneously in two data-centers located geographically apart in the U.S. (North and South Central). In all experiments, application traffic to one of the data-centers (referred to as DCA ) is controlled by Dealer, while traffic to the other one (DCB ) was run without Dealer. The objective was to not only study the effectiveness of Dealer in enhancing performance of traffic to DCA , but also ensure that Dealer did not negatively impact performance of traffic to DCB . We study the impact of workload dynamics using real workload traces of a campus web-service described in §II-B. We also use a Poisson arrival process when the focus of an experiment is primarily to study the impact of cloud performance variability away from workload spikes. In Thumbnail, we set the request mix (fraction of requests to BL1 and BL2 ) according to the fraction of requests to Component1 and Component2 in the trace. Requests in Thumbnail had an average upload size of 1.4 MB (in the form of an image) and around 3.2 (860) KB download size for BL1 (BL2 ) requests. StockTrader, on the other hand, had a larger variety of requests (buying/selling stocks, fetching quotes, etc.) with relatively smaller data size. To generate a realistic mix of requests, we used the publicly available DaCapo benchmark [26], which contains a set of user sessions, with each session consisting of a series of requests (e.g., login, home, fetch quotes, sell stocks, and log out). A total of 66 PlanetLab users, spread across the U.S., were used to send requests to DCA . Further, another set of users located inside a campus network were used to generate traffic to DCB . Application Deployments: Applications were deployed with enough instances of each component so that they could handle typical loads along with additional margins. We estimated the capacities of the components through a series of stresstests. For instance, with an average load of 2 req sec and 100% margin (typical of real deployments as shown in §II), we found empirically that 2/5/16 instances of FE/BL1 /BL2 components were required. Likewise, for StockTrader, handling an average session load of 1 req sec (0.25 sec ) required 1/2/1 instances of FE/BS/OS. In StockTrader, we deployed the DB in both data-centers and configured it in master-slave mode. We used SQL Azure Data Sync [16] for synchronization between the two databases. We note that Dealer can be integrated even if the application uses sharding or has weaker consistency requirements (§IV-E) – the choice of master-slave is made for illustration purposes. While reads can occur at either DB, writes are made only at the master DB (DCB ). Therefore, requests involving writes (e.g., buy/sell) can only occur through the BS and OS instances in DCB . Thus, the BS component would see a higher number of requests (by ≈ 20%) than the FE and therefore requires higher provisioning than FE. Further, each component can only connect to its local CS and DB to obtain communication credentials of other components. Finally, all requests belong-
ing to a user session must use the same set of components given the stateful nature of the application. Effectiveness of existing schemes: We evaluate the effectiveness of two prominent load-balancing and redirection techniques used today and compare them to Dealer: • DNS-based redirection: Azure provides Windows Azure Traffic Manager (WATM) [21] as its solution for DNS-based redirection. WATM provides Failover, Round-Robin and Performance distribution policies. Failover deals with total service failures and sends all traffic to the next available service upon failure. Round-robin routes traffic in a round-robin fashion. Finally, Performance forwards traffic to the closest data-center in terms of network latency. In our experiments, we use the Performance policy because of its relevance to Dealer. In WATM, requests are directed to a single URL which gets resolved through DNS to the appropriate data-center based on performance tables that measure the round trip time (RTT) of different IP addresses around the globe to each data-center. We believe WATM is a good representative of DNS-based redirection schemes for global traffic management. In our experiments, our goal was not to compare it against Dealer, but to show that DNS-redirection schemes do not suffice to recover from problems that happen within an application. This is because redirection is based solely on network latency and is agnostic to application performance. We therefore compare Dealer with another scheme that considers overall application performance. • Application-level Redirection: We implemented a per-request load-balancer, that we call Redirection, which re-routes each request as a single unit, served completely by a single datacenter. Redirection re-routes requests based on the overall performance of the application, calculated as the weighted average of total response time (excluding Internet delays) across all requests. If it finds the local response time of requests higher than that of the remote data-center, it redirects clients to the remote data-center by sending a 302 HTTP response message upon receiving a client request. It re-routes requests as long as the remote data-center is performing better, or until capacity limits are reached remotely (limited by the capacity of lowest margin component). Similar to Dealer, rerouting in Redirection does not depend on request types. We use the same monitoring and probing infrastructure described in §IV-B. B. Dealer under natural cloud dynamics In this section, we evaluate the effectiveness of Dealer in responding to the natural dynamics of real cloud deployments. Our goal is to explore the inherent performance variability in cloud environments and evaluate the ability of Dealer to cope with such variability. We experiment with Thumbnail and compare its performance with and without Dealer. Ideally it is desirable to compare the two schemes under identical conditions. Since this is not feasible on a real cloud, we ran a large number of experiments alternating between the two approaches. The experiment was 48 hours, with each hour split into two halfhour runs; one without activating Dealer, and another with it. Traffic was generated using a Poisson process with an average request rate of 2 req sec to each data-center.
Fraction of traffic
HAJJAT et al.: DYNAMIC REQUEST SPLITTING FOR INTERACTIVE CLOUD APPLICATIONS
1
CDF
0.8 0.6
AAB
3000 4000 5500 7500 10000
17000
Delay in msec [log scale] Fig. 6. CDF of total response time under natural cloud dynamics.
160000 80000 40000 20000 10000 5000 0
5 10 15 20 25 30 35 40 45 Run number (a) With Dealer.
160000 80000 40000 20000 10000 5000 0
5
10
15
ABA
ABB
20 25 30 Run number
35
40
45
Fig. 8. Fraction of Dealer traffic sent from DCA to DCB .
Without Dealer With Dealer
0
Delay in msec [Log scale]
1.0 0.8 0.6 0.4 0.2 0.0 0
0.4 0.2
Delay in msec [Log scale]
2731
5 10 15 20 25 30 35 40 45 Run number (b) Without Dealer.
Fig. 7. Box-plots of total response time under natural cloud dynamics.
Figure 6 shows the CDF of the total response time for the whole experiment. Dealer performs significantly better. The 50th , 75th , 90th , and 99th percentiles with Dealer are 4.6, 5.4, 6.6 and 12.7 seconds respectively. The corresponding values without Dealer are 4.9, 6.8, 43.2 and 90.9 seconds. The reduction is more than a factor of 6.5x for the top 10 percentiles. Figure 7 helps understand why Dealer performs better. The figure shows a box-plot of total response time for each run of the experiment. The X-axis shows the run number and the Yaxis shows the total response time in milliseconds. Figure 7(a) shows the runs with Dealer enabled, and 7(b) shows the runs with Dealer disabled (i.e., all traffic going to DCA stay within
the data-center). In both figures, runs with the same number indicate that the runs took place in the same hour, back to back. The figures show several interesting observations: • First, without Dealer, most runs had a normal range of total response time (median ≈ 5 seconds). However, the delays were much higher in runs 13-16 and 43-48. Further investigation showed these high delays were caused by the BL instances in DCA , which had lower capacity to absorb requests during those periods, and consequently experienced significant queuing. Such a sudden dip in capacity is an example of the kind of event that may occur in the cloud, and highlights the need for Dealer. • Second, Dealer too experienced the same performance problem with BL in DCA during runs 13-16 and 43-48. However, Dealer mitigated the problem by tapping into the margin available at DCB . Figure 8 shows the fraction of requests directed to one or more components in DCB by Dealer. Each bar corresponds to a run and is split according to the combination of components chosen by Dealer. Combinations are written as the location of FE, BE, BL1 and BL2 components1 respectively, where A refers to DCA and B to DCB . For example, for run 0 around 9% of requests handled by Dealer used one or more components from DCB . Further, for this run, 5% of requests used AAB combination, while 1% used ABA, and 3% used ABB. Further, most requests directed to DCB during the problem take the path AAB, which indicates the BL component in DCB is used. • Third, we compared the performance when runs 13-16 and 43-48 are not considered. While the benefits of Dealer are not as pronounced, it still results in a significant improvement in the tail. In particular the 90th percentile of total response time was reduced from 6.4 to 6.1 seconds, and the 99th percentile was reduced from 18.1 to 8.9 seconds. Most of these benefits come from Dealer’s ability to handle transient spikes in workload by directing requests to the BL replica in DCB . There were also some instances of congestion in the blob of DCA which led Dealer to direct requests to the blob of DCB . • Finally, Figure 7(a) shows that the performance is not as good in run 8. Further inspection revealed that the outliers during this run were all due to the high upload delays of the requests directed to DCB . This was likely due to Internet congestion between the users and DCB . We note that such performance problems are not the focus of Dealer, and should rather be handled by schemes for Global Traffic Management such as DNS-based redirection [27], [47]. 1 Since all requests in this experiment were of type BL , we drop the 4th 1 tuple.
IEEE JOURNAL ON SELECTED AREAS IN COMMUNICATIONS, VOL. 31, NO. 12, DECEMBER 2013
Total response time(msec)
2732
1
0.6 0.4
0
GTM Dealer
3000 4000 5500 7500 10000
17000
Delay in msec [log scale] Fig. 9. CDF of total response time for GTM vs. Dealer (Thumbnail).
C. Why is DNS-based redirection insufficient? Global Traffic Managers (GTM) are used to route user traffic across data-centers to get better application performance and cope with failures. We use the WATM scheme (§V-A) under the same setup as in previous section. Figure 9 shows that Dealer achieves a reduction of at least 3x times in total response time for the top 10 percentiles. Like before, we found the BL instances had lower capacity in some of the runs leading to a higher total response time in GTM. Since the GTM approach only takes into account the network latency and not the application performance, it was unable to react to performance problems involving the BL instances. This shows that DNS-redirection schemes do not suffice to recover from problems that happen within an application, and that Dealer can complement such schemes.
Redirection Dealer 2500
2000
1500 00:00
10:00 20:00 30:00 40:00 (a) Total response time of the application
50:00 AAA
100%
Fraction of traffic
0.2
ABB
75% 50% 25% 0% 00:00
10:00 20:00 30:00 40:00 50:00 (b) Fraction of traffic sent along each path by Dealer AAA
100%
Fraction of traffic
CDF
0.8
3000
BBB
75% 50% 25% 0% 00:00
10:00
20:00 30:00 40:00 50:00 Time(min) (c) Fraction of traffic sent along each path by Redirection
Fig. 10. Performance of Dealer vs. Redirection using traces collected during the DB performance issue. A combination (FE, BS, OS) is represented using the data-center (DCA or DCB ) to which each component belongs. 20% of requests perform DB writes (combination ABB), hence we exclude them for better visualization.
D. Dealer vs. application-level redirection In this section, we evaluate the effectiveness of Dealer in adapting to transient performance issues in the cloud and compare it with application-level redirection described in §V-A. 1) Reaction to transient performance problems: We replay a real workload trace that was collected during a nine day episode which impacted the performance of a subset of databases (DBs) in a single data-center [30]. We emulate this episode by taking two intervals from the trace (each 10 minutes in duration) and use the corresponding data points to induce delay at the DB in DCA . We experiment with StockTrader which we deploy at both data-centers, using the master-slave mode as described in §V-A. Figure 10 shows that during the period of performance degradation at the DB (9-18th and 27-36th min), the average response time of Dealer is significantly better than that of Redirection. Figure 10(b) shows that Dealer takes ABB and switches requests over to the BS and OS at DCB to avoid the high latency at DB. Similarly, Figure 10(c) shows the path (BBB) taken by Redirection and how this scheme switches a fraction of the requests entirely to the data-center, DCB . The fraction of traffic redirected to BBB in (c) is less than the fraction of traffic sent through ABB in (b). This is because Dealer is able to better utilize the margin available at the BS by switching a larger fraction of requests to the BS in DCB .
On the other hand, Redirection is constrained by the available capacity at the FE (DCB ) and hence is not able to completely utilize the margin available at the BS (DCB ). 2) Reaction to transient component overload: In this section, we evaluate Thumbnail under natural cloud settings using a 2 weeks real workload trace from §II. We use two intervals, each around 30 minutes long, and replay them on DCA and DCB simultaneously. The two intervals are about 4 hours away from each other, allowing us to simulate realistic load that may be seen by data-centers in different time-zones. We ran the experiment in a similar fashion to §V-B for 5 hours alternating between Dealer and Redirection. We subjected BL1 and BL2 to the same request rate seen by Component1 and Component2. A total of 55 VM’s were used to deploy the application in both data-centers. We picked the margin for each component as the average peak-to-average ratio during each interval. Margins ranged between 190% and 330%. Figure 11 shows that the 90th (99th ) percentiles for Dealer were 11.9 (14.4) seconds, compared to 13.3 (19.2) seconds for Redirection– a reduction of over 10.5% in response times for the top 10 percentiles. The key reason Dealer outperforms Redirection is because traffic peaks seen by different components are not correlated. In particular, the BL1 replica in DCA was under a short-term traffic overload, which Dealer was able to mitigate by splitting requests across BL1 replicas
HAJJAT et al.: DYNAMIC REQUEST SPLITTING FOR INTERACTIVE CLOUD APPLICATIONS
2733
1
CDF
0.8 0.6 0.4 0.2
Dealer Redirection
0 5500
7500 10000 17000 Delay in msec [log scale]
Fig. 11. CDF of total response time of Dealer vs. Redirection using real workload trace under natural spikes and request mix changes (Thumbnail). Latencies with both schemes are higher than Figure 6 because requests to BL2 involve heavier processing (image rotation).
Performance of Dealer vs. Redirection using real workload trace with cloud failures (Thumbnail).
Fig. 13.
Req/sec
8 BL1 in DCA BL1 in DCB BL2 in DCB
6 4
reasons described in §V-D2, Dealer maintained a significantly lower response time during the surge in workload (130% lower). The results show that Dealer is effective in handling failures in the cloud.
2 0 0
500 1000 Time (seconds)
1500
Fig. 12. Request rate for each component in both data-centers. BL2
in DCA not shown for better visualization.
in both data-centers. Redirection, on the other hand, could not re-direct all excess traffic to DCB since BL2 did not have sufficient capacity in the remote data-center to handle all the load from DCA . Moreover, Figure 12 shows that at times 400500, BL1 in DCA experienced a surge in request rate, while at the same time, BL1 (BL2 ) in DCB had a request rate that is lower(higher) than its average. Our analysis of the 2 weeks trace reveal that such abrupt workload spikes happen naturally in the wild, and that traffic peaks inherently occur at different times across the multiple tiers of the application (described in §II-B). The results show that coarse-grained load-balancing at the granularity of datacenters may not be feasible in adapting with such dynamics, and that a scheme like Dealer which exploits this lack of correlation in traffic peaks can achieve significant gains. 3) Reaction to failures in the cloud: Applications in the cloud may see failures which reduce their margins, making them vulnerable to even modest workload spikes. Failures can happen due to actual physical outages or due to maintenance and upgrades. For example, Windows Azure’s SLA states that a component has to have 2 or more instances to get 99.95% availability [19] as instances can be taken off for maintenance and upgrades at any time. In Figure 13, we reproduced the case of a single faultdomain failure at time 300 affecting BL2 instances in DCB 2 . The combination AABA represents requests which were served by FE, BE, BL2 at DCA and BL1 at DCB . For the same 2 This involved bringing 4 BL VM’s offline since Azure deploys each 2 component’s VMs on 2 or more fault-domains.
VI. C OST A NALYSIS In this section, we present cost analysis of Dealer and its potential in reducing operational costs of geo-distributed multi-tier applications. In §VI-A, we first estimate the cost increase due to inter-data-center traffic which Dealer introduces when splitting requests across multiple data-centers. Our results are based on our experiments conducted in the evaluation section §V. We assume all instances are similar and use the default pay-as-you-go (or on-demand) pricing option that involves renting resources on an hourly basis with no long-term commitment. Then, in §VI-B, we use simulation to evaluate Dealer’s potential in reducing overall operational costs of applications. Our simulation is motivated by the fact that applications use a combination of instances with different billing plans; in addition to the pay-as-you-go pricing option, applications also use long-term, or reserved, pricing plans which involve commitments over longer periods (e.g., six months) with discounted prices. We evaluate the cost savings obtained with Dealer under a wide range of configurations of on-demand and reserved instances. A two weeks workload trace of a real campus application is used to drive our simulation on a geo-distributed deployment of the multi-tier Thumbnail application in two data-centers. Finally, in our evaluations, we use the pricing plans from both Microsoft Azure [12] and Amazon AWS [1]. A. Inter data-center bandwidth costs A potential concern arises due to wide-area traffic that Dealer introduces in re-routing requests across data-centers. In this section, we compute the cost percentage increase for Thumbnail and StockTrader based on the experiments conducted in §V-D1 and §V-D2. We consider the bandwidth, storage and compute costs based on Microsoft Azure tariffs in January, 2012. All compute instances are of the same type (on-demand, small size) and
2734
IEEE JOURNAL ON SELECTED AREAS IN COMMUNICATIONS, VOL. 31, NO. 12, DECEMBER 2013
incur the same hourly cost in both data-centers. The bandwidth cost is based on all requests exiting each data-center (inbound traffic does not incur bandwidth costs). The average size of each request in Thumbnail (StockTrader) is 1.5MB (2 KB). StockTrader uses SQL Azure DB (Web Edition) and Thumbnail uses Azure blobs for storage. We calculate the storage cost for Thumbnail based on the number of storage requests and storage size consumed. The cost of the DB and compute instances is normalized to the duration of the experiments. The cost percentage increase for Thumbnail and StockTrader were found to be 1.94% and 0.06% respectively. This shows that the cost introduced due to inter data-center bandwidth is minimal, even for data-intensive applications such as Thumbnail. Finally, we have repeated our calculations using the Amazon EC2 pricing scheme [1], and we have found similar results. B. Cost savings utilizing instance types Most cloud infrastructures offer reserved instances which involve long-term plans with discounted prices over the payas-you-go on-demand instances. In this section, we use simulation to evaluate the cost benefit that may be achieved with Dealer by leveraging the cost difference in billing schemes of on-demand and reserved instances. Our simulation is based on the Thumbnail application and is driven by a 2 weeks workload trace of a real campus application. Furthermore, we compare the cost benefit achieved with Dealer against a scheme that does not use any redirection and another which redirects traffic at the granularity of individual data-centers, similar to conventional load-balancing techniques used today. Reserved and on-demand instances. Reserved instances are contracted over long time periods (e.g., one year) and usually require the users to pay an upfront fixed cost [1], [12]. Such billing plans incur charges whether instances are being utilized or not by the application. Applications typically lower their provisioning costs by leveraging both instance types; reserved instances may be used to serve the stable part of their workload over long periods, and any shorter-term fluctuations can be served using (the more expensive) on-demand instances. Simulation. In practice, it is difficult to estimate the number of reserved and on-demand instances that achieves the best optimal price for a deployment given the various dynamics and complexities related to cloud applications– e.g., workload fluctuations, traffic redirection, geo-distribution, scale of application, etc. While there have been a few works that study ways to provision reserved and on-demand compute instances (e.g., [32]), they are limited to studying deployments in a single data-center, and are usually restricted to single-tiered applications. Hence, in our simulation, we study the impact of different possible reserved instance configurations on cost. Specifically, we evaluate the Thumbnail application by varying the number of reserved instances used per component and look at the resulting cost. We then compare the overall cost achieved with Dealer to other schemes that may be used in cloud deployments today. We define reserved-percentile as the percentile of requests that will be served using reserved instances throughout the
simulation run. This percentile can be computed for a component a priori using its workload trace. E.g., the 90th percentile of request rate for the FE component is 9.5 req sec ; hence, a reserved-percentile of 90 means that the application will be provisioned with reserved instances to handle 9.5 req sec . Any request rate beyond the capacity of reserved instances is either re-routed remotely (if feasible) or served using ondemand instances. The simulation is repeated for reservedpercentile values between 0 and 100. The same percentile is used across all components in each simulation run (which may map to different request rates at each component; e.g., the 90th percentile of request rates for the BL1 /BL2 /FE components are 5.8/4/9.5 req sec ). For each replica, we compute the number of instances required to serve a given request rate based on stress-test capacity analysis discussed in §V-A. The same VM size is assumed for both on-demand and reserved instances (small in our experiments). A margin of 200% is used for provisioning application components. Finally, we assume ondemand instances can be started instantaneously. Schemes. Traffic to each data-center is served first by reserved instances in the same data-center. Any excess traffic is handled according to the following schemes: 1) Local: on-demand instances are started locally for any excess traffic beyond reserved instances’ capability. 2) Redirection: for excess traffic, it first checks if the remote data-center is underutilized by checking the available capacity of each component’s replica in the remote data-center. If the remote data-center has available capacity, it redirects requests to it until its capacity limit is reached. After that, any excess traffic is handled locally using the more expensive on-demand instances. Note that the amount of traffic redirected remotely is limited by the bottleneck component with lowest available capacity in the remote data-center. This scheme is representative of the costs seen in DNS-based or applicationlevel redirection schemes described in §V-A. 3) Dealer: at each component, this scheme re-routes excess traffic to the replica in the remote data-center if its capacity permits. Note that this is done at each individual component independently of the available capacity at other components in the remote data-center (unlike the previous scheme which redirects traffic at entire data-center granularity). After that, any remaining excess traffic is handled using local on-demand instances. Workload and Prices. We evaluate the Thumbnail application based on a 2 weeks workload trace described in §II-B. We use the same workload trace for both data-centers; however, we shift one of the workloads by 3 hours, allowing us to simulate a realistic load seen by data-centers in different time-zones. The components BL1 and BL2 are subjected to the same request rate seen by Component1 and Component2 respectively. We use the same tariffs used in the previous subsection. On-demand instances are paid hourly. Once an on-demand instance is started, it is assumed to remain online for increments of hours; at the end of each hour, instances that are not needed any more (e.g., due to low workload) are turned off. For reserved instances, we normalize the price of the instances to the duration of the experiment. Figure 14 illustrates the total cost and constituent compute and network costs for Dealer. The figure shows that
HAJJAT et al.: DYNAMIC REQUEST SPLITTING FOR INTERACTIVE CLOUD APPLICATIONS
1,800 Total cost
Cost (in US dollars)
1,600 1,400
Reserved cost
1,200
On-demand cost
1,000
800
Inter-datacenter bandwidth cost
600
400
2735
when reserved-percentile is around 60. This, in fact, represents the most practical operating point for all schemes (as shown in Figure 14). Overall, our results show that the cost increase due to interdata-center traffic in Dealer is minor and, in fact, Dealer can be used to reduce overall costs by leveraging the difference in tariffs between on-demand and reserved instances in an application.
200
0 0
20
40
60 80 reserved-percentile
100
120
Fig. 14. Total cost for Dealer with various reserved-percentile values.
Constituent costs are also shown for compute instances (on-demand and reserved) and inter-data-center bandwidth. Costs are calculated for a workload trace of 2 weeks duration using Microsoft Azure prices. Same trends were also observed for Local and Redirection.
as reserved-percentile values increase, the application uses more reserved instances to serve higher request rates, thus incurring higher reserved cost and lower on-demand cost– e.g., at reserved-percentile value of 100, Reserved(on-demand) cost contributes to 100%(0%) of total cost. Varying reservedpercentile value gives different composition of reserved and on-demand instances which impacts the total overall price. For instance, the figure shows that the optimal costs were obtained with reserved-percentile values of either 70 or 90. Similar trends were also observed for both Local and Redirection schemes. Finally, we also run our simulation using Amazon EC2 prices [1]. The same trends were observed for all schemes (though, the overall cost using Amazon was lower by about $159 on average). Figure 15 further illustrates the cost increase percentage for Local and Redirection schemes in comparison to Dealer’s cost, using both Microsoft Azure and Amazon EC2 prices. The figure shows that Dealer achieved the best cost savings for all reserved-percentile values. For instance, in Figure 15(a), choosing reserved instances to serve up to the 60th percentile of request rates at all components yields a cost increase of about 15% for Local and 11% for Redirection over Dealer. Using the prices of Amazon EC2 gave even better results; Local(Redirection) exhibited a cost increase of up to 17%(12%) over Dealer’s price. Local always corresponds to the worst operational costs because any workload surge that cannot be handled locally (using reserved instances) will always result in the creation of new on-demand instances. Further, Redirection results in higher costs than Dealer since it is limited by the replica with minimum available capacity in the remote data-center. Dealer, on the other hand, re-routes traffic at the granularity of individual components and can thus leverage reserved instances to the maximum extent possible. We note that the cost benefit of Dealer is small when reserved-percentile is low (close to 0) because there are few reserved instances that Dealer can leverage. The cost benefit is also small when reserved-percentile is high (close to 100) because the application is highly over-provisioned and thus has sufficient reserved instances to handle peak loads without requiring redirection. Dealer provides the best cost benefit
VII. R ELATED W ORK Several researchers have pointed out the presence of performance problems with the cloud (e.g., [25], [35], [46], [50]). Recently, [50] highlighted the long tail of response time in Amazon EC2 and related it to the co-scheduling of CPUbound and latency-sensitive tasks on the same hypervisor. In contrast, our focus is on designing systems to adapt to shortterm variability in the cloud. The cloud industry already provides mechanisms to scale up or down the number of server instances in the cloud (e.g., [12], [14]). However, it takes tens of minutes to invoke new cloud instances in commercial cloud platforms today. Recent research has shown the feasibility of starting new VMs at faster time scales (e.g., [34]). While such schemes are useful for handling variability in performance due to excess load on a component, they cannot handle all types of dynamics in the cloud (e.g., problems in blob storage, network congestion, etc.) Further, ensuring the servers are warmed up to serve requests after instantiation (e.g., by filling caches, running checks, copying state, etc.) demands additional time. In contrast, Dealer enables faster adaptation at shorter time-scales, and is intended to complement dynamic resource invocation solutions. Live VM migration techniques (e.g., [48], [49]) handle a workload increase on a VM by migrating the VM to a less loaded physical server. Although migrations may involve short downtimes, they may incur additional overhead that may impact application’s performance (e.g., due to iterative memory pre-copying, network bandwidth overhead, cache warm-up, etc.) Further, VM migration across data-centers in WAN environments is even more challenging (due to disk and memory state transfer, network reconfigurations, etc.) [49]. In contrast, Dealer does not involve VM migration, and its lightweight nature enables adaptation at shorter time-scales. Dealer offers several advantages in that it can be used in PaaS cloud platforms (e.g., Microsoft Azure) where VM migrations are not possible. Moreover, techniques like [48] rely on VM-level utilization metrics which may not suffice to detect and adapt to all types of poor performance episodes in the cloud (e.g., storage or network related problems). For instance, a network congestion may negatively impact the performance between two inter-connected VMs; however, VM-level metrics such as network utilization may still be low. On the contrary, Dealer focuses on overall application performance and can detect and adapt to such issues by appropriately reassigning requests to the best combination of replicas. DNS-based techniques [27], [41], [47] and server-side redirection mechanisms [37] are widely used to map users to appropriate data-centers coarsely at the granularity of
IEEE JOURNAL ON SELECTED AREAS IN COMMUNICATIONS, VOL. 31, NO. 12, DECEMBER 2013
Cost increase % over Dealer
20
Local Redirection
15
10 5 0 0
20
40 60 reserved-percentile
80
100
Cost increase % over Dealer
2736
(a) Microsoft Azure prices. Fig. 15.
20
Local
15
Redirection
10 5 0 0
20
40 60 reserved-percentile
80
100
(b) Amazon EC2 prices.
Total cost increase percentage of Local and Redirection schemes over Dealer for various reserved-percentile values.
individual IPs or entire user sessions. In contrast, Dealer targets performance problems of individual cloud components and links within an application, and may choose components that span multiple data-centers to service an individual user request. This offers significant performance benefits and additional cost savings over other schemes, as we extensively show in §V and §VI. We note that [37] mentions doing redirection at the level of the bottleneck component; however, Dealer is distinguished in that it makes no a priori assumption about which component is the bottleneck, and dynamically reacts to whichever component or link that is performing poorly. Several works [40], [45], [51] study utility resource planning and provisioning for applications. For example, [45] aims at handling peak workloads by provisioning resources at two levels; predictive provisioning that allocates capacity at the time-scale of hours or days, and reactive provisioning that operates at time scales of minutes. While such techniques are complementary to Dealer, their focus is not applications deployed in public clouds. Dealer not only deals with workload variability, but also handles all types of performance variability (such as service failures, network congestion, etc.) in geodistributed multi-tier applications, deployed in commercial public clouds. Dealer provides ways to avoid components with poor performance and congested links via re-routing requests to replicas in other data-centers at short time scales. VIII. C ONCLUSIONS AND F UTURE W ORK In this paper, we have shown that it is important and feasible to architect latency-sensitive applications in a manner that is robust to the high variability in performance of cloud services. We have presented Dealer, a system that can enable applications to meet their SLA requirements by dynamically splitting requests for each component among its replicas in different data-centers. Under natural cloud dynamics, the 90th and higher percentiles of application response times were reduced by more than a factor of 3 compared to a system that used traditional DNS-based redirection. Further, Dealer not only ensures low latencies but also significantly out-performs application-level redirection mechanisms under a range of controlled experiments. Although Dealer incurs additional cost due to re-routing requests across data-centers,
our results show that such costs are minimal even for dataintensive applications such as Thumbnail. In fact, Dealer can be used to reduce the overall operational costs of applications by up to 15% by leveraging the difference in billing plans of on-demand and reserved instances. Finally, integrating Dealer with two contrasting applications only required a modest level of change to code. As future work, we plan to explore and gain more experience integrating Dealer with a wider set of cloud applications with various consistency constraints. Further, we intend to study ways for reducing probing overhead by limiting active probes to measuring inter-data-center bandwidth and latency only. Moreover, rather than relying on empirical experience to tune the parameters of the system, we believe a systematic investigation of heuristics that can result in the optimal operating points is an interesting area of future work. Finally, we will evaluate the performance of Dealer under scale and explore more cloud infrastructures (such as Amazon EC2 and Google App Engine). IX. ACKNOWLEDGMENTS This material is based upon work supported in part by the National Science Foundation (NSF) under Career Award No. 0953622 and NSF Award No. 1162333, and was supported by cloud usage credits from Microsoft Azure under NSF/Microsoft’s Computing in the Cloud program. Any opinions, findings, and conclusions or recommendations expressed in this material are those of the authors and do not necessarily reflect the views of NSF or Microsoft. Finally, we thank the editors and reviewers for their feedback which helped us improve the paper. R EFERENCES [1] [2] [3] [4] [5] [6] [7] [8] [9] [10]
Amazon AWS Cloud. http://aws.amazon.com/. Amazon cloud outage. http://aws.amazon.com/message/2329B7/. Apache, Project Stonehenge. http://goo.gl/5p4xo. Architecting for the Cloud: Best Practices. http://goo.gl/Rz91k. Aspect Oriented Programming. http://goo.gl/bz8uA. Coding in the Cloud. Use a stateless design whenever possible. http: //goo.gl/FWNlR. Concurrent connection limit in .NET. http://goo.gl/jGt3V. Event Tracing for Windows (ETW). http://goo.gl/RjrT8. Grinder Load Testing. http://grinder.sourceforge.net/index.html. Latency Is Everywhere And It Costs You Sales. http://goo.gl/E8nKV.
HAJJAT et al.: DYNAMIC REQUEST SPLITTING FOR INTERACTIVE CLOUD APPLICATIONS
[11] [12] [13] [14] [15] [16] [17] [18] [19] [20] [21] [22] [23] [24] [25] [26] [27] [28] [29] [30]
[31] [32] [33] [34] [35] [36] [37] [38] [39] [40] [41] [42] [43]
[44] [45] [46] [47] [48] [49] [50] [51]
Microsoft Live Outage. http://goo.gl/pCQRR. Microsoft Windows Azure. http://www.microsoft.com/windowsazure/. Response Time Metric for SLAs. http://goo.gl/LdNBZ. Rightscale cloud management. http://www.rightscale.com. Slow pages lose users. http://goo.gl/Yndcb. SQL Azure Data Sync. http://goo.gl/qgqNv. Using SOAP Extensions in ASP.NET. http://goo.gl/s4uvz. Windows Azure Service Disruption Update. http://goo.gl/2OHnp. Windows Azure SLA. http://www.microsoft.com/windowsazure/sla/. Windows Azure Thumbnails Sample. http://goo.gl/eXfDe. Windows Azure Traffic Manager (WATM). http://goo.gl/3Mon2. A HMAD , F., ET AL . Joint optimization of idle and cooling power in data centers while maintaining response time. ASPLOS 2010. A RMBRUST, M., ET AL . Above the Clouds: A Berkeley View of Cloud Computing. Tech. rep., EECS, University of California, Berkeley, 2009. BARHAM , P., ET AL . Magpie: Online modelling and performance-aware systems. In HOTOS 2003. BARKER , S., AND S HENOY, P. Empirical evaluation of latency-sensitive application performance in the cloud. In MMSys 2010. B LACKBURN , S. M., AND ET AL . The DaCapo benchmarks: Java benchmarking development and analysis. In OOPSLA 2006. D ILLEY, J., ET AL . Globally distributed content delivery. Internet Computing, IEEE (2002). F ONSECA , R., P ORTER , G., K ATZ , R., S HENKER , S., AND S TOICA , I. X-trace: A pervasive network tracing framework. In NSDI 2007. H AJJAT, M., ET AL . Cloudward bound: Planning for beneficial migration of enterprise applications to the cloud. SIGCOMM 2010. H AJJAT, M., N, S. P., M ALTZ , D., R AO , S., AND S RIPANIDKULCHAI , K. Dealer: Application-aware Request Splitting for Interactive Cloud Applications. In ACM CoNEXT 2012. H ASTORUN , D., ET AL . Dynamo: amazons highly available key-value store. In In Proc. SOSP (2007). H ONG , Y.-J., ET AL . Dynamic server provisioning to minimize cost in an iaas cloud. In ACM SIGMETRICS, 2011. H U , L., ET AL . Net-Cohort: Detecting and Managing VM Ensembles in Virtualized Data Centers. In ICAC 2012. L AGAR -C AVILLA , ET AL . SnowFlock: rapid virtual machine cloning for cloud computing. In ACM EuroSys, 2009. L I , A., YANG , X., K ANDULA , S., AND Z HANG , M. CloudCmp: comparing public cloud providers. In IMC 2010. PANG , J., ET AL . On the responsiveness of DNS-based network control. In IMC 2004. R ANJAN , S., K ARRER , R., AND K NIGHTLY, E. Wide area redirection of dynamic content by Internet data centers. In INFOCOM 2004. S ANG , B., ET AL . Precise, scalable, and online request tracing for multitier services of black boxes. In IEEE TPDS 2012. S ATOPAA , V., ET AL . Finding a ’Kneedle’ in a Haystack: Detecting Knee Points in System Behavior. In SIMPLEX Workshop, 2011. S HIVAM , P., BABU , S., AND C HASE , J. Learning application models for utility resource planning. In ICAC’06. S U , A., ET AL . Drafting behind Akamai. SIGCOMM 2006. S YMANTEC. State of the Data Center Global Data. http://goo.gl/VKJpz. TAK , B. C., ET AL . vPath: Precise Discovery of Request Processing Paths from Black-Box Observations of Thread and Network Activities. In USENIX ATC 2009. U RGAONKAR , B., AND S HENOY, P. Cataclysm: Handling extreme overloads in internet services. In PODC 2004. U RGAONKAR , B., S HENOY, P., C HANDRA , A., AND G OYAL , P. Dynamic provisioning of multi-tier internet applications. In ICAC 2005. WANG , G., AND N G , T. S. E. The impact of virtualization on network performance of Amazon EC2 data center. In IEEE INFOCOM 2010. W ENDELL , P., ET AL . DONAR: decentralized server selection for cloud services. In SIGCOMM 2010. W OOD , T., ET AL . Black-box and Gray-box Strategies for Virtual Machine Migration. In NSDI 2007. W OOD , T., ET AL . CloudNet: dynamic pooling of cloud resources by live WAN migration of virtual machines. In VEE 2011. X U , Y., ET AL . Bobtail: Avoiding Long Tails in the Cloud. In NSDI (2013), USENIX. Z HANG , Q., ET AL . A regression-based analytic model for dynamic resource provisioning of multi-tier applications. In ICAC’07.
2737
Mohammad Hajjat is currently a Ph.D. student in the Electrical and Computer Engineering Department (ECE) at Purdue University. His current research is in Networking Systems with a focus on Cloud Computing, and he also worked on Peerto-Peer (P2P) systems and scalable measurement techniques for routers in the past. He obtained his B.Sc. in 2006 in Computer Engineering at Jordan University of Science and Technology (JUST).
Shankaranarayanan P. N. is currently pursuing his Ph.D. at Purdue University. His research interests are in the areas of Network Management, Storage area networks and Cloud Computing. He focuses on improving the performance of latency sensitive applications deployed on the cloud by developing techniques for configuring and tuning geo-replicated datastores.
David Maltz is a Principal Development Manager at Microsoft where he leads the network portion of the Autopilot team, which won Microsoft’s 2013 Technology Achievement Award for advances in cloud-scale data centers. He works on a broad array of projects that strive to improve the usability, performance, and cost of cloud computing. Prior to joining Autopilot, he worked in industry research and academia, including as a Senior Researcher in Microsoft Research and a Post-Doctoral Fellow at Carnegie Mellon. He founded startup companies in network traffic management and wireless networking, and he was part of the GroupLens team that won the 2010 ACM Systems Software Award. He earned a Ph.D. in Computer Science from Carnegie Mellon University in 2001 and a S.B. and S.M. in EECS from MIT in 1993 and 1994. Sanjay G. Rao is an Associate Professor in the School of Electrical and Computer Engineering at Purdue University, where he leads the Internet Systems Laboratory. His current research is in Networking and Cloud Computing, and his past work has spanned several areas including enterprise network management, Internet video distribution, and peerto-peer systems. He received a B.Tech in Computer Science and Engineering from the Indian Institute of Technology, Madras, and the Ph.D from the School of Computer Science, Carnegie Mellon University. He has been a Visiting Research Scientist in Google and AT&T Research. He is a recipient of the NSF Career award, and won the ACM SIGMETRICS Test of Time Award for his work on End System Multicast (peer-to-peer video streaming). He has served on the Technical Program Committees of several workshops and conferences including ACM Sigcomm, Usenix NSDI, IEEE Infocom and ACM CoNext, and was the technical program co-chair of the INM/WREN workshop held in conduction with NSDI 2010. Kunwadee (Kay) Sripanidkulchai is a senior researcher at the National Electronics and Computer Technology Center (NECTEC) in Thailand. Her research interests are in services delivery, cloud computing, and networking. In her previous role as a Research Staff Member at the IBM T.J. Watson Research Center, she led a team to develop processes and tools for a new virtualization service offering for IBM Global Technology Services. She has coauthored a number of papers and patents in networking and cloud computing, and has taught at several universities including Columbia University, Mahidol University, Khonkaen University and Thammasat University. She received a Ph.D. and M.S. from the Department of Electrical and Computer Engineering at Carnegie Mellon University and a B.S. from the Department of Electrical Engineering at Cornell University.