EARNINGS DETERMINATION AND TAXES: EVIDENCE FROM A COHORT-BASED PAYROLL TAX REFORM IN GREECE∗ EMMANUEL SAEZ MANOS MATSAGANIS PANOS TSAKLOGLOU
I. INTRODUCTION Most Organisation for Economic Co-operation and Development (OECD) countries fund social insurance programs, such as retirement, health, disability, and unemployment benefits, with substantial social security contributions on employment earnings. Payroll taxes collect about 25% of total revenue on average in OECD countries (OECD 2008), about the same as personal income taxes. Payroll taxes are much simpler than individual income taxes and share some key characteristics: (1) the base is in general restricted to employment earnings, (2) tax rates are flat, 1 (3) the tax often applies only to earnings below a given cap, and (4) taxes are nominally shared by employers and employees. ∗ We thank editor Lawrence Katz, David Card, Raj Chetty, Peter Diamond, Arie Kapteyn, Bruce Meyer, four anonymous referees, and numerous seminar participants for helpful discussions and comments. We thank Christos Skiadas, director of Actuarial Studies and Statistics at IKA, for giving us access to the administrative data and Giorgos Chelidonis at IKA for his help in preparing and explaining the data. Financial support from NSF Grant SES-0850631 is gratefully acknowledged. 1. Tax rates sometimes vary by occupation but tend to be flat for a given employee in a given occupation.
c The Author(s) 2012. Published by Oxford University Press, on the behalf of President
and Fellows of Harvard College. All rights reserved. For Permissions, please email: journals.
[email protected]. The Quarterly Journal of Economics (2012) 127, 493–533. doi:10.1093/qje/qjr052. Advance Access publication on January 16, 2012.
493
Downloaded from http://qje.oxfordjournals.org/ at Pennsylvania State University on June 26, 2012
This article analyzes the response of earnings to payroll tax rates using a cohort-based reform in Greece. Individuals who started working on or after 1993 face permanently a much higher earnings cap for payroll taxes, creating a large and permanent discontinuity in marginal payroll tax rates by date of entry in the labor force for upper earnings workers. Using full-population administrative social security data and a regression discontinuity design, we estimate the long-term labor supply effects and incidence of payroll tax rates on earnings. Standard theory predicts that in the long run, new regime workers should bear the entire burden of the payroll tax increase (relative to old regime workers). In contrast, we find that employers compensate new regime workers for the extra employer payroll taxes but not for the extra employee payroll taxes. We do not find any evidence of labor supply responses along the extensive or intensive margins around the discontinuity, suggesting low efficiency costs of payroll taxes. We discuss various possible explanations for those results. JEL Codes: H22, J38.
494
QUARTERLY JOURNAL OF ECONOMICS
2. Relative to the classic labor supply literature analyzing hours of work (see Blundell and MaCurdy 1999 for a survey), the tax literature focuses on total reported income and hence captures all potential dimensions of responses such as unmeasured effort on the job, career choices, tax avoidance, and tax evasion. 3. This incidence assumption is also implicitly made in income tax reform studies. A few studies have shown that this assumption does not necessarily hold in reality and that employers may share part of the burden. See Bingley and Lanot (2002) and Kubik (2004) for the income tax and Leigh (2010) and Rothstein (2010) for the U.S. Earned Income Tax Credit.
Downloaded from http://qje.oxfordjournals.org/ at Pennsylvania State University on June 26, 2012
In a standard model, this nominal sharing does not matter for incidence and behavioral responses and only the combined tax is relevant. To assess the efficiency and welfare consequences of such large payroll taxes, it is critical to estimate how labor supply and labor demand respond to them. There is an extensive literature on behavioral responses of reported income to the individual income tax (see Saez, Slemrod, andGiertz 2011 for a recent survey).2 Those studies use individual income tax changes to estimate the elasticity of reported income with respect tomarginal tax rates. There are twomain issues with such elasticity estimates. First, non–tax related changes in the income distribution might be improperly attributed to changes in taxes when one compares a group affected by a tax change (such as high-income earners) to a comparison group not affected by a tax change (such as lower income earners). Second, tax changes can only credibly estimate short-term behavioral responses although long-term behavioral responses are of most interest for policy. In contrast, there is relatively little work on howpayroll taxes affect labor supply. The literature on payroll taxes has focused primarily on incidence. In principle, as we expect labor demand to be substantially more elastic than labor supply, the incidence should be borne primarily by workers (Hamermesh 1993). This has been the standard assumption in most analysis of the distributional effects of taxes (see, e.g., Fullerton and Metcalf 2002 for a survey).3 Indeed, the most compelling macro-economic argument suggesting that the incidence is borne primarily by workers is the fact that the labor income share (which includes all payroll taxes) in GDP is fairly stable over time and across countries (see e.g., OECD 1990). A number of studies have used micro-data (either individual or at the industry level) and exploited payroll tax changes to analyze incidence effects and have found mixed results (Hamermesh 1979; Neubig 1981; Holmlund 1983; Gruber 1997; Anderson and Meyer 1997, 2000; Lang 2003). Some studies have
EARNINGS DETERMINATION AND TAXES
495
Downloaded from http://qje.oxfordjournals.org/ at Pennsylvania State University on June 26, 2012
also tried to test whether the sharing of payroll taxes between employees and employers is irrelevant but have not reached a consensus on this question (Poterba, Rotemberg, and Summers 1986; Mulligan, Gil, and Sala-i-Martin 2010). Importantly, those studies use standard payroll tax changes and hence suffer from the same twocriticisms as the taxable income elasticity literature: identification is not fully compelling and the studies estimate short-run effects. In this article, we exploit an unusual payroll tax reform in Greece to estimate the long-run incidence and effects of taxes on earnings which overcomes identification difficulties that have plagued previous work. Greece has very high payroll tax rates on private sector workers with an employer tax rate of 28% and employee tax rate of 16% (on average), creating a combined marginal tax wedge of about 34% as a proportion of labor costs (gross earnings). Those payroll taxes apply up to a monthly earnings cap above which no marginal tax is charged. In October 1992, Greece enacted a reform in its payroll tax system that applied only to new entrants, that is, workers starting to work and pay payroll taxes on or after January 1, 1993. Individuals who started to work before 1993 continue to pay a combined employee and employer payroll tax up to a monthly cap equal to e2,432 as of 2009. In contrast, employees who started to work on or after 1993, pay the same payroll tax rates but up to a much higher cap, equal to 2.28 times the old cap (e5,543 of monthly earnings as of 2009). As a result, in 2009, about 12% of workers who entered shortly before 1993 are above the cap and face no payroll taxes at the margin. In contrast, only about 1.5% of workers who entered shortly after 1993 are above the newhigher cap. Thus, the reform has effectively created two permanent groups of workers who currently coexist in the same labor market but face sharply different tax rates when they reach e2,432 of monthly earnings (as of 2009). Comparing prereform entrants to postreform entrants using a regression discontinuity design (RDD) based on exact date of entry offers a unique opportunity to estimate the long-term impact of marginal tax rates on earnings and labor supply, as well as evaluate the long-run incidence of employee and employer payroll taxes on earnings. We use administrative data from IKA, the social insurance agency in Greece, which manages payroll taxes and benefits for most private sector employees. The data include all individual workers in Greece who first entered the
496
QUARTERLY JOURNAL OF ECONOMICS
Downloaded from http://qje.oxfordjournals.org/ at Pennsylvania State University on June 26, 2012
IKA system in any of the 10 years from 1988 to 1997. The data include the year of birth, gender, nationality, the exact day of entry in IKA (i.e., the first day with covered IKA earnings), and detailed job level and earnings variables for each month of March of 2004 to 2009. In each of those March data sets and for each job, we have occupation, monthly earnings broken down into various types: regular earnings, overtime earnings, bonuses, and other forms of earnings. Besides overtime earnings, the data also include other measures of labor supply: monthly days of work, indicators for full day and full week work, which can be used to construct a standard measure of hours of work. Three main results are presented in our analysis. First, we showthat there is nodiscontinuity in the number and composition of entrants around the cut-off date showing that individuals did not have time to game the law by rushing into the labor market in the last weeks of 1992 after the lawwas enacted totake advantage of the old regime. This finding is crucial for the validity of the subsequent RDD analysis. Second, we find no evidence of labor supply effects of the tax change both along the extensive and intensive margins. Along the extensive margin, the reform should have induced highly skilled workers to shift to sectors not covered by IKA (such as the public sector, or specific professions such as the self-employed not covered by IKA, or emigration to foreign countries). However, we do not find any evidence of a significant discontinuity in the number of currently highly paid workers in the IKA system by date of entry around the entry cut-off date. Along the intensive margin, we find no evidence of a discontinuity in labor supply measures (such as monthly hours of work, overtime, or number of jobs) among highly paid workers by date of entry around the entry cut-off date. Those two results combined imply no labor supply responses along either the extensive and intensive margins and hence low efficiency costs of payroll taxes for upper earners. Third, we obtain nonstandard tax incidence results. In principle, individuals entering shortly before 1993 and shortly after 1993 should be identical to employers and hence should receive the same gross earnings—as they are equally productive and supply the same amount of labor based on our earlier findings. However, we find that employers compensate new regime employees for their higher employer payroll taxes but not for their higher employee payroll taxes. As a result, new regime employees above
EARNINGS DETERMINATION AND TAXES
497
II. INSTITUTIONAL SETTING, DATA, AND CONCEPTUAL FRAMEWORK II.A. The Greek Payroll Tax System and the 1992 Reform Social insurance in Greece is fragmented along occupational lines. IKA, the social insurance scheme for private sector employees, covers about 2.0 million contributors, or 45% of all active workers. The rest are divided among OAEE, the own-account workers’ scheme for the self-employed with over 800,000 contributors,5 the farmers’ scheme with 700,000 contributors, the civil servants’ scheme with 450,000 contributors, as well as a number of small special schemes covering specific professions such as doctor, lawyers, or engineers. This article focuses exclusively on 4. For example, see Chetty, Looney, and Kroft (2009) and Finkelstein (2009) on tax salience and Chetty and Saez (2009) on tax information. 5. This group includes employees in the informal sector who should in principle be classified as IKA employees but are presented as self-employed contractors by employers for tax evasion reasons.
Downloaded from http://qje.oxfordjournals.org/ at Pennsylvania State University on June 26, 2012
the cap have (a) higher labor costs, that is, gross earnings including all payroll taxes than old regime employers, (b) same posted earnings (the official measure of earnings which excludes employer payroll taxes but includes employee payroll taxes), (c) lower net earnings (when deducting all payroll taxes). Importantly, this nonstandard result might be due to the inability of employers to pay similar workers differently when they are subject to different taxes. We discuss in Section IV potential explanations for such constraints, including pay fairness norms, bargaining models, or seniority based pay, that have been presented in the literature. Therefore, tax incidence for an across the board payroll tax change might well be different than what we obtain here. Our study therefore complements a growing literature showing that the institutional and informational contexts that are ignored in standard models actually play a crucial role in behavioral responses to taxation.4 Our article is organized as follows. Section II presents the institutional details, the administrative data we use for the analysis, and the standard conceptual framework. Section III presents our empirical results. Section IV discusses potential explanations and policy implications. Additional results are presented in Appendix. All such appendix material is in an Online Appendix.
498
QUARTERLY JOURNAL OF ECONOMICS TABLE I IKA PAYROLL TAX SYSTEM Employer tax
Employee tax
rate τR
rate τE
34.41%
Panel B. Monthly earning cap for contributions (2009) Old regime (individuals with covered earnings before 1/1/1993)
e 2,432.25
New Regime (individuals with no covered earnings before 1/1/1993)
e 5,543.25
Notes: Panel A displays contribution rates for employees covered by IKA in the most common case (coverage code 101). IKA contributions are assessed as a percentage of monthly earnings and shared between employees and employers. Those contributions fund retirement benefits, sickness benefits, unemployment benefits, and various other smaller benefits. Contributions vary by coverage code corresponding to the occupation/sector of the employee. For example, contribution rates are higher in hazardous occupations. IKA covers a total of 2 million employees (45% of all active workers in Greece). Panel B displays the earnings caps for IKA contributions. The cap applies on monthly earnings. The cap for employer contributions is based on the sum of monthly earnings paid to a given employee (including bonuses, overtime, etc.). The cap for employee contributions is based on the sum of monthly earnings from all covered jobs for the given employee (employees with multiple jobs who reach the cap and have overpaid contributions receive a refund from the government). As of 2009, the cap is 2,432.25 euros for old regime workers. Old regime workers are workers with positive covered earnings before 1/1/1993. The cap is 2.28 times higher at 5,543.25 euros for new regime workers. New regime workers are workers with no covered earnings before 1/1/1993. The caps have increased annually toreflect approximately cost of living changes (legislated changes).
IKA earnings and discusses in detail the possibility of leaving IKA for another scheme, which is part of the extensive labor supply response.6 As shown in Table I Panel A, in the most common case, the total employer tax rate is 28.06% of earnings and the total employee tax rate is 16% of earnings for workers insured under the IKA scheme.7 In our analysis, we always use the actual tax rates faced by each worker. Employer contributions are calculated on top of posted earnings, while employee contributions are deducted from posted earnings. The same contribution rates apply to all 6. There are significant differences in social insurance arrangements across schemes, in terms of contribution rates and benefits. Typically, the special and public sector schemes are more generous than IKA, itself more generous than the self-employed and the farmers’ schemes. 7. Those contributions cover health, retirement, unemployment, and various other smaller benefits. Workers in occupations classified as hazardous (about 40% of IKA contributors fall into that category) pay even higher rates.
Downloaded from http://qje.oxfordjournals.org/ at Pennsylvania State University on June 26, 2012
Panel A. Contribution rates (most common case) Retirement benefits 16.33% 9.67% Sickness benefits 5.10% 2.55% Unemployment benefits 5.53% 2.43% Other benefits 1.10% 1.35% Total 28.06% 16.00%
Combined rate (τ +τ ) τ= R E (1+τR )
EARNINGS DETERMINATION AND TAXES
499
Interactions with the Income Tax. Income taxes are based on annual income net of all social security contributions and follow a progressive schedule, with marginal rates ranging from 15% to 40% in 2009. Income taxes are also withheld at source; final income taxes due are determined after the end of the financial year, when income returns are assessed taking into consideration tax relief and income from other sources. Importantly, the income tax schedule is the same for old and new regime workers. As a result, the income tax does not add to the tax wedge between old and new regime and hence does not need to be incorporated in our analysis (see later discussion). 8. Note that new regime workers had no cap at all from 1993 to 2003. A new regime cap equal to 2.28 times the old regime cap was introduced in 2004.
Downloaded from http://qje.oxfordjournals.org/ at Pennsylvania State University on June 26, 2012
earnings irrespective of type (regular pay, overtime, bonus, etc.) or contract (full-time or part-time). Social insurance contributions are payable from the first euro earned and are always deducted at source by employers. Importantly and as shown in Panel B of Table I, contributions are based on monthly earnings and apply only up to a cap, above which no payroll taxes apply. In 2009, for employees under the old regime(i.e., thoseemployeeswhohaveIKAcoveredearningsbefore January 1, 1993), the cap was set at e2,432 of monthly earnings. For employees under the new regime (i.e., those employees who do not have IKA covered earnings before January 1, 1993), the cap was set at e5,543.8 Both caps increase slightly each year, and by the same proportion, to reflect nominal increases in pay. There is no formal indexation and increases are legislated each year. The contributions cap applies to all earnings irrespective of type, that is, it is calculated by adding together earnings from regular pay, overtime, bonus, and so on earned in a given month. In the case of employees working for multiple employers, the cap for employer payroll taxes is based on monthly earnings within a given employer while the cap for employee payroll taxes is based on the sum of earnings across all employers. In practice, employers withhold both employee and employer taxes from paychecks up to the monthly cap. Multi-employer workers can apply to IKA for a refund of their employee contributions (but not the corresponding employer contributions) paid in excess of the cap.
500
QUARTERLY JOURNAL OF ECONOMICS
Downloaded from http://qje.oxfordjournals.org/ at Pennsylvania State University on June 26, 2012
The 1992 Pension Reform Act. On October 7, 1992, Greece enacted the Pension Reform Act of 1992 (Law 2084/1992) to restore financial balance of the public retirement system. The reform was debated in Parliament in September 1992. It was approved in late September. It was signed by the president of the Republic on October 1 and became officially law on October 7. Although reforming pensions had been discussed for a long time, implementing a cohort-based payroll tax reform was not proposed until late in the parliamentary debate. This timing left little time to game the reform, as we shall discuss and analyze empirically in detail. On the contribution side, as mentioned, new insurees, defined as individuals who did not have any covered earnings before January 1, 1993, face a higher upper earnings ceiling (or, until 2003, no upper ceiling at all) for payroll taxes. Social insurance contribution rates are always the same for new and old insurees. The law also changed the retirement benefits computation for new insurees. Pension benefits (at the normal retirement age) are equal to number of years with covered earnings times the accrual rate times reference earnings. Since 2002, the accrual rate is 2% for both new and old regime workers. Reference earnings in the new regime no longer include holiday allowances, leading to a reduction of about 14% of projected benefits on average. Since 2002, reference earnings are computed as average earnings up to the payroll tax cap of the best 5 years among the last 10 (before retirement). Because the cap for new regime workers is 2.28 times higher, reference earnings for highly paid new regime workers can be substantially higher than for old regime workers. Partly offsetting this effect, there is a maximum pension cap equal to 50% of the new payroll tax cap that applies to both new and old regime employees but typically binds only for new regime workers with long careers and high earnings. Therefore, in net, new regime workers with end-of-career earnings substantially above the old cap get somewhat more generous pensions than old regime workers with the same earnings, creating a positive lifetime wealth effect for new regime workers (relative to old regime workers). In contrast, new regime workers with end-ofcareer earnings below or only slightly above the cap get somewhat less generous pensions than old regime workers creating a negative lifetime wealth effect. In principle, such wealth effects could lead to labor supply responses through wealth effects. For the relatively young workers we study, it is unlikely that this effect would be very large as pension benefits are far into the future and
EARNINGS DETERMINATION AND TAXES
501
II.B. Administrative IKA Database The data we use are extracted from the IKA administrative database and include all individual workers in Greece who first entered the IKA system in any of the 10 calendar years from 1988 to 1997. Hence our data spans 10 cohorts, 5 before the reform and 5 after the reform. The core data include the year of birth, gender, nationality, the exact day of entry in IKA (i.e., the first day with covered IKA earnings), insurance regime (old vs. new), and (scrambled) individual identifiers. Importantly, the core data contain all 1988–1997 entrants, including all those who have subsequently stopped working in the IKA covered sector. We also have detailed job-level and earnings variables for each March from 2004 to 2009 for all the 1988–1997 entrants with IKA covered earnings in any of those months.11 In each of those March data sets, and for each job, we have the number of days of work, occupation, monthly earnings, as well as full day and full week indicators of labor supply. Individuals with more than one job during the month will have more than one job record. The monthly earnings are broken down into various types: regular earnings, overtime earnings, bonuses, and other 9. For example, a reform in 2002 narrowed the difference in benefits between new and old regime workers. The discontinuity across cohorts in benefits could also affect retirement age and individual savings. Hence, the sharp cohort based discontinuity created by the Greek reform could also be a useful “natural experiment” to analyze retirement and savings decisions to changes in social security benefits down the road. 10. Since 2002, as mentioned, pensions are based on the highest 5 years of earnings (up to the cap) among the last 10. Prior to 2002, pensions were based only on the last five years. These rules apply to both old and new regime workers. 11. An individual who entered in the period 1988–1997 but did not have any IKA earnings in any of the March months of 2004–2009 would be present in the core data but not in the earnings data.
Downloaded from http://qje.oxfordjournals.org/ at Pennsylvania State University on June 26, 2012
benefits are still highly uncertain, both because of potential future reforms and because of uncertainty in end-of-career earnings. 9 Most important for our present analysis, retirement contributions can be considered as a pure tax for workers far from retirement both in the old and new regime.10 All the other contributions that finance sickness, unemployment, and other benefits create virtually no linkage between the levels of contributions and benefits and can also be considered pure taxes. Therefore, in this study, we always consider all payroll taxes as pure taxes.
502
QUARTERLY JOURNAL OF ECONOMICS
12. We show in the Online Appendix that comparing workers closer to the cut-off date (1991–1992 entrants vs. 1993–1994 entrants) generates qualitatively similar differences across all those variables. Quantitatively, the differences are smaller as those two alternative groups are closer.
Downloaded from http://qje.oxfordjournals.org/ at Pennsylvania State University on June 26, 2012
forms of earnings. Earnings are reported in full with no cap. The data also include the exact employer and employee tax rates (which depend on the insurance code), as well as the exact amount of employer and employee payroll taxes paid out for the corresponding job. Finally, the data include several employer-level variables: industrial sector, geographical location, total number of employees in the firm, as well as an employer (scrambled) identifier. The longitudinal structure of the database allow us to link both individuals and employers across time periods. For most of our analysis, we create data at the individual level. For individuals with multiple employers, we define the main employer as the employer for which regular earnings are highest. For simplicity of exposition, all our main text results involving earnings are based solely on March 2009 earnings. As shown in the Online Appendix, results using the full set of waves are extremely close and only marginally more precise than results using only March 2009 data. This is due to the fact that the fraction of workers above the cap grows over time (with seniority) and the fact that clustering standard errors at the individual level sharply reduces the gain in precision from combining waves. Table II reports summary statistics, as of March 2009, for four groups of workers with positive IKA earnings in March 2009: (1) Those entering IKA from 1988 to1992, that is, oldregime workers; (2) those entering IKA from 1993 to 1997, that is, new regime workers; (3) those entering IKA from 1988 to 1992 with March 2009 posted earnings above e 2,432 (the old regime cap); (4) those entering IKA from 1993 to 1997 with March 2009 posted earnings above e 2,432 (the oldregime cap). Four points are worth noting. 12 First, virtually all the old entrants are in the old regime as expected. About 95% of new entrants are in the new regime. The number is not 100% because individuals who had covered earnings in any insurance scheme (not necessarily IKA) before 1993 qualify for the old regime. As we shall see, this does not invalidate the analysis as entering IKA after 1992 is still a very strong predictor of regime status. Second, about 12% of all workers have earnings above the old cap (e 2,432), while only about 1–2% of all workers have earnings above the new cap (e 5,543). As shown in the table, the fraction of workers above the old cap is higher
503
EARNINGS DETERMINATION AND TAXES TABLE II SUMMARY STATISTICS (MARCH 2009)
(τR +τE ) (1+τR )
MTR τ = Number of observations
1993–1997 entrants any positive earnings
(1)
(2)
(3)
(4)
0.3% 13.9%
95.4% 10.0%
1.1% 100.0%
91.7% 100.0%
1.9%
1.2%
14.1%
12.4%
e 1,648
e 1,468
e 4,335
e 4,144
e 1,430
e 1,282
e 3,147
e 2,891
10.4%
9.5%
21.2%
16.6%
9.0%
9.4%
32.4%
42.4%
53.7% 40.9 1.032 1055
49.1% 36.8 1.044 1416
65.5% 41.9 1.039 2059
61.0% 37.8 1.049 2124
21.9%
26.1%
17.8%
19.4%
23.8%
26.4%
0.6%
20.0%
13.7%
15.2%
0.1%
11.3%
29.3%
32.6%
0.5%
24.8%
203,089
217,045
27,595
21,669
1988–1992 1993–1997 entrants entrants posted posted earnings earnings above old cap above old cap
Notes: The table displays summary mean statistics for four groups of individuals with positive IKA covered earnings as of March 2009. Column (1) is the set of individuals who entered IKA (i.e., started having covered IKA earnings) from 1988 to 1992 (old regime). Column (2) is the set of individuals who entered IKA (i.e., started having covered IKA earnings) from 1993 to 1997 (new regime). Column (3) includes 1988–1992 entrants with total monthly posted earnings above 2,432 euros in March 2009 (old regime cap). Column (4) includes 1993–1997 entrants with total monthly posted earnings above 2,432 euros in March 2009 (old regime cap).The percent new regime is not 100% for 1993–1997 entrants because individuals who can prove they had covered earnings in another insurance scheme before 1/1/1993 qualify for the old regime under IKA rules. Number of workers in firm is the average number of employees in the firm the individual has his main job (defined as highest regular earnings). A change of job from March ’08 to March ’09 is defined as a change in the employer for the main job (where regular earnings are highest). Earnings are defined as earnings on which payroll taxes are computed (posted earnings). Regular earnings include only base pay and exclude bonuses, overtime, and other forms of earnings. The marginal tax rates (MTR) are set equal to 0 when the individual reaches the earnings cap corresponding to his/her regime.
Downloaded from http://qje.oxfordjournals.org/ at Pennsylvania State University on June 26, 2012
Percent new regime Percent above old cap (2,432 euros) Percent above new cap (5,543 euros) Average monthly posted earnings Average monthly posted regular earnings Percent with overtime Percent with bonuses Percent male Average age Number of jobs Number of workers in firm Percent changed jobs from March ’08 to March ’09 Average employer MTR τR Average employer MTR τE Average total
1988–1992 entrants any positive earnings
504
QUARTERLY JOURNAL OF ECONOMICS
II.C. Conceptual Framework We use three definitions of monthly earnings. First, gross earnings z are defined as earnings inclusive of employee and employer payroll taxes. Gross earnings can be interpreted as the total labor cost that employers pay for a given worker.14 Second, posted earnings w are defined as gross earnings net of employer payroll taxes. Earnings include not only the regular wages and salaries but also overtime pay, bonuses, as well as pay in arrears. It is therefore a broad definition of cash employment income used as the reference for computing payroll taxes and is also the standard reference for employer-employee compensation negotiations and decisions. Third, net earnings c are defined as earnings net of employee payroll taxes. This is the amount of disposable income (before individual income taxes, however) that the worker actually receives.15 We denote by τR and τE the employer and employee (respectively) marginal payroll tax rates. As described, those marginal ˉ which we call tax rates apply up to a threshold of earnings w, 13. The rates are not exactly zero because of workers with multiple employers. 14. The total exact labor cost might be slightly higher if employers offer additional fringe benefits. However, because the social security system is generous, such fringe benefits are rare in Greece. 15. As mentioned, individual income taxes are withheld at source as well so that take-home pay is c0 = c − T(c) where T(.) represents the withholding schedule for the income tax. Because the individual income tax applies uniformly across cohorts with no differentiation between old and new entrants, we do not need to incorporate the individual income tax in our analysis.
Downloaded from http://qje.oxfordjournals.org/ at Pennsylvania State University on June 26, 2012
for old entrants because old entrants are older and have longer work experience, and hence higher earnings. The same is true for the fraction of workers above the new cap. Third, workers above the old cap are more likely to have bonuses, more likely to be male, more likely to work in larger companies, and less likely to have changed employers from March 2008 toMarch 2009. Finally, the bottom rows of Table II show that new entrants face higher marginal and average payroll tax rates on average. The difference becomes especially large when looking at workers above the old cap. This is not surprising as old entrants above the old cap by definition should face no marginal payroll tax13 while most new entrants above the old cap are still below the new cap and hence face the full marginal payroll tax rates. As shown in the table, the difference in the total combinedmarginal tax rate between oldand new entrants above the old cap is almost 25 percentage points.
EARNINGS DETERMINATION AND TAXES
505
Labor Supply Responses. If the tax reform affects the net reward from work of new regime workers relative to old regime workers, we should expect labor supply responses both along the extensive and intensive margins, especially in the long run
Downloaded from http://qje.oxfordjournals.org/ at Pennsylvania State University on June 26, 2012
ˉ O the cap in the old regime (for pre-1993 the cap. We denote by w ˉ N the cap in the new regime (for those entering entrants) and by w after January 1, 1993). As of 2009 and as shown in Table I, recall ˉ O = e 2,432 and w ˉ N = 2.28 ∙ w ˉ O = e 5,543. that w R +τE ) E) As c = (1 − τE )w = [ (1−τ ]z = [1 − (τ(1+τ ]z, the sum of employer (1+τR ) R) and employee payroll taxes is equivalent to a combined tax rate R +τE ) ˉ ∙ (1 + τR ). In τ = (τ(1+τ up to a threshold of gross earnings ˉz = w R) Greece, the most common rates are τR = 28% and τE = 16% for a combined rate τ = 34.4% (Table I). We denote by ˉzO and ˉzN the old and new cap in terms of gross earnings. Similarly, we denote by ˉcO and ˉcN the old and new cap in terms of net earnings. Standard tax incidence prediction. Barring any gaming at the time of the reform, workers who entered shortly before January 1, 1993, versus shortly after January 1, 1993, should be very close substitutes in the labor market as they should have very similar characteristics in terms of age, gender, education, and work experience. Therefore, in a frictionless labor market, an employer maximizing profits should not be willing to pay more for a new regime worker than for an old regime worker with identical characteristics and hence identical marginal productivity. This implies that the tax differential between new regime and old regime workers should be borne entirely by workers: gross wages should be the same for both types of workers. Hence, posted wages should be lower for new regime workers above the old cap by the amount of the extra employer payroll tax rate. Similarly, net wages for new regime workers above the old cap should be lower by the amount of extra employer plus employee payroll tax rate. Therefore, when comparing workers just below and just above the entry cut-offdate, tax incidence should be completely independent of both the labor supply and the labor demand elasticities, providing a powerful test of the standard model. As we shall see, this standard model prediction is starkly rejected by the data and we discuss in Section IV potential explanations for our results. Importantly, note that the standard prediction applies to wages and not necessarily toearnings if labor supply is affected by the tax differential, hence the necessity to examine labor supply responses first.
506
QUARTERLY JOURNAL OF ECONOMICS
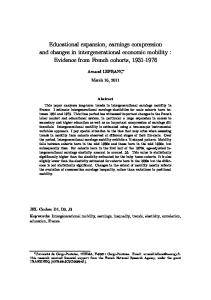
The figure displays the effects of the 1992 pension reform in Greece on the monthly budget constraint of private sector employees (covered by the IKA social insurance system). The x-axis represents monthly gross earnings (including both employer and employee payroll taxes). The y-axis represents monthly net earnings (earnings net of both employer and employee payroll taxes). The solid line is the old regime budget (for those entering the IKA system before 1993) and the dashed line is the new regime budget (for those entering the IKA system on or after 1993). The reform increased the cap in earnings subject to payroll taxes from zO to zN for new regime workers, hence shifting outward the kink point in the budget set where the payroll marginal tax rate ends. Along the extensive margin, workers with earnings above zO are induced by the reform to move away from the IKA sector (either drop out of the labor force, shift to another sector not covered by IKA, or move to a foreign country). Along the intensive margin, workers with monthly earnings belowzO are unaffected by the reform. Workers with earnings between zO and zN experience a substitution effect which decreases gross earnings (and also an income effect but small relative to substitution effects). Workers with earnings above zN experience only an income effect which increases gross earnings.
after the reform has been in place for many years. Labor supply affects earnings and hence can potentially impact the incidence test described above. Figure I depicts the effect of the tax change on the individual budget constraint set and utility maximizing choices in the (z, c)
Downloaded from http://qje.oxfordjournals.org/ at Pennsylvania State University on June 26, 2012
FIGURE I Conceptual Framework
EARNINGS DETERMINATION AND TAXES
507
16. The figure implicitly assumes standard incidence as described. We discuss how this is affected under other incidence assumptions. 17. In principle, labor supply responses should also generate a gap in the earnings distribution around the cap as it is suboptimal for workers to locate very close to the cap. Consistent with our finding of no labor supply responses, there is
Downloaded from http://qje.oxfordjournals.org/ at Pennsylvania State University on June 26, 2012
diagram where z is gross earnings and c is disposable income. Utility increases with disposable income c (as disposable income funds consumption) and decreases with z (as labor supply is costly).16 On the extensive margin, the reform reduces the net rewards from work in the IKA sector of highly paid workers—those with gross earnings above ˉzO absent the reform, that is, about the top decile earners. Such workers might decide to stop working entirely, migrate to other sectors (such as the public sector, the self-employed sector, or professions covered by special schemes), or to a foreign country. Hence, the extensive margin response should reduce the number of new regime workers above the old cap relative to old regime workers. Under the standard assumption that the cost of shifting sectors is proportional to earnings, we should expect the response to be proportional to the difference in average tax rates between old and new regime workers, and hence should be maximum at earnings level ˉzN . The empirical literature suggests that extensive labor supply responses are more important than intensive labor supply responses (see e.g., Heckman 1993). In the case of the Greek reform however, as individuals affected are skilled workers with high earnings potential, dropping out of the labor force entirely is unlikely. The other sectors not covered by IKA are also imperfect substitutes for IKA jobs limiting potential behavioral responses. Finally, language and cultural barriers might limit international mobility. Indeed, our empirical analysis finds no significant effect of the reform along the extensive margin. On the intensive margin, new regime workers with gross earnings between ˉzO and ˉzN experience an increase in marginal payroll tax rates from 0 to τ so that their net-of-tax rate decreases from 1 to 1−τ . This will create primarily a substitution effect that will reduce hours of work and hence gross earnings. New regime workers with gross earnings above ˉzN experience a pure income effect with no change in net-of-tax rates (Figure I). This income effect should lead to an increase in hours of work, and earnings, under the standard assumption that leisure is a normal good. As we shall see, we do not find any effect of the reform on hours of work, implying no intensive labor supply response. 17
508
QUARTERLY JOURNAL OF ECONOMICS
III. EMPIRICAL ANALYSIS III.A. Estimation Design
(1) Yi = α0 + β0 ∙ 1(ti ≥ 0)+
K X k=1
αk ∙ tki +
K X k=1
βk ∙ tki ∙ 1(ti ≥ 0)+ Xi γ + εi ,
where ti is the entry date of individual i normalized so that t = 0 at the cut-off line of January 1, 1993, and Xi denotes a vector of additional control variables. The coefficient of interest capturing the effect of the discontinuity at t = 0 is β0 (as the polynomials in tk are 0 at t = 0). Polynomials in t are included to control in a flexible way for the effect of date of entry t on outcome Y. There are two main ways to assess robustness of the RDD results to the specification: (1) restrict the sample to a narrower window around the cut-off date, which we will do by limiting the sample to 1991–1994 entrants (instead of 1988–1997 entrants), (2) include higher order polynomials (the parameter K in equation (1)) in the regression specification. A simple way to illustrate the RDD is to plot average outcome Y by date of entry month bins and draw the quadratic fit below and above the cut-off line. III.B. Identification Checks As mentioned, a key requirement for identification is that the workers entering just before and just after the cut-off dates are comparable. This identification requirement could be invalidated no evidence of such a gap in the empirical earnings density distribution (Liebman and Saez 2006 also fail to find a gap in the earnings distribution at the U.S. Social Security cap).
Downloaded from http://qje.oxfordjournals.org/ at Pennsylvania State University on June 26, 2012
As the 1992 reform is based on date of entry in the insurance system, our empirical analysis compares current labor market outcomes based on date of entry into the IKA system. The reform creates a sharp discontinuity by date of entry with January 1, 1993, being the dividing line. Because earnings and other characteristics vary by date of entry—for example, older entrants have higher earnings because of experience and seniority (Table II)— we cannot directly compare old and new entrants. However, absent the 1992 reform, we should expect differences between old and new entrants to shrink as we compare entrants just before and just after the cut-off line. This feature leads naturally to a regression discontinuity design (RDD). Therefore, we will identify tax effects by running regressions of the form:
EARNINGS DETERMINATION AND TAXES
509
18. We show in the Online Appendix that there is no discontinuity at the daily level at the cut-off entry date in a narrow six-month window around the reform (Figure A1) nor any discontinuity in the age and gender composition of entrants at the reform cut-off date (Figure A2). We also show that although unemployment was trending up during the period 1988–1997, there was no discontinuity in unemployment rates at the time of the reform especially for young workers (Figure A3).
Downloaded from http://qje.oxfordjournals.org/ at Pennsylvania State University on June 26, 2012
if some workers had strategically selected their date of entry in response to the reform enacted in October 1992. Therefore, Figure II plots the number of workers by date of entry. Importantly, we use the sample of all entrants, regardless of presence of IKA earnings in 2004–2009. Therefore, this analysis captures behavioral responses solely due to entry date selection and is not affected by subsequent extensive labor supply responses, that is, workers leaving the IKA sector after entry. Panel A focuses on all 1988–1997 entrants and plots the number of entrants at a monthly frequency. Panel A shows large month-to-month variations in the number of entrants due in part to seasonality effects. Importantly, as confirmed by the quadratic fit curves, there is no visible discontinuity in the number of entrants around the cut-off date. Specifically, we observe no spike in the number of entrants just before the cut-offdate. Panel B narrows the sample to males aged 22 to 30 at entry, a subsample with higher expected earnings, and hence more likely to be affected by the reform. The series are slightly smoother for that subsample and display no discontinuity at all at the cut-off. 18 Those identification checks are formally estimated in a regression framework and presented in Table III, Panel A. The table displays the coefficients (with robust standard errors in parentheses) from regressing the number of monthly entrants, and the number of male entrants aged 22–30 at entry (listed in the left column) on a dummy for entering IKA on or after 1/1/1993. Each column corresponds to variations in the RDD specification. Column (1) estimates includes a linear entry date (normalized to 0 at 1/1/1993) and a linear entry date interacted with the dummy for entering IKA after 1/1/1993. Column (2) uses the same controls as column (1) but limits the sample to those entering IKA from 1991 to 1994. Columns (3)–(5) use all 1988–1997 entrants but add successively monthly dummies in column (3), quadratic date trends in column (4) (quadratic term and quadratic term interacted with the dummy for entering IKA after 1/1/1993), cubic date trends in column (5) (cubic term and cubic term interacted
510
QUARTERLY JOURNAL OF ECONOMICS
Panel A displays the number of entrants by month of entry in the sample of all entrants (regardless of subsequent IKA earnings). Panel B displays the number of male entrants aged22 to30 at entry by month of entry (males aged22 to30 at entry have the highest expected earnings and hence are the most likely to be affected by the cap increase in the new regime). In both panels, the curve on each side of the discontinuity is the best quadratic fit. Both graphs display no discontinuity at the cut-off date showing that individuals did not game the system by entering IKA before 1993 after the reform was enacted in October 1992. Source is IKA administrative Social Security earnings data.
Downloaded from http://qje.oxfordjournals.org/ at Pennsylvania State University on June 26, 2012
FIGURE II Identification Checks: Number of Entrants by Month of Entry
120
48
Total average tax rate (tR +tE ) (%) t = (1+t R) Number of observations
0.54 (0.04) 420,134
0.64 (0.06) 160,857
0.52 (0.04) 420,134
89.21 (0.12) -7.89 (0.16) 2.27 (0.06)
120
88.97 (0.27) -7.38 (0.33) 2.27 (0.13) 0.63 (0.08) 420,134
0.60 (0.06) 420,134
120
–1356 (1426) –315 (272)
(5)
1988–1997 entrants
87.38 (0.19) -7.52 (0.24) 2.22 (0.09)
120
–47 (1029) –67 (197)
(4)
1988–1997 entrants
Downloaded from http://qje.oxfordjournals.org/ at Pennsylvania State University on June 26, 2012
R
Panel B. First stage (workers with positive earnings in March 2009) Percent in new regime (%) 89.32 89.25 (0.12) (0.22) Percent with posted earnings -7.91 -7.57 above cap (%) (0.16) (0.25) Total marginal tax rate 2.29 2.30 (τR +τE ) τ = (1+τ (%) (0.06) (0.10) )
Number of observations
–1679 (701) –546 (138)
(3)
(2)
(1)
–1245 (1237) –9 (218)
1988–1997 entrants
1991–1994 entrants only
1988–1997 entrants
Panel A. Identification checks (all entrants) Number of monthly entrants –2061 (822) Number of monthly entrants –500 (males aged 22 to 30 at entry) (157)
OUTCOMES
SAMPLE
TABLE III IDENTIFICATION CHECKS AND FIRST-STAGE RESULTS EARNINGS DETERMINATION AND TAXES
511
Yes
(2)
(1)
Yes
1991–1994 entrants only
1988–1997 entrants
Yes Yes
(3)
1988–1997 entrants
Yes Yes Yes
(4)
1988–1997 entrants
Downloaded from http://qje.oxfordjournals.org/ at Pennsylvania State University on June 26, 2012
Yes Yes Yes Yes
(5)
1988–1997 entrants
Notes. The table displays the coefficients (with robust standard errors in parentheses) from regressing various outcomes (listed in the left-hand column) on a dummy for entering IKA on or after 1/1/1993 (which corresponds to new regime with higher earnings cap). The sample in Panel A includes all entrants (regardless of their subsequent IKA earnings). The sample in Panel B includes all entrants with positive monthly earnings in March 2009. For all dummy outcomes, estimates are expressed in percent (i.e., the dummy is set equal to 0 or 100 in the regression).Column (1) estimates includes a linear entry date (normalized to 0 at 1/1/1993) and a linear entry date interacted with the dummy for entering IKA after 1/1/1993. Column (2) uses the same controls as column (1) but limits the sample to those entering IKA from 1991 to 1994. Columns (3)–(5) use all 1988–1997 entrants but add successively monthly dummies (col. 3), quadratic date trends (quadratic term and quadratic term interacted with the dummy for entering IKA after 1/1/1993), cubic date trends (cubic term and cubic term interacted with the dummy for entering IKA after 1/1/1993).In Panel A, we collapse the data by month of entry and run the regression at the monthly level (120 observations with 1988–1997 entrants, and 48 observations with 1991–1994 entrants). In Panel B, the regression is based on micro-level data. New regime is a dummy for being in the new regime (with the higher cap). Posted earnings above cap is a dummy for having posted earnings above the payroll tax earnings cap corresponding to the regime the individual is in. Total marginal tax rate is based on combined employee and employer payroll tax rates and set at 0 when the individual is above the cap. Total average tax rate combines employee and employer payroll average tax rates.
Included controls Linear entry date trends Monthly dummies Quadratic date trends Cubic entry date trends
SAMPLE
TABLE III (CONTINUED)
512 QUARTERLY JOURNAL OF ECONOMICS
EARNINGS DETERMINATION AND TAXES
513
III.C. First Stage Panel A on Figure III plots the fraction of entrants in the new regime by month of entry in the IKA insurance scheme among workers with positive earnings in March 2009. Unsurprisingly, there is an enormous discontinuity as hardly any worker entering IKA before 1/1/1993 is in the new regime and about 95% of workers entering IKA on or after 1/1/1993 are in the new regime. As mentioned, the number is not 100% because postreform IKA entrants may have made contributions to another insurance scheme before 1993, in which case they qualify for the old regime. Panel B in Figure III plots the fraction of workers (among entrants with positive earnings as of March 2009) above the earnings cap (e 2,432 for old regime workers and e 5,543 for new regime workers). The graph shows a sharp discontinuity at the cut-off 19. In contrast tothe UnitedStates, most part-time andlow-paidjobs for young workers in Greece are not in the formal covered sector and hence do not qualify workers for the old regime status.
Downloaded from http://qje.oxfordjournals.org/ at Pennsylvania State University on June 26, 2012
with the dummy for entering IKA after 1/1/1993). Consistent with the graphical analysis, the identification checks variables do not display robust significant results. The coefficient is significant when only linear trends are included, but this result is not robust to narrowing the window around the reform or adding nonlinear trends. The combination of the graphical and regression results shows that individuals did not try to game the system by rushing into IKA covered jobs just after the law was passed in October 1992 and before January 1, 1993, to benefit from the more advantageous old regime. There are three possible explanations for the absence of gaming effects. First, there was very little time between the time the law was enacted on October 7, 1992, and January 1, 1993. Second, formal IKA covered jobs cannot easily be found or created.19 Third, the difference between the two regimes might not have loomed large for young workers as they are very far from retirement to care about changes in retirement benefits and, at the very start of their career, their earnings are almost always below the old cap making the difference in caps irrelevant for a number of years. The absence of gaming is critical for our subsequent analysis because gaming could have created a discontinuity in the composition of workers just belowand just above the cut-off, which would have invalidated the RDD estimation.
514
QUARTERLY JOURNAL OF ECONOMICS
In both panels, the sample is all workers with positive earnings in the IKA social insurance scheme as of March 2009. Panel A displays the fraction of workers in the new regime by month of entry into the IKA system. Workers entering IKA before 1993 are all in the old regime. The vast majority of workers entering IKA on or after 1993 are in the new regime. Some post-1993 entrants are in old regime because workers who had covered earnings before 1993 in any other social insurance scheme (outside IKA) still qualify for the old regime. Panel B displays the fraction of workers with earnings above the payroll tax cap. There is a sharp drop at the 1/1/1993 cut-off date as the cap for new regime workers is 2.28 times higher than for old regime workers. In both panels, the curve on each side of the discontinuity is the best quadratic fit. Source is IKA administrative Social Security earnings data.
Downloaded from http://qje.oxfordjournals.org/ at Pennsylvania State University on June 26, 2012
FIGURE III First Stage: Fraction in New Regime and Above Cap by Month of Entry
EARNINGS DETERMINATION AND TAXES
515
III.D. Labor Supply As discussed, the reform can generate labor supply responses along both the extensive and intensive margins. As extensive margin responses affect the composition of workers, it can bias intensive margin estimates. Hence, we focus first on extensive margin responses. Extensive Responses. Our discussion showed that extensive margin responses should create a deficit of highly paid workers among new entrants as some of those workers leave the IKA sector (for other sectors, nonwork, or foreign countries). This deficit will translate into a discontinuity in the fraction of workers paid above the old cap at the entry cut-off date. Therefore, Figure IV, Panel A plots the fraction of workers with posted earnings above the old cap (e 2,432) by month of entry among workers with positive earnings in March 2009. There is a downward trend because earnings increase with seniority, but importantly, the figure shows no evidence of a discontinuity at the
Downloaded from http://qje.oxfordjournals.org/ at Pennsylvania State University on June 26, 2012
date showing that the fraction above the cap drops from about 12% down to 2% at the discontinuity, reflecting the fact that most postreform entrants are in the new regime with the much higher cap. The fraction above the cap decreases smoothly by date of entry both among the old and new entrants because average earnings increase with age and experience. Hence, Figure III demonstrates that the cohort-based reform does create a very strong first-stage effect on the probability of facing payroll taxes at the margin. Those first-stage effects are formally estimated in a regression framework and presented in Table III, Panel B. Total Marginal Tax Rate (Average Tax Rate) is the combined marginal (average) payroll tax rate adding employee and employer payroll tax rates. The marginal tax rate is 0 when the individual worker is above the cap. The first-stage results in terms of (a) percent in new regime, (b) percent reaching the cap (of their respective regime), (c) average marginal tax rate, and (d) average tax rate all display a very significant discontinuity that is very robust for the various specifications such as restricting the sample to 1991– 1994 or the number of polynomials date of entry controls included in the regression. Those results confirm the graphical results from Figure III showing that the Greek payroll tax reform did generate a very strong first-stage effect.
516
QUARTERLY JOURNAL OF ECONOMICS
Panel A displays the fraction of workers with IKA earnings above the old cap in March 2009 (among all workers with positive earnings in March 2009) by month of entry. Panel B displays, by month of entry in IKA, the average number of monthly hours of work among high earners in March 2009 (defined as those with regular earnings per day of work above 2500/25 euros, i.e., would reach the old cap by working full month). In both panels, the curve on each side of the discontinuity is the best quadratic fit. Both graphs display no significant discontinuity at the cut-off date. Panel A implies that highly skilled workers in the new regime did not respond to the higher tax along the extensive margin. Panel B implies that there is no intensive labor supply response to the higher marginal payroll tax rate in the new regime.
Downloaded from http://qje.oxfordjournals.org/ at Pennsylvania State University on June 26, 2012
FIGURE IV Labor Supply Responses
EARNINGS DETERMINATION AND TAXES
517
Intensive Responses. Our data allow us to study intensive labor supply decisions along several dimensions: hours of work, days of work per month, overtime, and multiple jobs. Although hours of work are not directly recorded, the administrative data have such rich labor supply variables that we can construct monthly hours of work as follows. In Greece, a full day implies eight hours of work. Part day would be anything below eight hours. As the most common part day is half day, we assume that part day corresponds to four hours of work. We assume that overtime corresponds to additional hours of work over and above the regular hours. We compute the hours of work corresponding toovertime by assuming that the hourly wage rate in overtime is the same as in regular time. Finally, we cap monthly hours of work at 300 per month (less than 1% of the sample hits this cap). Our measure of hours of work certainly has some measurement error, but significant measurement error in hours is alsopresent in self-reported survey data. More important, our measure of marginal tax rates, which is relevant for labor supply estimation, is not affected by the measurement error in hours as marginal tax rates are based on total earnings, which have very little measurement error. Weselect oursampleas follows toanalyzeintensiveresponses. First, we compute the daily regular earnings by dividing regular monthly earnings by the number of days of work in the month. Recall that regular earnings include only base pay and do not include bonuses, overtime, and other special payments. Second, 20. However, note that the slope of the fitted curves seems to be changing around the cut-off date.
Downloaded from http://qje.oxfordjournals.org/ at Pennsylvania State University on June 26, 2012
cut-off date.20 Panel A in Table IV presents the corresponding regression results (using the same set of specifications as in Table III). Consistent with the graphical analysis, the percent of workers with earnings above the old cap does not display any robust significant discontinuity at the cut-off date. The coefficient is significant—and actually of the wrong sign relative to the theoretical prediction—when only linear trends are included but this result is not robust to narrowing the window around the reform or adding nonlinear trends. This represents compelling evidence that the reform did not generate a labor supply response along the extensive margin. As a caveat, we should note that the standard errors around the estimates are relatively large so we cannot rule out moderate behavioral responses along the extensive margin, a point we come back to in Section IV.
28,124
10,587
28,124
28,124
−0.088 (0.081)
−0.107 (0.055)
−0.037 (0.033)
−0.089 (0.060)
Downloaded from http://qje.oxfordjournals.org/ at Pennsylvania State University on June 26, 2012
Panel C. Intensive labor supply elasticities Elasticity of hours of −0.042 work with respect to (0.033) the net of employee payroll tax rate (1-τE ) Number of observations 28,124
1.12 (1.19) −0.037 (0.083) 1.86 (1.45) −0.53 (0.85) 28,124
1.22 (0.86) −0.058 (0.059) 2.37 (1.04) −1.02 (0.63) 28,124
Panel B. Intensive margin (workers with daily regular posted earnings above old cap) Hours of work 0.40 1.16 0.31 (0.56) (0.92) (0.56) Number of days in regular job −0.041 −0.037 −0.052 (0.038) (0.064) (0.039) Percent with overtime 0.69 2.53 0.60 (0.67) (1.11) (0.68) Percent with multiple jobs −0.46 −0.70 −0.46 (0.41) (0.66) (0.42) Number of observations 28,124 10,587 28,124
(5)
1988–1997 entrants
−0.50 (0.41) 420,134
(4)
1988–1997 entrants
−0.04 (0.30) 420,134
−0.32 (0.32) 160,857
(3)
(2)
(1)
0.45 (0.20) 420,134
1988–1997 entrants
1991–1994 entrants only
1988–1997 entrants
0.47 (0.20) 420,134
Panel A. Extensive margin Percent with earnings above old cap Number of observations
OUTCOMES
SAMPLE
TABLE IV LABOR SUPPLY RESPONSES
518 QUARTERLY JOURNAL OF ECONOMICS
Yes
18,846
50,084 Yes
0.092 (0.129)
(2)
(1) 0.120 (0.074)
1991–1994 entrants only
1988–1997 entrants
Yes Yes
50,084
0.141 (0.074)
(3)
1988–1997 entrants
Yes Yes Yes
50,084
0.212 (0.120)
(4)
1988–1997 entrants
Downloaded from http://qje.oxfordjournals.org/ at Pennsylvania State University on June 26, 2012
Yes Yes Yes Yes
50,084
−0.006 (0.175)
(5)
1988–1997 entrants
Notes. The table displays the coefficients (with robust standard errors in parentheses) from regressing various outcomes (listed in the left-hand column) on a dummy for entering IKA on or after 1/1/1993 (which corresponds to new regime with higher earnings cap). For all dummy outcomes, estimates are expressed in percent (i.e., the dummy is set equal to 0 or 100 in the regression).Column (1) estimates includes a linear entry date (normalized to 0 at 1/1/1993) and a linear entry date interacted with the dummy for entering IKA after 1/1/1993. Column (2) uses the same controls as column (1) but limits the sample to those entering IKA from 1991 to 1994. Columns (3)–(5) use all 1988–1997 entrants but add successively Monthly dummies (col. 3), quadratic date trends (quadratic term and quadratic term interacted with the dummy for entering IKA after 1/1/1993), cubic date trends (cubic term and cubic term interacted with the dummy for entering IKA after 1/1/1993). In Panel A, the sample includes all workers with positive earnings in March 2009 and regresses a dummy for having posted earnings above the old payroll tax earnings cap (2,432 euros). In Panel B, the sample is limited to workers with regular earnings per day of work above 2500/25 euros, that is, would reach the old cap by working full month. Number of days is the recorded number of days worked during the month. Percent with Overtime is a dummy for having positive overtime earnings. Percent with Multiple jobs is a dummy for having positive earnings from more than one employer. Monthly hours of work are estimated as number of days in the regular job times 8 (or 4 if part-day) times (1+overtime earnings/regular earnings). Monthly hours are capped at 300.In Panel C, the elasticity of hours of work is obtained from a 2SLS regression of log(hours) on log (1 − τE ) where τE is employee marginal payroll tax rate instrumented with a dummy for entering IKA after 1/1/1993 using the same sample as Panel B. The elasticity of posted earnings is obtained from a 2SLS regression of log(posted earnings) on log (1 − τE ) where τE is employee marginal payroll tax rate instrumented with a dummy for entering IKA after 1/1/1993 using the sample of all workers above the old cap (posted earnings above 2,432 in March 2009).
Included controls Linear entry date trends Monthly dummies Quadratic date trends Cubic entry date trends
Elasticity of posted earnings with respect to the net of employee payroll tax rate (1-τE ) Number of observations
SAMPLE
TABLE IV (CONTINUED) EARNINGS DETERMINATION AND TAXES
519
520
QUARTERLY JOURNAL OF ECONOMICS
III.E. Tax Incidence As discussed in Section II.C, tax incidence analysis can be directly done in terms of earnings (as opposed to wage rates) because we have shown that there are no labor supply responses along both the extensive and intensive margins. The prediction of
Downloaded from http://qje.oxfordjournals.org/ at Pennsylvania State University on June 26, 2012
we select workers with daily regular earnings above e 2,500 25 = 100. We select this cut-off because IKA assumes that full time workers have 25 insurance days per month. Therefore, those workers will be above the old cap by working the average number of days just with regular earnings, and hence there will be a discontinuity in marginal tax rates for additional days, overtime, or multiple jobs. Figure IV, Panel B displays the average number of monthly hours of work among the group that we just defined by month of entry in IKA. The number of hours of work displays a small downward trend by date of entry. Note that the scale is very compressed as many workers work a standard 200 hours (25 days times 8 hours) per month. Most important, there is no visible discontinuity at the cut-offentry date, suggesting that high earners donot respond tothe higher rates by cutting their number of hours of work. Table IV, Panel B provides regression estimates of labor supply effects along the intensive margin. The estimates show that there is no discontinuity in hours of work, days in regular job, overtime, or multiple jobs likelihood at the cut-off date: except for overtime in two specifications, all estimates are insignificant. Even for overtime (which has a wrong positive sign relative to our theory prediction), the significant estimates are not robust across specifications. Our results show that the labor supply of upper income earners (about the top decile) affected by the reform is not responsive to the payroll tax differential, even in the long run as the discontinuity has been in place since 1993 and we observe earnings in 2009, 16 years later. We come back to the labor supply analysis and estimate labor supply elasticities so as to bound efficiency costs of payroll taxes after we complete the tax incidence analysis. Importantly, the absence of labor supply responses along both the extensive and intensive margins simplifies the incidence analysis and we can focus directly on earnings instead of wage rates (the workforce composition and hours of work are not affected by the tax differential).
EARNINGS DETERMINATION AND TAXES
521
21. We present results at the annual level (instead of monthly) on Figure V so that we can display several graphs on the same chart. Monthly graphs with quadratic fit show essentially the same results.
Downloaded from http://qje.oxfordjournals.org/ at Pennsylvania State University on June 26, 2012
the standard model is that new regime workers should bear the full incidence of the payroll tax differential. The simplest way to test the standard model is therefore to assess whether there is a discontinuity in the distribution of gross earnings, posted earnings, or net earnings around the entry cutoffdate. Under standard incidence, we should see nodiscontinuity for gross earnings but a discontinuity for posted and net earnings above the old cap. We have c = (1 − tE )w and z = (1 + tR )w where tE and tR are the average employee and employer payroll tax rates defined, respectively, as the ratios of employer and employee payroll taxes to posted earnings w. The reform affects the average payroll tax rates tE and tR for workers above the old cap. Figure V, Panel A depicts log (1 + tR ) and log (1 − tE ) (along with the normalized x-axis line in solid line) for workers above the old cap (in March 2009) by year of entry.21 As expected from our first-stage results, there is a clear upward jump for log (1 + tR ) and a clear downward jump for log (1 − tE ) from 1992 to 1993. Panel A in Table V confirms that there is a significant discontinuity in those variables at the cut-off date that is robust across all RDD specifications. Figure V, Panel B depicts the average log-gross earnings, log-posted earnings, and log-net earnings for workers above the old cap in March 2009 (posted earnings above e 2,432) by year of entry. Under standard incidence, log-gross earnings should be flat, while log-posted earnings, and log-net earnings should jump down. However, the graph shows compellingly that gross earnings jump up at the cut-off date, posted earnings are flat, and net earnings jump down. There is a striking similarity between Panel A and Panel B showing that the incidence of the employer payroll tax differential is on gross earnings and hence borne by employers, while the incidence of employee payroll tax differential is on net earnings and hence borne by employees. Panel B in Table V confirms those findings. There is a clear and significant upward discontinuity in log gross earnings, no discontinuity in posted earnings, and a downward discontinuity in net earnings. Those results are very robust across all five RDD specifications. The size of the discontinuities in gross and net earnings mirror the discontinuities in log (1 + tR ) and log (1 − tE ) from Panel A. As
522
QUARTERLY JOURNAL OF ECONOMICS
Panel A displays, by year of entry in IKA, the average log(1 + tR ) and log (1 – tE ) for workers with posted earnings above the old cap in March 2009. tR is the average employer payroll tax rate (employer taxes/posted earnings) and tE is the average employee payroll tax rate (employee taxes/posted earnings). The zero line is displayed for illustration. As expected, log(1 + tR ) jumps up and log(1 - tE ) jumps down at the reform cut-off entry date. Panel B displays, by year of entry in IKA, the average log gross earnings, log posted earnings, and log net earnings for all workers above the old cap in March 2009. Panel B shows that gross earnings jump up at the cut-off date, posted earnings are flat, and net earnings jump down. The striking similarity between Panel A and Panel B shows that employers bear the incidence of employer taxes while employees bear the incidence of employee taxes.
Downloaded from http://qje.oxfordjournals.org/ at Pennsylvania State University on June 26, 2012
FIGURE V Tax Incidence Effects: Average Tax Rates and Earnings above Old Cap
50,084
18,846
Number of observations
50,084
0.021 (0.011) −0.021 (0.012) −0.055 (0.013)
0.043 (0.002) −0.034 (0.001)
(4)
1988–1997 entrants
Downloaded from http://qje.oxfordjournals.org/ at Pennsylvania State University on June 26, 2012
50,084
0.029 (0.007) −0.015 (0.008) −0.050 (0.009)
0.033 (0.012) −0.009 (0.013) −0.043 (0.014)
(3)
Panel B. Gross, posted, and net earnings (above old cap) Log gross earnings z 0.031 (0.007) Log posted earnings w −0.013 (0.008) Log net earnings c −0.047 (0.009)
(2)
(1)
1988–1997 entrants
0.044 (0.001) −0.034 (0.001)
1991–1994 entrants only
1988–1997 entrants
Panel A. Employer and employee payroll tax rates (above old cap) Average employer log 0.044 0.042 tax rate: log(1+tR ) (0.001) (0.002) Average employee log −0.034 −0.034 tax rate log(1-tE ) (0.001) (0.002)
OUTCOMES
SAMPLE
TABLE V TAX INCIDENCE EFFECTS
50,084
0.040 (0.016) 0.001 (0.017) −0.031 (0.018)
0.039 (0.003) −0.031 (0.002)
(5)
1988–1997 entrants
EARNINGS DETERMINATION AND TAXES
523
Number of observations Yes
420,134 Yes
160,857 Yes Yes
420,134
420,134
420,134
Yes Yes Yes Yes
0.319 (0.260) −0.237 (0.273) −0.686 (0.280)
0.292 (0.190) −0.241 (0.199) −0.668 (0.204)
Yes Yes Yes
(5)
1988–1997 entrants
(4)
1988–1997 entrants
Downloaded from http://qje.oxfordjournals.org/ at Pennsylvania State University on June 26, 2012
Notes. The table displays the coefficients (with robust standard errors in parentheses) from regressing various earnings outcomes (listed in the left-hand column) on a dummy for entering IKA on or after 1/1/1993 (which corresponds to new regime with higher earnings cap). Robust standard errors are presented. Column (1) estimates includes a linear entry date (normalized to 0 at 1/1/1993) and a linear entry date interacted with the dummy for entering IKA after 1/1/1993. Column (2) uses the same controls as column (1) but limits the sample to those entering IKA from 1991 to 1994. Columns (3)–(5) use all 1988–1997 entrants but add successively monthly dummies (col. 3), quadratic date trends (quadratic term and quadratic term interacted with the dummy for entering IKA after 1/1/1993), cubic date trends (cubic term and cubic term interacted with the dummy for entering IKA after 1/1/1993).In Panels A and B, the sample includes all entrants with monthly posted earnings above the old cap (2,432 euros) in March 2009. The employer (employee) average payroll tax rate tR (tE ) is defined as the ratio of employer (employee) payroll taxes to posted earnings (in March 2009). In Panel C, the sample includes all entrants with positive earnings in March 2009. The regressions use a dummy variable for having gross earnings, posted earnings, net earnings above (1+tR )*3500, 3500, (1-tE )*3500 euros where tR (tE ) is the marginal employer (employee) payroll tax rate.
Included controls Linear entry date trends Monthly dummies Quadratic date trends Cubic entry date trends
0.641 (0.130) 0.103 (0.136) −0.322 (0.139)
(3)
(2)
(1) 0.291 (0.201) −0.264 (0.210) −0.733 (0.216)
1988–1997 entrants
1991–1994 entrants only
1988–1997 entrants
Panel C. Fraction with posted earnings above 3500 euros Percent with gross earnings above 0.656 (1+tR )*3500 euros (0.127) Percent with posted earnings above 0.121 3500 euros (0.133) Percent with net earnings above −0.317 (1-tE )*3500 euros (0.136)
SAMPLE
TABLE V (CONTINUED)
524 QUARTERLY JOURNAL OF ECONOMICS
EARNINGS DETERMINATION AND TAXES
525
The graph displays, by year of entry in IKA, the fraction of workers in March 2009 with monthly gross earnings, posted earnings, and net earnings above 3500*(1 + τR ), 3500, and 3500*(1 - τE ) euros. The graph shows that gross earnings jump up (relative to trend) at the cut-off date, posted earnings are continuous, and net earnings jump down, confirming the results from Figure V.
a caveat, note that the standard errors around our estimates are often large. Instead of considering average log-earnings statistics, we can alsoconsider an alternative statistic, namely, the fraction of workers with gross earnings, posted earnings, or net earnings above given fixed thresholds z∗ , w∗ , c∗ . Under standard tax incidence, when this threshold is above the old cap, this fraction should be stable for gross earnings z, and go down for w and c. Figure VI displays, by year of entry in IKA, the fraction of workers with gross earnings, posted earnings, and net earnings above z∗ =3500∙ (1 + τR ), w∗ = 3500, and c∗ = 3500 ∙ (1 − τE ) as of March 2009. The cut-off e 3,500 is chosen to fall in between the old and new caps. Unsurprisingly, the fraction of high earners is declining with date of entry as older entrants have more experience and hence higher earnings as we documented in Table II. The striking finding, however, is that this declining pattern does not happen for gross earnings around the cut-off date: the fraction with high gross earnings actually increases from 1992 to 1993. For posted
Downloaded from http://qje.oxfordjournals.org/ at Pennsylvania State University on June 26, 2012
FIGURE VI Tax Incidence Effect: Fraction with High Earnings
526
QUARTERLY JOURNAL OF ECONOMICS
22. Note however that the results are not as strongly consistent as in the case of log-earnings, as some of the gross earnings regressions are not significant, although the jump in the graph is striking. 23. Incidence seems somewhat closer to standard in the case of older workers (those entering IKA at age 23 or after), but our estimates are not precise enough to rule out identical incidence among all subgroups.
Downloaded from http://qje.oxfordjournals.org/ at Pennsylvania State University on June 26, 2012
earnings, the series are smoothly declining with no visible discontinuity. For net earnings, the decline is actually more pronounced from 1992 to 1993 than in any other year. Those findings are fully consistent with our previous findings showing that gross earnings (resp. posted earnings, net earnings) are actually higher (resp. the same, lower) for new entrants than for old entrants around the cut-off. They are also confirmed by regression analysis in Table V, Panel C which shows that the fraction of workers with gross earnings above z∗ jumps up at the cut-off date, while the fraction of workers with posted earnings above w∗ is stable, and the fraction of workers with net earnings above c∗ jumps down.22 The evidence displayed on Figures V and VI and Table V offers striking evidence of nonstandard tax incidence. In sharp contrast to the standard model we developed that predicts that new regime entrants should bear the full (employee plus employer) payroll tax differential, we find that employers compensate new regime entrants for the extra employer payroll taxes so that gross earnings are higher for new entrants and posted earnings are actually the same for newand old entrants. In contrast, employees seem to bear the full burden of the extra employee payroll taxes so that net earnings are lower for new entrants. All standard theoretical models predict that the division between employer and employee payroll taxes should not matter for the ultimate incidence of the payroll taxes between employees and employers. The unusual cohort-based Greek reform offers clear evidence contradicting this clear-cut prediction of the standard model. We provide in the Online Appendix placebo tests showing that there is no discontinuity at the cut-off entry date in the distribution of (gross, posted, and net) earnings below the old cap. We also present a heterogeneity analysis where we cut the sample by various characteristics such as age (at entry), gender, and firm size. We find consistent evidence of nonstandard incidence within all groups.23 In principle, our results could also be consistent with a situation where the employer and employee sharing of payroll
EARNINGS DETERMINATION AND TAXES
527
IV. INTERPRETATION AND POLICY IMPLICATIONS IV.A. Interpretation In models with frictions such as search models, employees and employers share a surplus so that there is typically an interval of wages that are acceptable to both the employee and the employer. Hence, wages are not systematically equal to marginal product as in the standard model and are in part determined by other factors such as bargaining power, wage setting norms, or pay fairness norms. If such norms are based on posted earnings, this will create an asymmetry between employer and employee payroll taxes. First, employers may not be able to pay similar workers differently for the same job because of pay fairness norms. Conceivably, offering different posted earnings for workers with different regime status but performing the same job might be perceived as discriminatory and could adversely impact morale and productivity inside the firm. In that situation, employers would have to pay new and old regime workers doing the same job the same posted earnings. There is substantial evidence for such fairness norms in the empirical literature. In case of the minimum wage for example, employers are unwilling to use youth subminimum wages (see Katz and Krueger 1991, 1992 for empirical evidence on youth subminimum wages) and Falk, Fehr, and Zehnder (2006) show with laboratory experiments that minimum wages can create entitlement effects and shape the perception of what is a fair wage. There is also substantial evidence of downward wage rigidity that has been explained by such morale effects and fairness perceptions (see e.g., Blinder and Choi 1990; Campbell and Kamlani 1997; or Bewley 1999).
Downloaded from http://qje.oxfordjournals.org/ at Pennsylvania State University on June 26, 2012
taxes is irrelevant for incidence but it happens coincidentally that employers bear the same fraction of taxes as the fraction of employer taxes in total payroll taxes. We cannot test this hypothesis because we do not have significant variation in the relative employer vs. employee tax rates. However, this alternative hypothesis does not seem very plausible to us because this result holds relatively widely, both among men and women, small and large firms, or across industrial sectors. It would be very surprising to obtain a tax incidence exactly proportional to the nominal employer and employee tax shares in all sectors.
528
QUARTERLY JOURNAL OF ECONOMICS
24. A large literature has documented such seniority-based wage norms in many countries (see Skirbekk 2004 for a recent survey) and has been confirmed by a small survey of Greek employers we carried out (see later discussion).
Downloaded from http://qje.oxfordjournals.org/ at Pennsylvania State University on June 26, 2012
Second, it is also conceivable that bargaining is based on posted earnings as this is the reference wage in negotiations. This could happen for example if it is costly for employers to observe and incorporate regime status in hiring negotiations, or if union bargaining and anti-discrimination rules are based on posted earnings. In that case, new and old regime workers with similar characteristics will also receive the same posted earnings. Third, there is strong evidence for seniority-based wage norms in Greece sothat younger workers are underpaidrelative to their productivity and older workers are overpaid relative to their productivity.24 In that case, employers get surplus from hiring young workers andhence may be willing topay the extra employer tax cost for hiring young workers in the new regime. As discussedin detail in the Online Appendix, we have carried out a small survey with five managers and one union member involved in personnel decisions at firms of medium to large size in Greece. The survey confirmed our empirical findings that employers do not take into account the new vs. old regime status when making hiring and wage setting decisions. According to the survey, unions and antidiscrimination rules do not play a role in this. One manager mentioned the role of fairness and morale. Threemanagers mentionedthat seniority-basedwagenorms make young workers attractive to firms, in spite of the new regime tax differential. Note that all three potential explanations, fairness norms, bargaining norms, or seniority-based norms can explain our tax incidence results in a partial equilibrium model if such norms are based on posted earnings. However, such nonstandard incidence could not be sustained in general equilibrium as employers would try to avoid recruiting new regime workers in the first place, or would try to lay them off in priority. This would generate a discontinuity in earnings around the cut-off date in the long-run equilibrium. Interestingly, even 15 years after the reform has been in place, we do not observe such a discontinuity suggesting that general equilibrium forces are not sufficient to alter the nonstandard incidence results.
EARNINGS DETERMINATION AND TAXES
529
IV.B. Policy Implications
Downloaded from http://qje.oxfordjournals.org/ at Pennsylvania State University on June 26, 2012
Efficiency Costs of Payroll Taxes. Using our key incidence result that workers bear only the employee portion of the payroll tax at the discontinuity, the labor supply response to the tax reform is due solely to the employee portion of the payroll tax. This allows us toestimate and bound the labor supply elasticities with respect to the net-of-tax rate. Panel C of Table IV reports estimates the elasticity of hours of work with respect to the netof-employee payroll tax rate. Those estimates are obtained by regressing log-hours on log (1 − τE ) where τE is the marginal employee payroll tax rate, instrumenting log (1 − τE ) with a dummy for entering IKA in 1993 or after, andusing additional controls as in the other RDD estimates. The key identification assumption is that absent the reform, workers on each side of the cut-off date would supply the same number of hours of work. Unsurprisingly, as we did not find any discontinuity in hours of work (Table IV, Panel B), all our elasticity estimates are insignificant and fairly precisely estimated, and actually slightly negative, implying that hours of work do not respond to marginal tax rates. Perhaps even more important, if we accept our incidence results that employees bear only the burden of the employee payroll taxes, our results show that there is no discontinuity in posted earnings at the cut-off date. This implies that the elasticity of reported posted earnings with respect to the net-of-tax rate 1 − τE is also 0. We present such estimates in Panel C of Table IV by regressing log-posted earnings on log (1 − τE ) using a dummy for entering IKA in 1993 or after as instrument. Those posted earnings elasticities are close to 0 and fairly precisely estimated. Importantly, such an elasticity includes not only hours of work responses but also all tax avoidance (such as having new regime workers paid with deferred compensation or perks on the job instead of cash) or tax evasion (e.g., supplemental unreported cash wages). In particular, although tax evasion is a general concern in Greece (see e.g., Matsaganis and Flevotomou 2010) our results suggest that highly skilledworkers in the IKA system have few opportunities to evade taxes, perhaps because they have to work in formal firms that comply with the tax system. This is consistent with the tax evasion literature that shows that even in countries where tax evasion rates are high, there is still a formal sector (composed of the largest firms) where tax
530
QUARTERLY JOURNAL OF ECONOMICS
Lessons for Tax Policy. In contrast to the standard model, we find that nominal tax incidence (employer vs. employee portions of the tax) is relevant for the long-run economic incidence. Such findings are consistent with the experimental studies on re-employment bonuses. Woodbury and Spiegelman (1987) show that such bonuses are more effective when they are nominally given to the employee rather than given to the employer although they are economically equivalent in a standard model (see alsothe survey by Meyer 1995). Therefore, our results imply that employer vs. employee payroll tax cuts are likely tobe sticky at least in the medium term. Under such nonstandard stickiness, reducing employer payroll taxes would increase profits while not affecting net wages, a desirable outcome when businesses face liquidity constraints to grow but 25. It is still possible that increasing IKA payroll tax rates across the board would induce low-paid formal workers to shift to the informal sector which is large in Greece.
Downloaded from http://qje.oxfordjournals.org/ at Pennsylvania State University on June 26, 2012
enforcement is high.25 In the taxable income elasticity literature, large elasticities for upper incomes are in general due to tax avoidance opportunities (Saez, Slemrod, and Giertz 2011). If upper earners in the IKA sector in Greece have few avoidance opportunities, our results are fairly consistent with the taxable income elasticities evidence. Taken together, those results suggest that the high payroll tax rates in Greece (as in most European countries) may not have large efficiency costs on high-income earners. Two important caveats should be noted. First, those results are predicated on assuming that our nonstandard incidence results are valid. If employees were bearing more than the employee portion (as in the standard incidence model), then the elasticity would be negative (in contrast with the theoretical prediction of the standard labor supply model laid out on Figure I). If employees were bearing less than the employee portion (pushing us further away from the standard incidence model), then the elasticity would be positive. Overall, absence of supply responses combined with nominal nonstandard incidence strikes us as a much simpler explanation for the empirical facts. Second, even though we do not find evidence of extensive margin responses, the bound on extensive elasticities (not reported) would be large as the standard errors reported in Panel A of Table IV are fairly large and could not rule out substantial extensive elasticities.
EARNINGS DETERMINATION AND TAXES
531
UNIVERSITY OF CALIFORNIA BERKELEY AND NATIONAL BUREAU OF ECONOMIC RESEARCH ATHENS UNIVERSITY OF ECONOMICS AND BUSINESS ATHENS UNIVERSITY OF ECONOMICS AND BUSINESS SUPPLEMENTARY MATERIAL An Online Appendix for this article can be found at QJE online (qje.oxfordjournals.org). REFERENCES Anderson, Patricia, and Bruce D. Meyer, “The Effects of Firm Specific Taxes and Government Mandates with an Application to the US Unemployment Insurance Program,” Journal of Public Economics, 65 (1997), 119–145. ———, “The Effects of the Unemployment Insurance Payroll Tax on Wages, Employment, Claims and Denials,” Journal of Public Economics, 78 (2000), 81–106.
Downloaded from http://qje.oxfordjournals.org/ at Pennsylvania State University on June 26, 2012
an undesirable outcome when businesses are hoarding cash and reluctant to invest. In contrast, reducing employee payroll taxes (as was done in the recent U.S. stimulus packages) would increase net wages without increasing profits, a desirable outcome to make work more attractive or to stimulate aggregate consumption. If the policy goal is to improve take-home earnings of some specific groups of workers such as low-paid workers or other disadvantaged workers, then the employee tax cut option is likely to be much more effective than the employer tax cut option, at least in the short run and quite possibly the medium run as well. More generally, our study shows that the institutional context—employee vs. employer taxes—plays a key role in the incidence of taxation even though it should be irrelevant in standard models. Our study therefore complements a growing literature showing that the institutional and informational contexts play a crucial role in behavioral responses to taxes. For example, Chetty, Looney, andKroft (2009) andFinkelstein (2009) showthat tax salience is critical for incidence and behavioral responses to taxation. Chetty and Saez (2009) show that information about the tax system alsohas on impact on behavioral responses totaxation. Overall, those new studies show that the analysis of taxation is conceivably much more complex than previously thought, as many additional factors are in general omittedfor being irrelevant in standard models, can actually have a substantial impact on behavioral responses, and hence on tax policy design.
532
QUARTERLY JOURNAL OF ECONOMICS
Downloaded from http://qje.oxfordjournals.org/ at Pennsylvania State University on June 26, 2012
Bewley, Truman, Why Wages Don’t Fall during a Recession (Cambridge, MA: Harvard University Press, 1999). Bingley, Paul, and Gauthier Lanot, “The Incidence of Income Tax on Wages and Labour Supply,” Journal of Public Economics, 83 (2002), 173–194. Blinder, Alan, andDon Choi, “A Shredof Evidence on Theories of Wage Stickiness,” Quarterly Journal of Economics, 105 (1990), 1003–1015. Blundell, Richard, and Thomas MaCurdy, “Labor Supply: A Review of Alternative Approaches,” in Handbook of Labor Economics, vol. 3A, Orley Ashenfelter and David Card, eds. (Amsterdam: Elsevier/North-Holland, 1999). Campbell, Carl, and Kunal Kamlani, “The Reasons for Wage Rigidity: Evidence from a Survey of Firms,” Quarterly Journal of Economics, 112 (1997), 759–789. Chetty, Raj, Adam Looney, and Kory Kroft, “Salience and Taxation: Theory and Evidence,” American Economic Review, 99 (2009), 1145–1177. Chetty, Raj, and Emmanuel Saez, “Teaching the Tax Code: Earnings Responses to an Experiment with EITC Recipients,” NBER Working Paper no. 14836, 2009. Falk Armin, Ernst Fehr, and Christian Zehnder, “Fairness Perceptions and Reservation Wages—The Behavioral Effects of Minimum Wage Laws,” Quarterly Journal of Economics, 121 (2006), 1347–1381. Finkelstein, Amy, “EZ-Tax: Tax Salience and Tax Rates,” Quarterly Journal of Economics, 124 (2009), 969–1010. Fullerton, Don, and Gilbert Metcalf, “Tax Incidence,” in Handbook of Public Economics, vol. 4, Alan Auerbach and Martin Feldstein, eds. (Amsterdam: Elsevier/North-Holland, 2002). Gruber, Jonathan, “The Incidence of Payroll Taxation: Evidence from Chile,” Journal of Labor Economics, 15 (1997), S72–S101. Hamermesh, Daniel S., “New Estimates of the Incidence of the Payroll Tax,” Southern Economic Journal, 45 (1979), 1208–1219. ———, Labor Demand (Princeton, NJ: Princeton University Press, 1993). Heckman, James, “What Has Been Learned about Labor Supply in the Past Twenty Years?” American Economic Review, 83 (1993), 116–121. Holmlund, Bertil, “Payroll Taxes and Wage Inflation: The Swedish Experience,” Scandinavian Journal of Economics, 85 (1983), 115. Katz, Lawrence, and Alan Krueger, “The Effect of the New Minimum Wage Law in a Low-wage Labor Market,” Industrial Relations Research Association Proceedings, 43 (1991), 254–65. ———, “The Effect of the Minimum Wage on the Fast-Food Industry,” Industrial and Labor Relations Review, 46 (1992), 6–21. Kubik, Jeffrey, “The Incidence of Personal Income Taxation: Evidence from the Tax Reform Act of 1986,” Journal of Public Economics, 88 (2004), 1567–1588. Lang, Kevin, “The Incidence of the Payroll Tax: A Test of Competing Models of Wage Determination,” Working paper, Boston University, 2003. Leigh, Andrew, “Who Benefits from the Earned Income Tax Credit? Incidence among Recipients, Coworkers and Firms,” B.E. Journal of Economic Analysis and Policy (Advances), 10 (2010), article 45. Liebman, Jeffrey, and Emmanuel Saez, “Earnings Responses to Increases in Payroll Taxes,” Working paper, UC Berkeley, 2006. Matsaganis, Manos, and Maria Flevotomou, “Distributional Implications of Tax Evasion in Greece,” Hellenic Observatory Papers on Greece and Southeast Europe, Greece, LSE Paper no. 31, Hellenic Observatory, London, 2010. Meyer, Bruce D., “Lessons from the U.S. Unemployment Insurance Experiments,” Journal of Economic Literature, 33 (1995), 91–131. Mulligan, Casey B., Ricard Gil, and Xavier Sala-i-Martin, “Social Security and Democracy,” B.E. Journal of Economic Analysis and Policy, 10 (2010). Neubig, Thomas, “The Social Security Payroll Tax Effect on Wage Growth,” Proceedings of the National Tax Association (1981), 196–201. OECD, Employment Outlook, 1990 (Paris: Organisation for EconomicCo-operation and Development, 1990). ———, Revenue Statistics 1965–2007 (Paris: Organisation for Economic Cooperation and Development, 2008).
EARNINGS DETERMINATION AND TAXES
533
Downloaded from http://qje.oxfordjournals.org/ at Pennsylvania State University on June 26, 2012
Poterba, James M., Julio J. Rotemberg, and Lawrence H. Summers, “A Tax-Based Test for Nominal Rigidities,” American Economic Review, 76 (1986), 659–675. Rothstein, Jesse, “Is the EITC as Good as an NIT? Conditional Cash Transfers and Tax Incidence,” American Economic Journal: Economic Policy, 2 (2010), 177–208. Saez, Emmanuel, Joel Slemrod, and Seth Giertz, “The Elasticity of Taxable Income with Respect to Marginal Tax Rates: A Critical Review,” Journal of Economic Literature, forthcoming (2011). Skirbekk, Vegard, “Age and Individual Productivity: A Literature Survey,” in Vienna Yearbook of Population Research, (Verlag der Osterreichischen Akademie der Wissenschaften, 2004). Woodbury, Stephen A., and Robert G. Spiegelman, “Bonuses to Workers and Employers to Reduce Unemployment: Randomized Trials in Illinois,” American Economic Review, 77 (1987), 513–530.