International Seminar sustainable utilization of coastal resources in tropical zone, 19-20 October,2016, Bengkulu, Indonesia
Effectiveness of Bengkulu Coastal Sand as Media for Pipe Slow Sand Filter S. Mujiharjo, Syafnil, B. Sidebang, Sunita and D.E. Sitepu Dept. of Agricultural Technology, Fac. of Agriculture, Univ. of Bengkulu, Indonesia E-mail:
[email protected]
ABSTRACT
Three sets of three Slow Sand Filter (SSF)-Pipes, each 4 inch in diameter and 50 cm in length with the media of the filter was Bengkulu coastal sand were operated to filter contaminated shallow well water and also swamp water to testify its effectiveness to remove water contaminnts and to improve water quality of the two sources of water. The tests were run under a steady state flow wih 20 cm pressure head, randomized completely block of two separate reseaches of seven days continues run. The data of the reseach showed that SSF-Pipes was able to neutralize (increase pH) of sallow well water from 4,0 to 6,98 (74,5%), reduce turbidity from 17 NTU to 2 NTU (86%), remove Mn from 1,04 mg/l to 0,024 mg/l (97,8%), reduce color from 156 TCU to 12 TCU (92,3%) so that qualify as drinking water. The SSF Pipe was also capable of increasing pH swamp water from 5,8 to 6,1 (5,2%), reducing TSS from 210 to 110 (47,8%), reducing Fe from 1,78 mg/l to 0,58 mg/l (67,7%), decreasing Mn from 0,63 mg/l to 0,04 mg/l (03,5%), and reducing colour from 177 TCU to 87 TCU (50,8%). Therefore, SSF-Pipe was effective to remove water contaminants and performed better to filter well water than samp water. Key words: SSF-Pipe, coastal sand, water filter, swamp water
INTRODUCTION Slow sand filtration, a process of removing cantaminants from the conveying water by using very fine sand as the filter media, has been known as inexpensive, easy to be constructed, installed and operated technology that quite suitable as cleaning water technology for small water system, and developing country (Jin et al., 2014; Guchi, 2015). Slow sand filter standar is effective for removing physical contaminants (suspended solids, turbidity), chemical contaminants (Mn, Fe, Ar) and
almost all (more than 95 pecent)
biological (pathogen) contaminants of water (Aslan a n d Cakici, 2007; Datta and Chaudury, 1991; Eighmy et al., 1992) that could be as water treatment technology.
It could happened
as there is layer of good microorganism on the top of the filter media called schmutzdecke (Huisman and Wood, 1974) cathing water all contaminants that going through the layer and letting the clear water passing the filter media. One of the weakness of this technology is that it needs regularly cleaning operation of its top layer in order to avaoid clogging (Logsdon et al., 2002; Jin et al., 2014; El-Taweel and Ali, 2000) and work properly. Pipe slow sand filter (SSF-P) is built for the purpose to lessen that weakness and provide some other advantages. Pipe slow sand filter is a slow sand filter in the form of pipe that capable of projecting or orienting the inlet side to any angel or direction that capable of protecting the inlet from filtered contaminats pilling up on its surface so that clogging could be avoided. Tests of SSF-P has been done to filter liquid waste of rubber processing industry to
451
International Seminar sustainable utilization of coastal resources in tropical zone, 19-20 October,2016, Bengkulu, Indonesia
have proper duration of operation (Hendi, 2011); to have proper pressure head operation (Darmadi, 2011); and also to have proper size (diameter) of the filter (Alfatih, 2011).
Based
on those results of the tests, SSF-P has also been tested to filter contaminated water to get clear water suitable for household need. This paper presents performance of SSF-P with Bengkulu coastal sand as filter media to remove contaminants out of contaminated shallow well water; and also to filter contaminants out of swamp water in the effort to find water purification technology suitable for rural swampy area.
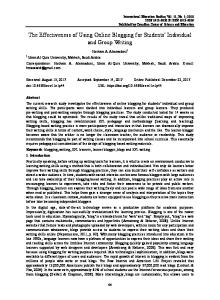
MATERIAL AND METHOD The SSF-P with Bengkulu coastal sand as filter media tested were the ones having four inches in diameter and 50 cm in length. Eighteen SSF-P having the same size were installed in six plastic containers. Installation was done by making hole on one of container side to have the outlet of SSF-P projected out of the containerin order to be able to measure debit of filtration. SSF-P inside of each container were spaced and anjusted so that its inlet side was directed to 0, 45 and 90 degree against horizontal line. It was done for the purpose to be able to describe effects of inlet orientation to filtration results. For the purpose to test the SSF-P performance in filtering cantaminated shallow well water; three container with SSF-P inside were used. Test was run by flowing continously the contaminated shallow well water into the containers so that the water level inside containers kept constantduring the test. And for the purpose to test the SSF-P performance in separating cantaminants from swamp water; another three containers with SSF-P inside were used. Test was run by flowing continously the swamp water into the containers so that the water level inside containers kept constant during the test. During the test, debit of filtration was measured daily by applying volumetric method. Samples of water before and after the SSF-P was taken at the end of the test. Each sample were analyzed for its colour (NTU), manganese (Mn) concentration (mg/l), Iron (Fe) concentration (mg/l), turbidity (NTU) and acidity (pH). RESULT DAN DISCUSSION Contaminated shallow well water filtration debit Plot of daily debitsduring eleven days test of SSF-P used to filter contaminanted shallow well water is served at Figure 1. As it can be seen that at the beginning of filtrationprocess, the debits were varied ranging from 22,4 to 53,6 ml/mnt, seemedthat it 452
International Seminar sustainable utilization of coastal resources in tropical zone, 19-20 October,2016, Bengkulu, Indonesia
depended on orientation of the inlet; and higher debits were foundwhenever inlet was positioned 45 degree againts the horizontal line. It was understanable that being positioned 45 degree, there would be less contaminants settled on the surface of the SSF-P inlet,compared to that of the 90 degree that could result in less disturbance for water to go in to the inlet. Compare to that of standar, the SSF contructed based on Huisman and Wood (1974) design, the debits of SSF-Pwith Bengkulu coastal sand as filter media were little bit higher. With the length of SSF-P was 50 cm and the width of sand media was 1 cm, the flow through SSF-P were 0.45 – 1.06 cm/mnt; that were little bit higher than the flowthrough SSF filter that was equivalent to 0.2-0.5 cm/mnt (Manz, 2004; Nakhla G, 2003). It is probably because there was longer path for filtered water to pass the media in the SSF; campare to that of the SFF-P.In the standard SSF, the filtered water should go through 0.6-1.2 m sand layer to reach the outlet (Huisman, 1974); while in the SSF-P, the filtered water needs only 0.5 m to pass sand media in circular-to-the-center-direction orientation. Figure 1 also showed that after eleven days of continues filtering process, the SPL-P debits decreased to 19.4 - 40.4 ml/mnt. According to Huisman and Wood (1974), during the early state of ripening, in this case during the early process of filtration, the overall resistance wouldbuild up slowly. Therefore, decline of flowrate during the early stage of filtration was normal happening.
Debit (ml/mnt)
60.00
SPLP-1
50.00
SPLP-2
40.00
SPLP-3
30.00
SPLP-4
20.00
SPLP-5
10.00
SPLP-6
0.00 1 2 3 4 5 6 7 8 9 10 11
SPLP-7
Days Filtering Process
SPLP-8
Figure 1. Debits of SPL-Ps during the first week of shaloow well water filtration Swamp water filtration debit Different with those of of the contaminated shallow well water, debits of SSF-P used to filter swamp water were, in averate, lower than that of the contaminanted shallow well water. At he beginning of filtration, the debits were ranging from 16.2 to 32.3 ml/mnt, about half of those of the shallow well water; and after seven days of continues filtration; the debits dropped to 12.3 – 21.8 ml/mnt. Plot of debits of SSF-P with Bengkulu coastal sand as filter media used
453
International Seminar sustainable utilization of coastal resources in tropical zone, 19-20 October,2016, Bengkulu, Indonesia
to filter swamp water is served at Figure 2. Most swamp water contain many dissolved compounds consist of ionic and non-ionic, acid element like sulfate, chloride and nitric exceed normal water condition. Those contaminants
Debit (ml/mnt)
35.00
SPLP-1
30.00
SPLP-2
25.00
SPLP-3
20.00
SPLP-4
15.00
SPLP-5
10.00
SPLP-6
5.00
SPLP-7
0.00
1 2 3 4 5 6 7 Days Filtering Process
SPLP-8 SPLP-9
Figure 2. Debits of SPL-P with Bengkulu coastal sand as filter media used to filter swamp water Contaminants removal from shallow well water Table 1 shows the results of measurements of colour, manganese (Mn), iron (Fe), turbidity and acidity (pH) of the existing shallow well water; and also capability of the SSF-P to rwmove them from the conveying water. As it could be seen at Table 1 that, in average, SSF-P was able to remove more than 90% of contaminants from the shallow well water; producing filtered water that physically and chemically qualify as drinking water standard.The shallow well water that was grey in colour was changed into colourless one.
It
is along with decrease of Mn concentration that almost all was cathed by the filter. Compare to that of the standard, capability of SSF-P to catch mangenese (Mn) abaout the same. The SSF-P was able to remove 97.8% the existing Mn (1.05 mg/l); and the standar SSF would be able to reduce Mn up to 100% as far as oxidation could take place (Manz, 2004). However, SSF-P have less capability to reduce the turbidity. The SSF-P could only filter 86.0% dirt producing filtered water with turbidity 1-4 NTU; while the SSF standar could have filtered water with turbidity less then 1 NTU (Manz, 2004); or even 0.1 – 0.5 NTU whenever nitrification-denitrification happened during the filtration process (Nakhla G, 2003).
454
International Seminar sustainable utilization of coastal resources in tropical zone, 19-20 October,2016, Bengkulu, Indonesia
Table 1. Performance SPL-P with Bengkulu coastal sand as filter media on removing contaminants from shallow well water Contaminants Existing Colour 156 (TCU) Mn (mg/l) 1.05 Fe (mg/l) 0.018 Turbidity 17 (NTU) 4 pH Sources: Sunita, 2012
After filtered Range
Averg
8 - 18
12
0.006-0.039 0.0235 -
Drinking Removal water (%) standard 15
92.3
0.4 0.3
97.8 -
1-4
2
5
86.0
6.5 - 7.1
6.98
6.5-8.5
-
Contaminants removal from swamp
water
Similar to its debits, contaminants removal performance of SSF-P with Bengkulu coastal sand as filter media used to filter swamp water was worse than that of shallow well water. Except for manganese; contaminants removed were less than 70%. Table 2 shows the results of measurements of colour, manganese (Mn), iron (Fe), turbidity and acidity (pH) of the existing swampwater and capability of the SSF-P to remove them from the conveying water. Most of swamp water contains many dissolved compounds consist of ionic and non-ionic, acid element like sulfate, chloride and nitric exceed normal water condition. Ability of SSF to remove such contaminants were limited (Manz, 2004). However, compared to those of the standar, ability of SSF-P in reducing colour was lower. The SSF standar is capable of lessening colour up to 70% (Manz, 2004); while the SSF-P was only 50.8%. It was probably caused by less contact with the filter media. Table 3. Performance SPL-P with Bengkulu coastal sand as filter media on removing contaminants from swamp water Parameter
Existing
Colour 177 (TCU) Mn (mg/l) 0.63 Fe (mg/l) 1.79 TSS (mg/l) 210 pH 5.8 Source: Sitepu, 2012
Drinking Removal water (%) Averg standard
After filtered Range 63-122
87
15
50.8
0.03-0.07 0.37-0.91 43-135 0.58-0.64
0.04 0.58 110 6.10
0.4 0.3 500 6.5-8.5
93.5 67.7 47.8 -
455
International Seminar sustainable utilization of coastal resources in tropical zone, 19-20 October,2016, Bengkulu, Indonesia
CONCLUSION Slow sand filter pipe (SSF-P) with Bengkulu coastal sand as the fiter media is effective to remove water contaminants to produce clear water.
Compare to the SSF standar, in
general the SSF-P performaned better whenever it was used to filter contaminated shallow well water; however, it showed worse results whenever it was apllied to filter swamp water.
REFERENCE Alfatih, M. 2011. Effects of Slow Sand Filter Pipe (SFF-P) Diameter on Debit and Quality of Filtered Water of Liquid Waste of Rubber Industry. Unpublihed Result of Guided Research for Final Work of a Bachelor Degree (Skripsi). Dept. of Agricultural Technology, Fac. of Agriculture, Univ. of Bengkulu. Aslan, S., and H . Cakici. 2007. Biological Denitrification of DrinkingWaterina Slow Sand Filter, J. of Hazardous Materials 148: 253 –258. Darmadi, D. 2011. Effects of Supernatant Height on Debit and Quality of Filtered Water of Liquid Waste ofRubber Industry. Unpublihed Result of Guided Research for Final Work of a Bachelor Degree (Skripsi). Dept. of Agricultural Technology, Fac. of Agriculture, Univ. of Bengkulu. Datta, A. K. and M. Chaudury. 1991. Microbial purification in slow sand filter. Environmental Toxicology. Vol. 6 (2): 239–247. Eighmy, T.T., M.R. Collins, K. Spanos, J. Fenstermachet. 1992. Microbial Populations and Activities and Carbon Metabolismin Slow Sand Filter, Environmental Research 26, pages : 1319 – 1328. El-Taweel, G.E. and Ali, G.H. 2000. Evaluation of Roughing and Slow Sand Filters for Water Treatment. Water, Air, and Soil Pollution 120: 21-28. Guchi, E. 2015. Review on Slow Sand Filtration in Removing Microbial Contamination and Particles from Drinking Water. American Journal of Food and Nutrition. 3(2): 47-55. Hendi, M. 2011. Effects of Duration operation on Debit and Quality of Filtered Water of Liquid Waste of Rubber Industry. Unpublihed Result of Guided Research for Final Work of a Bachelor Degree (Skripsi). Dept. of Agricultural Technology, Fac. of Agriculture, Univ. of Bengkulu. Huisman, L. and W. E. Wood. 1974. Slow Sand Filtration. WHO. Geneva. Jin, X. , T. Colling, and S. Ndiongue. 2014. Indicators of Filter Ripening for Slow Sand Filter. 16th Canadian National Conference on Drinking Water.http://www.cwwa.ca/pdf_files/16DWC_presentations/D3-Jin.pdf Logsdon, G.S. , R. Kohne, S. Abel, S. LaBonde . 2002. Slow sand filtration for small water systems. J. of Environmental Engineering and Science, 1(5): 339-348. Manz, D.H. 2004. New Horizon for Slow Sand Filtration. Prof. of the Eleventh Canadian National Conference of the Federal- Provincial- Territorial Committee on Drinking Water, Promoting Health through Safe Drinking Water, April 3-6, 2004. Calgary, Alberta, pp 682-692. Nakhla, G. 2003. Simultaneous nitrification-denitrification in slow sand filters. J. of Hazard Materials. 96 (2-3): 291-303. Sitepu, D. E. 2012. Effects of Inlet Position on some Physical Parameters of Outflow of Swamp Water Filtered using Pipe Slow Sand Filter (SPL-P). Unpublihed Result of Guided Research for Final Task of a Bachelor Degree (Skripsi). Dept. of
456
International Seminar sustainable utilization of coastal resources in tropical zone, 19-20 October,2016, Bengkulu, Indonesia
Agricultural Technology, Fac. of Agriculture, Univ. of Bengkulu. Sunita. 2012. Effects of Inlet Position on some Physical Parameters of Outflow of Contaminated Shallow Well Water Filtered using Pipe Slow Sand Filter (SPL-P). Unpublihed Result of Guided Research for Final Work of a Bachelor Degree (Skripsi). Dept. of Agricultural Technology, Fac. of Agriculture, Univ. of Bengkulu.
457