Electroencephalogram Signals from Imagined Activities: A Novel Biometric Identifier for a Small Population Ramaswamy Palaniappan Dept. of Computer Science, University of Essex, Colchester, United Kingdom
[email protected]
Abstract. Electroencephalogram (EEG) signals extracted during imagined activities have been studied for use in Brain Computer Interface (BCI) applications. The major hurdle in the EEG based BCI is that the EEG signals are unique to each individual. This complicates a universal BCI design. On the contrary, this disadvantage is the advantage when it comes to using EEG signals from imagined activities for biometric applications. Therefore, in this paper, EEG signals from imagined activities are proposed as a biometric to identify the individuality of persons. The approach is based on the classification of EEG signals recorded when a user performs either one or several mental activities (up to five). As different individuals have different thought processes, this idea would be appropriate for individual identification. To increase the inter-subject differences, EEG data from six electrodes are used instead of one. A total of 108 features (autoregressive coefficients, channel spectral powers, interhemispheric channel spectral power differences and inter-hemispheric channel linear complexity values) are computed from each EEG segment for each mental activity and classified by a linear discriminant classifier using a modified 10 fold cross validation procedure, which gave perfect classification when tested on 500 EEG patterns from five subjects. This initial study has shown the huge potential of the method over existing biometric identification systems as it is impossible to be faked. Keywords: Biometrics, Brain Computer Interface, Electroencephalogram, Imagined activities.
1
Introduction
Person identification, which is different from authentication, is the process in which a person’s identity is recognized. Nowadays, automatic identification through the use of computers has become an everyday issue. The biometric approach to this is commonly through fingerprint recognition [1, 2]. It is becoming more important to find alternative biometric methods to replace or augment the fingerprint technology. In this regard, there are other biometrics like voice [1], palmprint [3], hand geometry [4], iris [5], face [6], ear force fields [7], heart signals [8], odor [9], and brain signals [10-12] that have been proposed. However, using EEG during imagined activities has yet to be studied as a biometric as far as the knowledge of the author is concerned. There have been other types of EEG signals that have been studied for biometrics [10-12]. In [10], alpha E. Corchado et al. (Eds.): IDEAL 2006, LNCS 4224, pp. 604 – 611, 2006. © Springer-Verlag Berlin Heidelberg 2006
EEG Signals from Imagined Activities: A Novel Biometric Identifier
605
rhythm EEG signals were used to classify 4 subjects, while in another study [11], AR modeling of EEG obtained when the subjects had their eyes open or closed were used as a biometric. Visual evoked potentials recorded while subjects perceived a picture were used in [12] to identify the subjects. However, this method required 61 channels, which is cumbersome and also required the individuals to perceive a visual stimulus, which is drawback for the visually impaired. In previous study [13], it has been shown that classification of EEG signals during imagined activities is a suitable technique for use in the design of Brain Computer Interfaces (BCIs) to aid the disabled to communicate or control devices. BCIs are also useful for hands-off menu activation, which could be used by anyone. In this paper, the same approach but using different feature extraction and classification methodologies is proposed for a different application: to identify the individuality of the subjects.
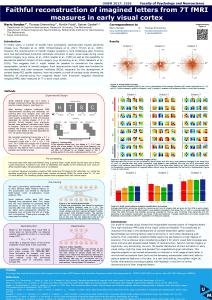
2 Data The EEG data used in this study were collected by Keirn and Aunon [14]. Data from five subjects were used in this study. The description of the data and recording procedures are as follows. The subjects were seated in noise controlled room. An electrode cap was used to record EEG signals from positions C3, C4, P3, P4, O1 and O2 defined by the 10-20 system of electrode placement. The impedances of all electrodes were kept below 5 KΩ and measurements were made with reference to electrically linked mastoids, A1 and A2. The electrodes were connected through a bank of amplifiers with analog band-pass filters set from 0.1 to 100 Hz. The data were sampled at 250 Hz with 12-bit precision. The system was calibrated before each recording. Signals were recorded for 10 seconds during each of the five imagined activities and each activity was repeated for 10 different day sessions.
C3 A1
C4 A2
EEG
P3
P4 O1
O2
Fig. 1. Electrode placement
These imagined activities were: Baseline activity. The subjects were asked to relax and think of nothing in particular. Math activity. The subjects were given nontrivial multiplication problems, such as 79 times 56 and were asked to solve them without vocalizing or making any other physical movements. The activities were non-repeating and designed so that an immediate answer was not apparent. The subjects verified at the end of the activities
606
R. Palaniappan
whether or not he/she arrived at the solution and no subject completed the activity before the end of the 10 s recording session. Geometric figure rotation activity. The subjects were given 30 s to study a particular three-dimensional block object, after which the drawing was removed and the subjects were asked to visualize the object being rotated about an axis. The EEG signals were recorded during the mental rotation period. Mental letter composing activity. The subjects were asked to mentally compose a letter to a friend without vocalizing. Since the activity was repeated for several times the subjects were told to continue with the letter from where they left off. Visual counting activity. The subjects were asked to imagine a blackboard and to visualize numbers being written on the board sequentially, with the previous number being erased before the next number was written. The subjects were instructed not to verbalize the numbers but to visualize them. They were also told to resume counting from the previous activity rather than starting over each time. Keirn and Aunon [11] specifically chose these activities since they involve hemispheric brainwave asymmetry (except for the baseline activity).
3 Feature Extraction In this study, each of the EEG signal was segmented into 20 segments with length 0.5 s, so each EEG segment was 125 data points (samples) in length. The EEG signals were referenced to the common reference (i.e. centered to zero mean across all the channels) and also were centered to zero mean in each of the channel. The preliminary results indicated that both these operations decreased the classification error and hence were adopted. Elliptic Finite Impulse Response (FIR) was used to high-pass filter the EEG signals above 0.5 Hz (to reduce baseline noise). The filter specifications were: 30 dB minimum attenuation in the stop-band with 0.5 dB ripple in the pass-band. Elliptic filter was used because of its low order as compared to other FIR filters like Butterworth. Forward and reverse filtering was performed to ensure that there would be no phase distortion. Autoregressive coefficients. The EEG signals were subjected to feature extraction using autoregressive (AR) modeling: p
x ( n ) = − ∑ a k x ( n − k ) + e ( n) ,
(1)
k =1
where p is the model order, x(n) is the signal at the sampled point n, ak are the real valued AR coefficients and e(n) represents the error term independent of past samples. In this paper, Burg’s method [15] was used to estimate the AR coefficients. In computing AR coefficients, order six was used because other researchers [13, 14, 16] have suggested the use of order six for AR process for mental activity classifications. Therefore, six AR coefficients were obtained for each channel, giving 36 features for each EEG segment for a mental activity. When two mental activities were used, the size of the features was 72 and so forth.
EEG Signals from Imagined Activities: A Novel Biometric Identifier
607
Channel spectral powers and inter-hemispheric channel spectral power differences. Next, Elliptic filters with similar specifications as used earlier were utilized to extract EEG in three spectral bands: alpha, beta and gamma. Delta and theta bands were ignored since there is seldom any EEG in these low frequencies during a mental activity. The frequency ranges of each bands were alpha (8-13 Hz), beta (14-20 Hz) and gamma (21-50 Hz). Channel spectral power in each band was computed using the variance of the filtered output. Next, inter-hemispheric channel spectral power differences in each spectral band was computed using ⎡ P − P2 ⎤ , Powerdifference = ⎢ 1 ⎥ ⎣ P1 + P2 ⎦
(2)
where P1 and P2 are the powers in different channels in the same spectral band but in the opposite hemispheres. Overall, this gave 18 channel spectral powers and 27 interhemispheric channel spectral power differences (nine spectral power differences for six channels in opposite hemispheres x three bands) for each mental activity. These numbers increase in multiplicative order for more mental activities. Inter-hemispheric Channel Linear Complexity. For C-channel signals, linear complexity is defined as [17]:
Ω = exp( −
C
∑ξ logξ ) , i
i
(3)
i =1
where the eigenvalues, λ are computed from the covariance of the C-channel EEG signal matrix and normalized using
ξ i = λi
C
∑λ
i
.
(4)
i =1
Roughly, the linear complexity, Ω measures the amount of spatial synchronization. Large values of Ω indicates low correlation between the signals in the channels and vice versa. Here, Ω is computed to measure the inter-hemispheric channel linear complexity for each spectral band where the two channels used were one each from the opposite hemispheres. There were nine inter-hemispheric channel linear complexity values times three bands, totaling 27 for each mental activity. These numbers increase in multiplicative order for more mental activities.
4 Feature Reduction and Classifier Principal Component Analysis (PCA). The standard PCA was used to reduce the feature size. In this work, the principal components that contributed to 99.99% of the total variance were retained. This variance value to be retained was obtained after some preliminary simulations. The reduced feature sizes were 78, 125, 150, 169 and 182, in increasing number of mental activity combinations. These features were normalized to the range [-1,1], using maximum and minimum values of each feature.
608
R. Palaniappan
Linear Discriminant Classifier. Linear Discriminant Classifier (LDC) [18] is a linear classification method that is computationally attractive as compared to other classifiers like artificial neural network. It could be used to classify two or more groups of data. Here, LDC was used to classify the EEG feature vectors into one of the five categories representing the subject. The EEG feature vector size would depend on the number of used mental activities (as mentioned earlier). A total of 1000 EEG feature vectors (20 segments for EEG each signal x 10 sessions x 5 subjects) were used in the experimental study. Half of the patterns were used in training and the remaining half in testing. The selection of the patterns for training and testing were chosen randomly. A modified 10 fold cross validation procedure was used to increase the reliability of the results. In this procedure, the entire data for an experiment (i.e. 1000 EEG feature vectors) were split into 10 parts, with equal number of feature vectors from each subject. Training and testing were repeated for five times where for each time, five different parts were used for training and the remaining five parts for testing. This was done to increase the reliability of the classification results.
5 Results and Discussion Table 1 shows the classification results (in terms of percentage error) using one mental activity, while Tables 2, 3, 4 and 5 shows the classification results using combinations of two, three, four and five mental activities, respectively. The results were obtained using the modified 10 fold cross validation procedure mentioned earlier. The maximum, minimum and average of the five repeated experiments using the modified 10 fold cross validation procedure are reported in the Tables. Table 1. Results with modified 10 fold cross-validation using one mental activity Classification error (%) Mental activity Min Max Average Baseline 2.00 2.80 2.32 Count 0.80 3.40 1.60 Letter 0.80 2.40 1.36 Maths 2.20 4.20 3.12 Rotation 1.40 3.40 2.16 Overall average 1.44 3.24 2.11 Minimum 0.80 2.40 1.36 Best mental activity (using average value): Letter
From Table 1, the best mental activity that discriminated the subjects was Letter activity, while from Table 2, it could be seen that the best combination of mental activity pair was Maths-Letter (using the values in the average column). There was a reduction in classification error by using the mental activity pairs instead of a single mental activity. Similarly, there were reductions in classification error with increasing mental activity combinations, which was as anticipated. When all five mental activities were used, there was no classification error. The increase in recognition accuracy that followed the higher number of mental activities resulted in additional complexity and computational time. However, the
EEG Signals from Imagined Activities: A Novel Biometric Identifier
609
increase in computational time is insignificant especially with the easy availability of fast computing power. The computational times required were approximately 40 μs, 77.5 μs, 155 μs, 235 μs and 390 μs for one, two, three, four and five mental activities, respectively. The increase in complexity is a cause for concern but the method is simple as the subjects have to think of the different mental activities only, which could be easily mastered with some training. With the use of active electrode caps, the placement of electrodes will not be cumbersome and a simple hat that fits most heads could be designed. If necessary, the EEG signals could be transmitted wirelessly to the computer for processing. Combined with the 0.5 s required for a single mental activity, operation of the system requires about 2.89 s for five mental activities, which is feasible to be implemented. Table 2. Results with modified 10 fold cross-validation using two mental activities Classification error (%) Mental activity combinations Min Max Average Baseline, Count 0 1.80 0.40 Baseline, Letter 0.20 0.60 0.40 Baseline, Maths 0.20 0.60 0.40 Baseline, Rotation 0 1.40 0.48 Letter, Count 0 1.40 0.40 Letter, Rotation 0.20 1.00 0.44 Maths, Count 0.20 2.20 0.68 Maths, Letter 0 0.40 0.24 Maths, Rotation 0.40 1.00 0.76 Rotation, Count 0 2.00 0.60 Overall average 0.5 0.99 0.46 Minimum 0 0.40 0.24 Best mental activity combination (using average value): Maths, Letter
Table 3. Results modified 10 fold cross-validation using three mental activities Classification error (%) Mental activity combinations Min Max Average Baseline, Letter, Count 0 1.40 0.28 Letter, Count, Maths 0 1.40 0.32 Maths, Baseline, Count 0 1.40 0.32 Maths, Baseline, Letter 0 0.40 0.12 Rotation, Baseline, Count 0 1.60 0.40 Rotation, Baseline, Letter 0 0.40 0.16 Rotation, Letter, Count 0 1.60 0.40 Rotation, Maths, Baseline 0 0.60 0.16 Rotation, Maths, Count 0 1.60 0.36 Rotation, Maths, Letter 0 0.20 0.12 Overall average 0 1.06 0.26 Minimum 0 0.20 0.12 Best mental activity combination (using average value): Maths, Baseline, Letter or Rotations, Maths, Letter
610
R. Palaniappan Table 4. Results with modified cross-validation using four mental activities Classification error (%) Mental activity combinations Min Max Average Maths, Letter, Count, Baseline 0 1.00 0.2 Rotation, Baseline, Letter, Count 0 0.60 0.12 Rotation, Maths, Count, Baseline 0 1.00 0.2 Rotation, Maths, Count, Letter 0 1.40 0.32 Rotation, Maths, Letter, Baseline 0 0 0 Overall average 0 0.80 0.17 Minimum 0 0 0 Best mental activity combination (using average value): Rotation, Maths, Letter, Baseline Table 5. Results with modified cross-validation using five mental activities
Mental activity combination Rotation, Maths, Count, Letter, Baseline
Classification error (%) Min Max Average 0 0 0
6 Conclusion In this paper, a novel method of identifying individuals using classification of feature vectors from six EEG signals recorded during mental activities has been proposed. The features consisted of sixth order AR coefficients, channel spectral powers, interhemispheric channel spectral power differences and inter-hemispheric channel linear complexity values. LDC was used to classify the EEG feature vectors, where a modified 10 fold cross validation procedure was used to improve the reliability of the results. The perfect classification over 500 test EEG feature vectors from five subjects show promise for the method to be studied further as a biometric tool for individual identification. The method could be used as a uni-modal (stand alone) or in part of a multi-modal individual identification system and is mainly advantageous because of the difficulty in establishing another persons exact EEG output. Nevertheless, further extensive research with more subjects would be necessary in order to determine the stability of the EEG features over time. Another future work could be on authentication of users using similar approach. Acknowledgment. The author would like to acknowledge the assistance of Dr. C. Anderson of Colorado State University, USA for giving permission to use the EEG data.
References 1. Wayman, J., Jain, A., Maltoni, D., Maio, D. (eds.): Biometric Systems: Technology, Design and Performance Evaluation. Springer-Verlag (2004) 2. Pankanti, S., Prabhakar, S., Jain, A.K.: On the individuality of fingerprints. IEEE Transactions on Pattern Analysis and Machine Intelligence, Vol. 24, No. 8 (2002) 1010-1025
EEG Signals from Imagined Activities: A Novel Biometric Identifier
611
3. Duta, N., Jain, A.K., Mardia, K.V.: Matching of palmprints. Pattern Recognition Letters, Vol 23, No. 4 (2002) 477-485 4. Jain, A.K., Ross, A., Pankanti, S.: A prototype hand geometry-based verification system. Proceedings of 2nd International Conference on Audio and Video-Based Biometric Person Identification, Vol. 1 (1999) 166-171 5. Daugman, J.: Recognizing persons by their iris patterns. In Jain, A.K., Bolle, R., Pankanti, S. (eds.): Biometrics: Personal Identification in Networked Society. Kluwer Academic (1999) 6. Samal, A., Iyengar, P.: Automatic recognition and analysis of human faces and facial expressions: a survey. Pattern Recognition, Vol. 25, No. 1 (1992) 65-77 7. Hurley, D. Nixon, M., Carter, J.: Force field feature extraction for ear biometrics. Computer Vision and Image Understanding, Vol. 98, No. 3 (2005) 491-512 8. Biel, L., Pettersson, O., Philipson, L., Wide, P.: ECG analysis: a new approach in human identification. IEEE Transactions on Instrumentation and Measurement, Vol. 50, No. 3 2001 808-812 9. Korotkaya, Z.: Biometric Person Authentication: Odor. Available: http://www.it.lut.fi/ kurssit/03-04/010970000/seminars/Korotkaya.pdf (2003) 10. Poulos, M., Rangoussi, M., Chrissikopoulos, V., Evangelou, A.: Person identification based on parametric processing of the EEG. Proceedings of the 6th IEEE International Conference on Electronics, Circuits, and Systems, Vol. 1, (1999) 283-286 11. Paranjape, R.B., Mahovsky, J., Benedicenti, L., Koles, Z.: The electroencephalogram as a biometric. Proceedings of Canadian Conference on Electrical and Computer Engineering, Vol.2 (2001) 1363-1366 12. Palaniappan, R.: A new method to identify individuals using VEP signals and neural network. IEE Proceedings - Science, Measurement and Technology Journal, Vol. 151, No. 1 (2004) 16-20 13. Palaniappan, R., Paramesran, R., Nishida, S., Saiwaki, N.: A new brain-computer interface design using fuzzy ARTMAP. IEEE Transactions on Neural System and Rehabilitation Engineering, Vol. 10 (2002) 140-148 14. Keirn, Z.A., Aunon, J.I.: A new mode of communication between man and his surroundings. IEEE Transactions on Biomedical Engineering, Vol. 37, No.12 (1990) 1209-1214 15. Shiavi, R.: Introduction to Applied Statistical Signal Analysis, 2nd edition. Academic Press (1999) 16. Anderson, C.W., Stolz, E. A., Shamsunder, S.: Multivariate autoregressive models for classification of spontaneous electroencephalogram during mental activities. IEEE Transactions on Biomedical Engineering, Vol. 45, No. 3 (1998) 277-286 17. Wackermann, J. : Towards a quantitative characterization of functional states of the brain: from the non-linear methodology to the global linear description. International Journal of Psychphysiology, Vol. 34 (1999) 65-80 18. Fukunaga, K.: Introduction to Statistical Pattern Recognition, 2nd edition. Academic Press (1990)