Results Review, 20 February 2014
Ezion Holdings (EZI SP)
Buy (Maintained)
Energy & Petrochemicals - Oil & Gas Services Market Cap: USD2,204m
Target Price: Price:
SGD3.00 SGD2.31 Macro Risks
Strong EPS Growth Momentum Intact
Growth Value
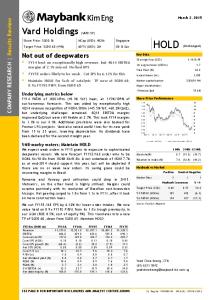
Ezion Holdings (EZI SP) Relative to Straits Times Index (RHS)
2.5
164
2.4
157
2.3
150
2.2
143
2.1
136
2.0
129
1.9
122
1.8
115
1.7
108
1.6
101
1.5 90 80 70 60 50 40 30 20 10
94
Dec-13
Oct-13
Aug-13
Jun-13
Apr-13
Source: Bloomberg
Avg Turnover (SGD/USD) Cons. Upside (%) Upside (%) 52-wk Price low/high (SGD) Free float (%) Shareholders (%) Chew Thiam Keng Templeton Havenport
10.4m/8.24m 26.0 29.9 1.61 - 2.43 70
16.1 6.9 4.8
Shariah compliant
Above expectations. Ezion Holdings (Ezion)’s 4Q13 core net profit soared 94% y-o-y to USD39.5m, 17% ahead of our forecast mainly due to higher contribution from its Australian projects and lower interest expenses, as borrowings for asset under construction were capitalised. FY13 core net profit leapt 116% y-o-y to USD142m, thanks to higher revenue (+78% y-o-y) from more deployment of liftboats and service rigs as well as rising contributions (+83% y-o-y) from associates and joint ventures (JV). Higher net gearing a non-issue. High capex lifted Ezion’s net gearing to 1.15x, but this is not a key concern as the debts are backed by longterm charter contracts worth more than USD1.8bn. An estimated 60% of the USD1bn net debt is on a floating rate and the remaining 40% is on a fixed rate. Capex spending for the Australian marine supply base project is now estimated at AUD34m, and could increase by another AUD5m6m in the next two quarters. Two more project delays. Ezion is encountering delays for a service rig project for a South-East Asia national oil company in the Caspian Sea and a project for an oil company in Indonesia. We cut our FY14-15F EPS estimates by 3-4% to reflect the changes. Maintain BUY; lower SGD3.00 TP. We lower our TP to SGD3.00 from SGD3.18 to reflect our FY14F EPS cut. Our TP is pegged to a 13x FY14F P/E. We remain positive on Ezion given its undemanding valuation at 10x FY14F P/E, high earnings visibility from its USD1.8bn charter backlog and positive demand outlook for service rigs. Key risks are: i) a slowdown in contract wins, and ii) delays in upgrade and conversion.
Forecasts and Valuations
Dec-11
Dec-12
Dec-13
Dec-14F
Dec-15F
107
159
282
554
667
Reported net profit (USDm)
58
79
160
217
297
Recurring net profit (USDm)
47
65
141
217
297
58.6
38.4
115.0
54.6
36.8
Total turnover (USDm)
Recurring net profit growth (%) Recurring EPS (USD) DPS (USD)
0.07
0.08
0.12
0.18
0.25
0.001
0.001
0.001
0.001
0.001
Jason Saw +65 6232 3871
Recurring P/E (x)
27.6
24.1
14.8
10.0
7.3
[email protected]
P/B (x)
5.85
4.39
3.09
2.26
1.72
P/CF (x)
38.0
18.3
14.5
6.3
5.3
0.1
0.1
0.1
0.1
0.1
EV/EBITDA (x)
20.2
24.3
16.2
8.4
6.5
Return on average equity (%)
24.3
21.8
27.7
26.2
26.8
Net debt to equity (%)
35.2
75.5
115.0
116.3
85.4
(3.9)
9.2
Lee Yue Jer +65 6232 3898
[email protected]
Dividend Yield (%)
Our vs consensus EPS (%) Source: Company data, OSK-DMG estimates
See important disclosures at the end of this report
2 . 2 0 . 3
0 0 . 2 0 0 Ezion continued to exhibit solid growth with 4Q13 core net profit . 0 surging 94% y-o-y to USD39.5m, 17% above our forecast. This was 0 driven by higher margin from its Australian operations given higher 0 portions of owned assets and lower interest expenses. While we cut our FY14 EPS by 4% due to two project delays, we still expect a healthy earnings growth of 55% for FY14. Maintain BUY, with a SGD3.00 TP.
Feb-13
Vol m
Price Close
Powered by EFATM Platform
1
Ezion Holdings (EZI SP) 20 February 2014
4QFY13 Results Review Figure 1: Ezion’s interim results 4Q12
4Q13
y-o-y
FY12
FY13
y-o-y
52.3
83.7
60
158.7
281.9
78
Offshore logistics projects
66.7
111.4
67
Ramp-up of Australian operations
Service rigs
92.0
170.5
85
More rigs deployed
70.7
133.2
88
Offshore logistics projects
20.5
37.9
85
Higher margin due to less charter in vessels
Service rigs
50.2
95.3
90
Stable margins
Revenue
Gross profit
Other income
21.5
40.8
90
2.0
2.0
2
17.1
28.5
67
Admin expenses
-4.4
-5.3
20
-12.5
-18.1
45
Other expenses
-1.8
-2.5
42
-4.8
-4.8
0
Reported operating profit
17.3
35.0
102
70.6
138.9
97
Adjusted EBITDA
24.0
50.3
109
73.8
165.5
124
Depreciation
-7.0
-16.4
134
-16.6
-45.4
174
Adjusted operating profit
17.1
33.9
99
57.3
120.1
110
0.4
2.0
374
3.1
5.4
76
-3.1
-3.6
16
-7.8
-12.2
Share of results
6.5
7.8
20
16.9
30.9
Exceptional items
0.2
1.0
340
13.3
18.7
41
Impairment
0.0
-1.0
NM
-0.1
-1.0
857
Interest income Interest expenses
57 Lower than expected as part of borrowings for assets under construction are capitalised 83
Gain on disposal
0.2
2.0
758
13.4
19.7
47
Profit before tax
21.1
41.2
95
82.8
163.0
97
Income tax
-0.6
-0.7
23
-3.9
-2.6
-33
0.0
0.0
NM
0.0
0.1
NM
Net profit attributable to equity holders
20.5
40.5
97
78.8
160.4
103
Core net profit
20.3
39.5
95
65.5
141.7
116
Gross debt
552.4
1,085.9
Gross cash
134.9
166.0
Net debt
417.5
919.9
Total equity
552.8
800.3
Net debt to total equity (x)
0.76
1.15
Perpetual securities
97.7
97.7
Sharehoilders' equity
455.2
702.7
0.92
1.31
5.7
5.6
Minority interest
Remarks
USD2m gain in 4Q13 from disposal of tug and barge Witholding tax from overseas operation
Balance sheet
Net debt to shareholders' equity (x) EBITDA to net debt Margins Group gross profit
44.6%
47.2%
Gross profit margin for offshore logistics
41.0%
48.7%
30.7%
34.0%
Gross profit margin for service rigs
54.6%
55.9%
Adjusted EBITDA
45.9%
60.1%
46.5%
58.7%
Adjusted operating profit
32.6%
40.5%
36.1%
42.6%
Improvement due to more owned assets
Source: Company data, OSK-DMG estimates
See important disclosures at the end of this report
2
Ezion Holdings (EZI SP) 20 February 2014
Financial Exhibits Profit & Loss (USDm)
Dec-11
Dec-12
Dec-13
Dec-14F
Total turnover
107
159
282
554
667
Cost of sales
(52)
(88)
(149)
(299)
(326) 341
Gross profit Gen & admin expenses Operating profit Operating EBITDA
Dec-15F
55
71
133
255
(14)
(14)
(14)
(18)
(22)
41
57
119
237
319
51
74
165
368
467
(10)
(17)
(45)
(132)
(149)
Operating EBIT
41
57
119
237
319
Net income from investments
10
17
31
37
38
Interest income
2
3
5
5
5
Interest expense
(3)
(8)
(12)
(45)
(45)
Exceptional income - net
11
13
20
Pre-tax profit
61
83
163
Depreciation of fixed assets
Taxation Minority interests Profit after tax & minorities
(3) -
(4)
-
-
234
317
(3)
-
0
(9)
(11)
-
-
225
305
58
79
160
Reported net profit
58
79
160
217
297
Recurring net profit
47
65
141
217
297
Preferred dividends
-
(8)
(8)
Source: Company data, OSK-DMG estimates
Cash flow (USDm)
Dec-11
Dec-12
Dec-13
Dec-14F
Dec-15F
Operating profit
41
57
119
237
319
Depreciation & amortisation
10
17
45
132
149
(20)
19
(5)
23
4
0
(2)
36
93
158
391
2
1
0
5
5
(3)
(7)
(13)
(45)
(45)
-
-
Change in working capital Other operating cash flow Operating cash flow Interest received Interest paid Dividends received
-
(3) 464
1
2
1
Tax paid
(1)
(2)
(2)
Cash flow from operations
34
86
144
343
413
(132)
(683)
(345)
Capex Other new investments Other investing cash flow Cash flow from investing activities Dividends paid Proceeds from issue of shares
(9)
(663)
(709)
51
(1)
(40)
-
8
10
15
-
(73)
(654)
(734)
(1)
(1)
-
(683)
(1)
(345)
(1)
(1)
0
108
Increase in debt
(5)
572
Other financing cash flow
34
(41)
Cash flow from financing activities
28
638
628
346
(51)
Cash at beginning of period
76
63
135
166
172
Total cash generated
87
(11)
-
-
676
315
(50)
(134)
33
(10)
70
38
Forex effects
(2)
2
(6)
Implied cash at end of period
63
135
167
6
-
17
-
-
172
188
Source: Company data, OSK-DMG estimates
See important disclosures at the end of this report
3
Ezion Holdings (EZI SP) 20 February 2014
Financial Exhibits Balance Sheet (USDm)
Dec-11
Dec-12
Dec-13
Dec-14F
Dec-15F
Total cash and equivalents
63
135
166
172
188
Accounts receivable
32
57
107
152
183
Other current assets
32
80
107
107
107
Total current assets
127
273
380
430
478
72
132
199
236
274
Tangible fixed assets
271
794
1,464
2,015
2,212
Total non-current assets
343
925
1,663
2,252
2,486
Total assets
470
1,198
2,043
2,682
2,963
Short-term debt
39
77
223
280
270
Accounts payable
26
33
69
137
164
Other current liabilities
17
47
84
84
84
Total current liabilities
82
158
376
501
519
118
475
863
1,121
1,081
2
12
4
4
4
Total non-current liabilities
120
487
866
1,124
1,084
Total liabilities
202
645
1,243
1,625
1,603
Share capital
124
260
346
346
346
Retained earnings reserve
144
195
357
613
917
Shareholders' equity
268
455
703
959
1,263
Minority interests
-
-
Other equity
-
Total equity
268
Total liabilities & equity
470
Total investments
Total long-term debt Other liabilities
(0)
(0)
(0)
98
98
98
553
800
1,057
1,360
1,198
2,043
2,682
2,963
98
Source: Company data, OSK-DMG estimates
See important disclosures at the end of this report
4
Ezion Holdings (EZI SP) 20 February 2014
SWOT Analysis Strong track record with national oil companies and oil majors in the deployment of liftboats and service rigs across the world
New players entering the liftboat and service rig business due to potential lucrative returns
Experienced in working on projects subject to strict environmental protection rules
Liftboats are not a must-have asset, which may prevent full-scale adoption
Increased awareness of safety requirements for maintenance work could lead to more liftboat and service rig deployment opportunities Plenty of room to grow charters due to limited deployment in Asian waters
High net gearing in balance sheet limits its ability to fund new projects without raising net equity or issuing perpetual securities Has to seek third-party operators due to limited chartering experience outside South-East Asia
P/E (x) vs EPS growth
P/BV (x) vs ROAE
35 30
180%
8.0
30.0%
154%
7.0
26.3%
6.0
22.5%
5.0
18.8%
4.0
15.0%
3.0
11.3%
2.0
7.5%
25
129%
20
103%
0.0
0.0%
P/E (x) (lhs)
EPS growth (rhs)
Source: Company data, OSK-DMG estimates
P/B (x) (lhs)
Jan-15
0%
Jan-14
0
Jan-13
3.8%
Jan-12
1.0 Jan-11
26%
Jan-15
5
Jan-14
51%
Jan-13
10
Jan-12
77%
Jan-11
15
Return on average equity (rhs)
Source: Company data, OSK-DMG estimates
Company Profile Ezion Holdings is involved in the provision of offshore and marine logistics and owns one of the largest liftboats in the world.
See important disclosures at the end of this report
5
Ezion Holdings (EZI SP) 20 February 2014
Recommendation Chart Price Close 3.18 2.65 3.18
3.26
3.00
2.55 2.48
2.02 2.20 2.16
1.32
1.31
1.37
1.17 1.25
1.00
1.02
0.92 1.04 1.07
0.87 0.85
0.89
2.5
1.00
Recommendations & Target Price
NR
3.0
2.0
1.5 1.0 0.5 Buy 0.0 Feb-09
Neutral
Sell
May-10
Trading Buy
Sep-11
Take Prof it
Not Rated
Dec-12
Source: OSK-DMG estimates, Bloomberg Date
Recommendation
2014-01-03
Buy
Target Price Price 3.18
2.28
2013-12-24
Buy
3.18
2.28
2013-11-08
Buy
2.65
2.08
2013-10-01
Buy
3.18
1.91
2013-08-07
Buy
3.26
1.98
2013-07-18
Buy
3.00
1.92
2013-05-16
Buy
3.00
1.97
2013-04-18
Buy
2.48
1.73
2013-03-20
Buy
2.48
1.64
2013-03-01
Buy
2.48
1.62
Source: OSK-DMG estimates, Bloomberg
See important disclosures at the end of this report
6
DMG & Partners Research Guide to Investment Ratings Buy: Share price may exceed 10% over the next 12 months Trading Buy: Share price may exceed 15% over the next 3 months, however longer-term outlook remains uncertain Neutral: Share price may fall within the range of +/- 10% over the next 12 months Take Profit: Target price has been attained. Look to accumulate at lower levels Sell: Share price may fall by more than 10% over the next 12 months Not Rated: Stock is not within regular research coverage
DISCLAIMERS This research is issued by DMG & Partners Research Pte Ltd and it is for general distribution only. It does not have any regard to the specific investment objectives, financial situation and particular needs of any specific recipient of this research report. You should independently evaluate particular investments and consult an independent financial adviser before making any investments or entering into any transaction in relation to any securities or investment instruments mentioned in this report. The information contained herein has been obtained from sources we believed to be reliable but we do not make any representation or warranty nor accept any responsibility or liability as to its accuracy, completeness or correctness. Opinions and views expressed in this report are subject to change without notice. This report does not constitute or form part of any offer or solicitation of any offer to buy or sell any securities. DMG & Partners Research Pte Ltd is a wholly-owned subsidiary of DMG & Partners Securities Pte Ltd, a joint venture between OSK Investment Bank Berhad, Malaysia which have since merged into RHB Investment Bank Berhad (the merged entity is referred to as “RHBIB” which in turn is a whollyowned subsidiary of RHB Capital Berhad) and Deutsche Asia Pacific Holdings Pte Ltd (a subsidiary of Deutsche Bank Group). DMG & Partners Securities Pte Ltd is a Member of the Singapore Exchange Securities Trading Limited. DMG & Partners Securities Pte Ltd and their associates, directors, and/or employees may have positions in, and may effect transactions in the securities covered in the report, and may also perform or seek to perform broking and other corporate finance related services for the corporations whose securities are covered in the report. This report is therefore classified as a non-independent report. As of 19 February 2014, DMG & Partners Securities Pte Ltd and its subsidiaries, including DMG & Partners Research Pte Ltd, do not have proprietary positions in the subject companies, except for: a) As of 19 February 2014, none of the analysts who covered the stock in this report has an interest in the subject companies covered in this report, except for: a) DMG & Partners Research Pte. Ltd. (Reg. No. 200808705N)
Kuala Lumpur
Hong Kong
Singapore
Malaysia Research Office RHB Research Institute Sdn Bhd Level 11, Tower One, RHB Centre Jalan Tun Razak Kuala Lumpur Malaysia Tel : +(60) 3 9280 2185 Fax : +(60) 3 9284 8693
RHB OSK Securities Hong Kong Ltd. (formerly known as OSK Securities Hong Kong Ltd.) 12th Floor World-Wide House 19 Des Voeux Road Central, Hong Kong Tel : +(852) 2525 1118 Fax : +(852) 2810 0908
DMG & Partners Securities Pte. Ltd. 10 Collyer Quay #09-08 Ocean Financial Centre Singapore 049315 Tel : +(65) 6533 1818 Fax : +(65) 6532 6211
Jakarta
Shanghai
Phnom Penh
PT RHB OSK Securities Indonesia (formerly known as PT OSK Nusadana Securities Indonesia) Plaza CIMB Niaga 14th Floor Jl. Jend. Sudirman Kav.25 Jakarta Selatan 12920, Indonesia Tel : +(6221) 2598 6888 Fax : +(6221) 2598 6777
RHB OSK (China) Investment Advisory Co. Ltd. (formerly known as OSK (China) Investment Advisory Co. Ltd.) Suite 4005, CITIC Square 1168 Nanjing West Road Shanghai 20041 China Tel : +(8621) 6288 9611 Fax : +(8621) 6288 9633
RHB OSK Indochina Securities Limited (formerly known as OSK Indochina Securities Limited) No. 1-3, Street 271 Sangkat Toeuk Thla, Khan Sen Sok Phnom Penh Cambodia Tel: +(855) 23 969 161 Fax: +(855) 23 969 171
Bangkok RHB OSK Securities (Thailand) PCL (formerly known as OSK Securities (Thailand) PCL) 10th Floor, Sathorn Square Office Tower 98, North Sathorn Road,Silom Bangrak, Bangkok 10500 Thailand Tel: +(66) 2 862 9999 Fax : +(66) 2 108 0999
7