Available online at www.sciencedirect.com
Thin Solid Films 516 (2008) 3274 – 3281 www.elsevier.com/locate/tsf
Fabrication and characterization of chemical sensors made from nanostructured films of poly(o-ethoxyaniline) prepared with different doping acids E.D. Brugnollo a,b , L.G. Paterno c,⁎, F.L. Leite a,b , F.J. Fonseca c , C.J.L. Constantino d , P.A. Antunes d , L.H.C. Mattoso a a
EMBRAPA Instrumentação Agropecuária, CP 741, CEP 13560-970, São Carlos, SP, Brazil Instituto de Física de São Carlos, USP, CP 369, CEP 13560-970, São Carlos, SP, Brazil c Departamento de Engenharia de Sistemas Eletrônicos, EPUSP, CEP 05508-900, São Paulo, SP, Brazil Departamento de Física, Química e Biologia, FCT-UNESP, CEP 19060-900, Presidente Prudente, SP, Brazil b
d
Received 8 February 2007; received in revised form 20 July 2007; accepted 10 August 2007 Available online 29 August 2007
Abstract Chemical sensors made from nanostructured films of poly(o-ethoxyaniline) POEA and poly(sodium 4-styrene sulfonate) PSS are produced and used to detect and distinguish 4 chemicals in solution at 20 mM, including sucrose, NaCl, HCl, and caffeine. These substances are used in order to mimic the 4 basic tastes recognized by humans, namely sweet, salty, sour, and bitter, respectively. The sensors are produced by the deposition of POEA/PSS films at the top of interdigitated microelectrodes via the layer-by-layer technique, using POEA solutions containing different dopant acids. Besides the different characteristics of the POEA/PSS films investigated by UV–Vis and Raman spectroscopies, and by atomic force microscopy, it is observed that their electrical response to the different chemicals in liquid media is very fast, in the order of seconds, systematical, reproducible, and extremely dependent on the type of acid used for film fabrication. The responses of the as-prepared sensors are reproducible and repetitive after many cycles of operation. Furthermore, the use of an “electronic tongue” composed by an array of these sensors and principal component analysis as pattern recognition tool allows one to reasonably distinguish test solutions according to their chemical composition. © 2007 Published by Elsevier B.V. Keywords: Chemical sensors; Electronic tongue; Poly(o-ethoxyaniline); Nanostructured films; Atomic force microscopy
1. Introduction Chemical sensors using thin films of conjugated polymers as sensing element have been rapidly developed in the last decades [1,2]. This type of sensor is basically comprised by a suitable electrode coated with the polymeric film, whose electrical responses change accordingly to the physicochemical characteristics of the environment surrounding them, either gas or liquid phase. Such characteristics may be related to the presence of a specific chemical compound (analyte), pH, ionic strength, ⁎ Corresponding author. Departamento de Engenharia de Sistemas Eletrônicos, EPUSP, CEP 05508-900, São Paulo, SP, Brazil. Tel.: +55 11 3091 5256r215; fax: +55 11 3091 5585. E-mail address:
[email protected] (L.G. Paterno). 0040-6090/$ - see front matter © 2007 Published by Elsevier B.V. doi:10.1016/j.tsf.2007.08.118
dielectric constant, and so on. Additionally, conducting polymers are relatively cheap, and can be processed into thin films. These advantages are highly desirable when considering the development of low cost technologies. Because conjugated polymers are sensitive to several classes of compounds, chemical sensors made with these materials are usually non-selective and non-specific [1,2]. For that reason they have found great utility in multi-sensor systems, including especially “electronic nose” [3] and “electronic tongue” [4]. These sensor systems use the non-specificity of several different sensors as a way to produce unique response patterns (fingerprints) for the samples they are designed to analyze. These patterns are later recognized by statistical or computational tools which allow the identification and classification of the sample according to the information provided during sensor training.
E.D. Brugnollo et al. / Thin Solid Films 516 (2008) 3274–3281
Fig. 1. UV–Vis spectra of films containing 10 POEA/PSS bilayers fabricated with different dopant acids, as indicated. Solution conditions: Polymeric concentration 0.1 g L− 1; pH 3.
Therefore, for such a kind of application, the sensors must be stable and chemically different since specificity and selectivity are not required. Although stability may be critical, conducting polymers of different chemical structures (and properties) can be easier obtained when compared to other sensoactive materials [2]. A simple strategy for that is doping the polymer with different acids. Polyaniline and its derivatives undergo doping by a typical acid-base reaction, in which the H+ from the dopant acid protonates the nitrogen atoms of the polymeric chains [5,6]. At the same time, the counterions are associated to the protonated chain in order to maintain its electroneutrality. It is observed that the nature of the associated counterions plays significant roles on the morphology and electrical properties of the doped polymers [5–8].
3275
In the present contribution, we report on the fabrication of chemical sensors based on nanostructured films of a conjugated polymer, poly(o-ethoxyaniline) POEA, and study on their electrical performance in an “electronic tongue” system. The sensors are comprised by POEA films deposited through the layer-by-layer technique (LbL) at the top of interdigitated microelectrodes. Doping of POEA solutions with different protonic acids allows the fabrication of sensors with distinct surface morphologies, and distinct electrical responses. The chemical structure and morphology of the POEA films are investigated by UV–Vis and Raman spectroscopy, and by atomic force microscopy (AFM). The performance of the chemical sensors made with POEA films is studied by electrical capacitance measurements. Sucrose, sodium chloride, caffeine, and hydrochloric acid diluted solutions are used as test samples. 2. Experimental details Poly(o-ethoxyaniline), POEA (Mw 14,000), was chemically synthesized according to method described elsewhere [9]. Poly (sodium 4-styrenesulfonate) PSS (Mw 70,000) and the doping acids hydrochloric acid (HCl), sulfuric acid (H2SO4), nitric acid (HNO3), p-toluenesulfonic acid monohydrate (TSA), and 10camphorsulphonic acid (CSA), were all purchased from SigmaAldrich, and used as received. For sensor analysis, we prepared test solutions using sodium chloride (Sigma-Aldrich), hydrochloric acid (Sigma-Aldrich), sucrose (Mallinkrodt), and caffeine (Malinkrodt). These substances were used in order to mimic the 4 basic tastes recognized by humans. All water used in this work was purified by a Milli-Q system (Millipore Co.), resistance 18 MΩ cm−1. All films were deposited onto optical glass slides (1 × 10 × 30 mm) previously cleaned using a piranha solution followed by RCA solution (NH4OH/H2O2/H2O 1:1:5, v/v). For
Fig. 2. Resonance Raman spectra (λo = 785 nm) of an undoped POEA film (10 layers) and POEA/PSS films (10 bilayers) fabricated with different acids as indicated.
3276
E.D. Brugnollo et al. / Thin Solid Films 516 (2008) 3274–3281
Table 1 Assignment of key bands for films of undoped POEA and doped POEA/PSS Vibration mode
C–N stretching C–N+ stretching C_N stretching C–N•+ stretching C–C stretching C–H bending, benzenoid C–H bending, quinoid
Wavenumber (cm− 1) Undoped film
Doped film
1250 – 1481 – 1600 1199 1132
1279 1227 1513 1337 1625 1199 1132
Table 2 Morphological parameters obtained from AFM images of POEA/PSS films fabricated with different doping acids Dopant acid
Globule mean diameter (nm) a
Mean roughness (nm) b
Undoped H2SO4 HNO3 HCl CSA TSA
137 160 149 124 120 108
1.4 3.6 2.0 1.0 1.4 1.3
a b
the electrical measurements, films were deposited onto glass slides containing gold interdigitated microelectrodes. For film deposition, solutions of each polymer (0.1 g L− 1, pH 3) were prepared in ultra-pure water, except that POEA was initially dissolved in dimethyl acetamide and diluted in water afterwards. Both solutions were filtered prior to use. The pH of solutions was adjusted by adding the acids abovementioned or NH4OH. Film depositions were carried out at room temperature (25 °C) by using the layer-by-layer technique [10], briefly described as follows: the glass substrate was immersed in the doped POEA solution for 3 min followed by rinsing in an
Fig. 3. AFM images of an undoped POEA film (5 layers) and POEA/PSS films (5 bilayers). The images refer to a POEA layer on top. A) undoped POEA film, B) POEA.HCl/PSS, C) POEA.CSA/PSS, D) POEA.TSA/PSS, E) POEA.HNO3/ PSS, F) POEA.H2SO4/PSS. Maximum Z scale: 10 nm.
Standard deviation ∼ 15%. Standard deviation ∼ 7%.
aqueous solution of same pH and same acid during 30 s, and then dried with a gentle flow of high purity gaseous N2. A subsequent PSS layer was adsorbed in the same way, followed by rinsing and drying. These steps generate a film containing 1 bilayer of POEA/PSS, and films containing up to 10 bilayers were fabricated by repeating these steps successively. The same procedure was adopted for the deposition of films on the interdigitated microelectrodes. The chemical structure of POEA/PSS films was investigated by UV–Vis (Hitachi U2001 model), and Raman spectroscopies (micro-Raman spectrograph Renishaw, 785 nm laser line, power at the sample was ca. 50 W). The morphological characterization was conducted in an atomic force microscope
Fig. 4. Electrical capacitance versus time of immersion in a NaCl 20 mM solution, for sensors made with POEA/PSS films (10 bilayers) fabricated with different dopant acids, at A) 100 Hz and B) 1 kHz.
E.D. Brugnollo et al. / Thin Solid Films 516 (2008) 3274–3281
3277
measurements for each solution were taken during 5 different days. In order to avoid experiment artifacts and to confirm system reproducibility, the sequence in which the solutions were analyzed was changed every day. Principal component analysis (PCA) was used as pattern recognition tool. PCA score plots made by using a pre-designed algorithm and the MATLAB (version 6.1) software were used in order to verify the ability of the sensor array to identify and classify the tested samples. In a second set of experiments, the performance of sensors was evaluated by carrying out successive measurements in pure water and NaCl 20 mM solution. Up to 20 cycles of water/NaCl were performed. 3. Results and discussion In Fig. 1, UV–Vis spectra of POEA/PSS, 10 bilayers, fabricated with POEA solutions doped with different acids are presented where it is clearly seen the presence of the polaronic band, around 770 nm, typical of the doped polymer [5]. The position of the polaronic band is slightly shifted to a higher wavelength (800 nm) in the film made with TSA. Another important issue is regarded to the dependence of the amount of POEA adsorbed on the type of acid used for doping. Once the absorbance is proportional to the concentration of absorbing material, as stated by the Lambert–Beer equation, one can infer that the amount of POEA in the films increases according to the
Fig. 5. Electrical fingerprints for different chemicals obtained with sensors made from POEA/PSS films (10 bilayers) fabricated with different dopant acids, as indicated. A) 100 Hz, B) 1 kHz.
(Topometrix Discoverer TMX 2010), using silicon nitride tips (V-shape) attached to a cantilever of spring constant of 0.09 N m− 1. All images were obtained in the contact mode at a scan rate of 2 Hz. The root-mean-square roughness (Rrms) was calculated using the software provided by the instrument. Values measured at 3 different regions on film samples were used to calculate an average Rrms. The electrical measurements were carried out with a LCR meter HP 4263A from Hewlett-Packard, in a similar setup previously used [4]. Each sensor comprising a POEA/PSS film (10 bilayers) made with different protonic acids and deposited on interdigitated microelectrodes were immersed in solutions of NaCl, HCl, sucrose and caffeine at 20 mM and their electrical capacitance was measured at 100 Hz and 1 kHz. Between each solution, the sensors were soaked in ultra pure water under stirring for 5 min for cleaning purposes. The electrical capacitance of each sensor in ultra pure water was also measured before and after tested solutions in order to verify signal reset. In a first set of experiments, the variation of the electrical capacitance of each sensor as a function of the time of contact with the test solution was evaluated. This was made in order to understand the time dependence of the electrical response of the sensors, and to establish a minimum time for initiating the measurements. Later, electrical capacitance
Fig. 6. Electrical capacitance measured alternately in ultrapure water and NaCl 20 mM solution with sensor containing a POEA/PSS film (10 bilayers) fabricated with H2SO4 at 100 Hz and 1 kHz. A) 20 cycles, B) 2 cycles.
3278
E.D. Brugnollo et al. / Thin Solid Films 516 (2008) 3274–3281
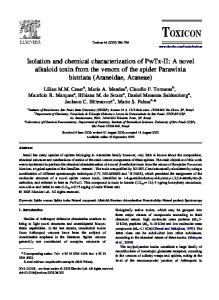
Fig. 7. PCA plot of an “electronic tongue” composed by a sensor array of five sensors for liquids of different tastes, sucrose, caffeine, NaCl and HCl. A) 100 Hz, B) 1 kHz.
type of acid in the following order: HCl b CSA bTSA b HNO3 H2SO4. In a previous contribution [11], we have verified that organic and bulkiest dopant acids led to a greater amount of polymer adsorbed in comparison to films fabricated with HCl. Due to the fact that the counterions from these acids are less solvated by water, they are more strongly associated to the protonated nitrogen atoms from POEA, leading to a more effective charge screening. As a result, intra and intermolecular electrostatic repulsions between doped POEA chains are minimized, allowing the approximation of a greater amount of polymeric segments and also inducing the polymer to assume a more compact molecular conformation. Both effects contribute to the adsorption of a greater amount of polymer. A more detailed characterization of the chemical structure of undoped POEA and doped POEA/PSS films was carried out through Raman spectroscopy and the results are presented in Fig. 2. As it can be observed, the most significant difference between the spectra is the presence of the radical cation band (C–N•+ stretching) in doped films, centered in 1337 cm− 1. Such a band, as expected, does not appear for the undoped POEA film. The radical cation is formed in the POEA solution and it is stabilized by the association of acid counterions. As
mentioned before, the protonation of nitrogen atoms in the polymer chain leads the formation of an electronic state located in the middle of the gap, which in the case of aromatic conducting polymers is called polaron [5,6]. In the films, the radical cations are then stabilized by the formation of ionic bonds with the sulfonic groups from PSS. As it will be discussed later, the counterions from dopant acids associated with the POEA in solution are not included in the film. We can also identify the quinoid and benzene units, whose bands intensity is significantly high because of excitation of the samples at high wavelengths [12,13]. In comparison to different polyaniline systems already investigated [12,13], we could identify the most significant bands from the spectra of undoped POEA and doped POEA/PSS films, as presented in Table 1. For sensor applications, the surface characteristics of the sensoactive layer including surface energy, chemical composition and surface morphology need to be known, once the interactions between sensor and analyte are mostly occurring at the surface of the sensoactive layer. In this regard, AFM is an useful tool to analyze the morphology of nanostructured materials, mainly because it possess high vertical resolution. AFM images from undoped POEA and doped POEA/PSS films, in which the topmost layer is the fifth POEA layer, are presented in Fig. 3. As it can be noted, the different acids provide different film morphologies. Although the globules represent the simplest morphological structures in all films, their diameters varies significantly according to each type of dopant acid used, from 108 nm for TSA to 160 nm for H2SO4, as presented in Table 2. The adsorption of polyanilines in layer-bylayer films is believed to occur based on a two step mechanism [14], involving a fast first-order kinetic process with a characteristic time of few seconds and a slower process represented by a Johnson–Mehl–Avrami function with a characteristic time of hundreds of seconds. These two steps represent the nucleation and growth mechanisms, which in the case of the above materials usually leads to the formation of globules [15–19]. Once the AFM images of POEA/PSS films show the presence of globules, one may conclude that a similar adsorption mechanism takes place in these systems. In addition, POEA layers in films alternated with sulfonated lignin presented similar globular morphology which corroborates our observations [11,19]. Still on the data presented in Table 2, it can be noted that the number and size of formed globules depend on the type of dopant acid used for film fabrication. The globules size of films fabricated with HNO3 and H2SO4 are comparatively larger than those found in undoped POEA films. On the other hand, films of POEA fabricated with HCl, TSA and CSA presented smaller globules than those found in undoped film. Literature data have demonstrated that the doping process induces globule swelling in polyaniline films, due to counterion inclusion [20]. Nonetheless, in the LbL films the complexation process between polycation and polyanion excludes the counterions which become part of the supernatant, and therefore, they are not expected to be found within film structure, except at the topmost layer [21]. In this sense, the variances on globule size in POEA films must be related to the influence of different dopant
E.D. Brugnollo et al. / Thin Solid Films 516 (2008) 3274–3281
acids on the polymer adsorption process and not to dopant counterion inclusion. As a consequence of different globules size the film surface roughness is also varied depending on the dopant acid. Films obtained with HCl, TSA and CSA show a flatter surface when compared to films fabricated with H2SO4 and HNO3. A plausible explanation for such an effect is that as more POEA is adsorbed rougher is the resulting film. Different studies [15,22] have shown that the surface roughness of POEA and POMA LbL films increases with the amount of adsorbed polymer until it reaches a maximum around 10–15 bilayers, which corroborates our hypothesis. After a detailed characterization of the structure and morphology of POEA/PSS films, chemical sensors made with such films were fabricated and their electrical properties were investigated. In Fig. 4 is shown the variation of the electrical capacitance of different sensors with the time of immersion in a NaCl 20 mM solution. As it can be seen, once the sensors get in contact with the test solution their electrical capacitance are almost instantly changed, and reached a constant value in the order of tens of seconds. This behavior was systematical and reproducible for all tested solutions, and in both investigated frequencies. For further tests, the sensors were left soaking in the test solutions for 5 min prior to capacitance measurements. The response of sensors fabricated with different dopant acids to solutions of different tastes is illustrated in Fig. 5. Capacitance values represent an average of 50 measurements taken 5 min after the immersion of the sensors in the test solution. In order to verify the reproducibility of responses, measurements were taken during 5 consecutive days and the solutions were tested in different sequences to avoid experiments artifacts. Sensors signal is higher at 100 Hz than at 1 kHz, and it is much higher to NaCl and HCl than that for sucrose and caffeine, independently on the dopant acid and frequency. However, the sensor signal to a certain substance depended on the type of dopant acid used for sensor fabrication. POEA/PSS sensors fabricated with TSA and CSA presented higher signal to sucrose and caffeine when compared to other dopants. For NaCl and HCl, sensors fabricated with TSA and H2SO4 present the highest signals. Although the limiting concentration of analytes was 20 mM, the sensors were able to detect them even at 10 μM, which has been also achieved with other similar systems [23,24]. It is important to note that sensors signal depended on the frequency of the applied electrical potential. On the measurements taken at 100 Hz, capacitance values were higher than those measured at 1 kHz. Taylor and MacDonald have described in their work [25] that the electrical characteristics of a metal electrode coated with a dielectric thin film and immersed in an electrolyte solution depends decisively on the frequency of the applied electrical potential. Modeling the system by an equivalent circuit, and taking into account the contribution of the different interfaces as circuit elements, they have observed that the electrical capacitance decreases as the frequency increases. At low frequency, the electrical impedance receives its largest contribution from the electrical double layer which is formed at film– liquid interface. For intermediary values, ranging between 100 and 104 Hz, the presence of the film is manifested, and finally at
3279
higher frequency the impedance is dominated mainly by the geometric capacitance of the electrodes. Interpreting our data based on this previous discussion, we can realize that at 100 Hz the contribution of an electrical double layer could be more significant than at 1 kHz and, therefore, the capacitance should be higher at this frequency. As the frequency is increased, the ions will move according to the oscillating field in such a way that the period of time they stay in contact with electrodes is short enough to prevent double layer formation. However, this effect is occurring only for ions, including NaCl and HCl, but it is not extended for sucrose and caffeine, once they are non-electrolytes. This may also explain the low signal of all sensors to these two substances. Another important characteristic of these sensors is that their signal increased with the amount of POEA adsorbed in the films. POEA/PSS sensors fabricated with TSA and H2SO4 exhibited higher signal than other sensors regardless the substance on study. From UV–Vis data we have found that these sensors contain more POEA than others. In a particular study, Stussi et al. [26] have found that the sensitivity of evaporated polypyrrole films to toluene vapor decreased as the film thickness increased. They have attributed this behavior to the gas sorption into the film, which should be easier achieved for thinner films instead of thicker ones. Nonetheless, sorption phenomena must be completely different in liquid media, considering that the interactions between analyte and sensing layer must be stronger. Moreover, we have previously showed that film roughness, which may be a representative of surface area, increases with the amount of POEA adsorbed [24]. Therefore, one could also expect that sensors signal must increase with the amount of POEA, since signal and sensitivity usually increase with the surface area of the sensoactive layer. However, no additional relationship between globules size and sensor signal was found for the studied sensors. The performance of these sensors in continued operation was evaluated by measuring their electrical capacitance when they were alternately immersed in ultra-pure water and NaCl 20mM solution. Fig. 6A shows the response of sensor containing a POEA/PSS film, 10 bilayers, fabricated with H2SO4 during 20 cycles of successive operation at 100 Hz and 1 kHz. An amplification of the response of this sensor is presented in Fig. 6B. Open dots and filled squares represent the 50 measurements continuously taken with the sensor immersed in the test sample. The reproducibility of the electrical response for ultrapure water and NaCl 20 mM can be clearly seen, regardless the frequency. The initial capacitance value for water is always recovered after each measurement in NaCl, indicating great reversibility of the sensor response. Besides, the steady capacitance value is rapidly reached in both liquids ultrapure water and NaCl. Other sensors were submitted to the same evaluation and exhibited the same behavior, which could be reproduced several times. Currently, we are carrying out experiments in order to verify sensor stability and aging, after numerous cycles of operation. Although specificity may be introduced into polymeric materials allowing them to effectively carry out molecular recognition processes, literature data have demonstrated that non-modified conducting polymer films are usually nonspecific, and they may respond to different analytes whatever
3280
E.D. Brugnollo et al. / Thin Solid Films 516 (2008) 3274–3281
it would be their chemical composition [1,2]. From previous contributions [4,27,28] it was observed that a same polymer film could respond to different analytes and beverages, confirming the theory that these materials in their pristine condition usually do not present a specific response to a particular substance. Considering an array of sensors made with different conducting polymer films, each of them will respond to a same analyte with different sensitivity levels. The individual responses of each sensor will form together a fingerprint of the sample analyzed, which will contain the information used to identify and distinguish one sample from another. Sensor array technology has gained special interest in the last years, since the low specificity presented by an individual sensing unit may be overcome by collecting responses from a group of sensors instead. Furthermore, different methods of multivariate data analysis have been applied to interpret the response of electronic tongues [29]. Using a sensor array composed of POEA/PSS sensors fabricated with different acids and principal component analysis (PCA) as a pattern recognition tool, we could distinguish test solutions of different tastes, as displayed by the PCA plot showed in Fig. 7. Each kind of taste is at a defined location in the plot, confirming that this sensor array works according to the global selectivity concept [4,27,28,30] mimicking the working of the human tongue at a certain extent. In previous contributions it has been obtained similar performances using sensors composed of films from different materials [4,27,28]. Once the sensors fabricated in the present study have low sensitivity for bitter and sweet substances, the discrimination between these two groups is difficult to be achieved. 4. Conclusions Chemical sensors made from nanostructured films of poly(oethoxyaniline) POEA and poly(sodium 4-styrene sulfonate) PSS were produced and used to detect and distinguish 4 different substances in solution at 20 mM, namely sucrose, NaCl, HCl, and caffeine. These substances were used in order to mimic the four basic tastes recognized by humans. The sensors were produced by the deposition of POEA/PSS films at the top of interdigitated microelectrodes via the layer-by-layer technique, using POEA solutions containing different dopant acids. The amount of POEA adsorbed and the morphology of films depended on the type of acid used for film fabrication. The doping of POEA was satisfactorily achieved with all acids and POEA was found to be doped in all films fabricated, as demonstrated by UV–Vis and Raman spectroscopy data. AFM images showed that all films exhibited a typical globular structure, with globules sizes varying between 100 and 160 nm in diameter, depending upon the dopant acid used for film fabrication. Films containing greater amounts of POEA exhibited greater surface roughness. The electrical response of the as-prepared chemical sensors was very fast, in the order of seconds, systematical and reproducible. In general, sensors signal depended on the frequency of electrical potential investigated and on the amount of POEA adsorbed in the sensoactive layer. At 100 Hz the sensors signal
was higher than at 1 kHz, possibly due to a contribution from the electrical double layer. The signal increased with the amount of POEA in the sensors, indicating that POEA is the main responsible for chemical detection. We have also found that the film surface roughness, which depended on the type of dopant acid, could also influence the sensors signal towards analytes. The performance of these sensors could be evaluated, showing that their electrical responses are reproducible and repetitive after many cycles of operation. Furthermore, the use of an “electronic tongue” composed by an array of sensors made up of POEA/PSS films and principal component analysis as pattern recognition tool allows one to reasonably distinguish test solutions according to their chemical composition. The easiness of film fabrication with controlled properties makes these sensors very attractive when low cost technologies are pursued. Acknowledgements The authors wish to thank the financial support provided by Brazilian funding agencies CNPq, Rede Nanobiotec/MCT, CAPES and FAPESP. References [1] A.G. Guiseppi-Elie, G.G. Wallace, T. Matsue, in: T.A. Skotheim, R.L. Elsenbaumer, J.R. Reynolds (Eds.), Handbook of Conducting Polymers, Marcel Dekker, New York, 1998, p. 963. [2] E.S. de Medeiros, L.G. Paterno, L.H.C. Mattoso, in: C. Graimes (Ed.), Encyclopedia of Sensors, vol. 1, American Scientific Publishers, California, 2006, p. 1. [3] K.C. Persaud, Mat. Today 8 (2005) 38. [4] A. Riul Jr., A.M. Gallardo Soto, S.V. Mello, S. Bone, D.M. Taylor, L.H.C. Mattoso, Synth. Met. 132 (2003) 109. [5] J.C. Chiang, A.G. MacDiarmid, Synth. Met. 13 (1986) 193. [6] A.G. MacDiarmid, Synth. Met. 125 (2002) 11. [7] C.Y. Yang, Y. Cao, P. Smith, A.J. Heeger, Synth. Met. 53 (1993) 293. [8] A.J. Motheo, J.R. Santos, E.C. Venancio, L.H.C. Mattoso, Polymer 39 (1998) 6977. [9] L.H.C. Mattoso, S.K. Manohar, A.G. MaCDiarmid, A.J. Epstein, J. Polym. Sci., A, Polym. Chem. 33 (1995) 1227. [10] G. Decher, J.-D. Hong, J. Schmitt, Thin Solid Films 210/211 (1992) 831. [11] L.G. Paterno, L.H.C. Mattoso, J. Appl. Polym. Sci. 83 (2002) 1309. [12] J.E.P. da Silva, M.L.A. Temperini, S.I.C. de Torresi, Electrochim. Acta 44 (1999) 1887. [13] J.E.P. da Silva, D.L.A. de Faria, S.I.C. de Torresi, M.L.A. Temperini, Macromolecules 33 (2000) 3077. [14] M. Raposo, R. Pontes, L.H.C. Mattoso, O.N. Oliveira, Macromolecules 30 (1997) 6095. [15] F.L. Leite, L.G. Paterno, C.E. Borato, P.S.P. Herrmann, O.N. Oliveira, L.H.C. Mattoso, Polymer 46 (2005) 12503. [16] M. Raposo, O.N. Oliveira Jr., Langmuir 18 (2002) 6866. [17] N.C. de Souza, J.R. Silva, C.A. Rodrigues, A.C. Hernandes, L.F. Costa, J.A. Giacometti, O.N. Oliveira Jr., Synth. Met. 135/136 (2003) 121. [18] N.C. de Souza, J.R. Silva, R. diThommazo, M. Raposo, D.T. Balogh, J.A. Giacometti, O.N. Oliveira Jr., J. Phys. Chem., B 108 (2004) 13599. [19] L.G. Paterno, L.H.C. Mattoso, Polymer 42 (2001) 5239. [20] L. Xie, L.J. Buckley, J.Y. Josefowicz, J. Mater. Sci. 29 (1994) 4200. [21] J.B. Schlenoff, H. Ly, M.J. Li, J. Am. Chem. Soc. 120 (1998) 7626. [22] R.F.M. Lobo, M.A.P. da Silva, M. Raposo, R.M. Faria, O.N. Oliveira, Nanotechnology 14 (2003) 101. [23] C.E. Borato, F.L. Leite, O.N. Oliveira, L.H.C. Mattoso, Sens. Lett. 4 (2006) 155.
E.D. Brugnollo et al. / Thin Solid Films 516 (2008) 3274–3281 [24] N.K.L. Wiziack, L.G. Paterno, F.J. Fonseca, L.H.C. Mattoso, Sens. Actuators, B, Chem. 122 (2007) 484. [25] D.M. Taylor, A.G. MacDonald, J. Phys. D: Appl. Phys. 20 (1987) 1277. [26] E. Stussi, R. Stella, D. de Rossi, Sens. Actuators, B, Chem. 43 (1997) 180. [27] A. Riul Jr., R.R. Malmegrin, F.J. Fonseca, L.H.C. Mattoso, 0Biosens. Bioelectron. 18 (2003) 1365.
3281
[28] A. Riul Jr., H.C. de Sousa, R.R. Malmegrim, D.S. dos Santos, A.C.P.L.F. Carvalho, F.J. Fonseca, O.N. Oliveira Jr., L.H.C. Mattoso, Sens. Actuators, B, Chem. 98 (2004) 77. [29] C. Krantz-Rulcker, M. Stenberg, F. Winquist, I. Lundstrom, Anal. Chim. Acta 426 (2001) 217. [30] K. Toko, Meas. Sci. Technol. 9 (1998) 1919.