Stromal uptake and transmission of acid is a pathway for venting cancer cell-generated acid Alzbeta Hulikovaa, Nicholas Blacka, Lin-Ting Hsiab, Jennifer Wildingb, Walter F. Bodmerb,1, and Pawel Swietacha,1 a Department of Physiology, Anatomy and Genetics, University of Oxford, Oxford OX1 3PT, United Kingdom; and bCancer and Immunogenetics Laboratory, Weatherall Institute of Molecular Medicine, Department of Oncology, University of Oxford, John Radcliffe Hospital, Oxford OX3 9DS, United Kingdom
Contributed by Walter F. Bodmer, July 5, 2016 (sent for review April 2, 2016; reviewed by Diane L. Barber and Robert J. Gillies)
Proliferation and invasion of cancer cells require favorable pH, yet potentially toxic quantities of acid are produced metabolically. Membrane-bound transporters extrude acid from cancer cells, but little is known about the mechanisms that handle acid once it is released into the poorly perfused extracellular space. Here, we studied acid handling by myofibroblasts (colon cancer-derived Hs675.T, intestinal InMyoFib, embryonic colon-derived CCD-112-CoN), skin fibroblasts (NHDF-Ad), and colorectal cancer (CRC) cells (HCT116, HT29) grown in monoculture or coculture. Expression of the acidloading transporter anion exchanger 2 (AE2) (SLC4A2 product) was detected in myofibroblasts and fibroblasts, but not in CRC cells. Compared with CRC cells, Hs675.T and InMyoFib myofibroblasts had very high capacity to absorb extracellular acid. Acid uptake into CCD112-CoN and NHDF-Ad cells was slower and comparable to levels in CRC cells, but increased alongside SLC4A2 expression under stimulation with transforming growth factor β1 (TGFβ1), a cytokine involved in cancer–stroma interplay. Myofibroblasts and fibroblasts are connected by gap junctions formed by proteins such as connexin43, which allows the absorbed acid load to be transmitted across the stromal syncytium. To match the stimulatory effect on acid uptake, cell-to-cell coupling in NHDF-Ad and CCD-112-CoN cells was strengthened with TGFβ1. In contrast, acid transmission was absent between CRC cells, even after treatment with TGFβ1. Thus, stromal cells have the necessary molecular apparatus for assembling an acidventing route that can improve the flow of metabolic acid through tumors. Importantly, the activities of stromal AE2 and connexin43 do not place an energetic burden on cancer cells, allowing resources to be diverted for other activities. colorectal cancer TGFβ1
growth has an optimal cancer cell pHi and microenvironment pHe, and that both must be regulated (1, 9). In summary, acid venting in diffusion-limited tumors must be adequate to support high metabolic rates, without overloading the extracellular compartment with H+ ions. The task of facilitating acid venting from cancer cells, without excessively acidifying their microenvironment, could be met by the tumor stroma (10). In many cancers, the stroma occupies a substantial fraction of the tumor volume and holds a large reservoir of H+-binding moieties available for buffering excess extracellular acidity. In colorectal cancers (CRCs), the myofibroblast stroma surrounding epithelial cells may offer an alternative route for venting acid, that bypasses the extracellular space (11). For this to be a viable pathway, stromal cells would need to preferentially absorb acid released by cancer cells and transmit this acidity across a large and coupled intracellular volume (“syncytium”). Stromal cells have been shown to interact with cancer cells on many levels (12–14), but their role as sinks for siphoning acid has not been tested. Here, we compare acid-handling mechanisms in CRC cells, with those in gut myofibroblasts and skin fibroblasts. The recent characterization of markers (AOC3, NKX2-3, SHOX2) allows a robust definition of stromal cells as either myofibroblasts or fibroblasts; this is important as the former is the relevant stromal cell type in colorectal tumors (11). Compared with CRCs, myofibroblasts have higher expression of anion exchanger 2 (AE2), a major acid-loading transporter, and connexin-43 (Cx43), a gap Significance
| myofibroblast | anion exchanger 2 | gap junctions |
C
ancer cells produce vast quantities of acid (H ions) (1, 2). Because of the chemical reactivity of H+ ions, a substantial fraction of energetic and synthetic resources is directed to keeping intracellular pH (pHi) within a narrow range (typically 7.0–7.4) that is permissive for biological activity. Indeed, dysregulated pHi has been shown to perturb or even kill cancer cells (3, 4). Current models of acid handling in tumors are centered on cancer cell mechanisms, which effectively transfer acidity from cytoplasm to the surrounding milieu. An additional process, referred to herein as acid venting, is responsible for carrying acid toward capillaries for washout. At steady state, H+ production must be balanced by a matching venting flux; as a consequence, metabolic rate is constrained by the tissue’s capacity to remove acid. In well-perfused tissues, acid venting occurs rapidly by passive diffusion over short distances. However, in hypoxic tumors, the relatively long diffusion path to the nearest functional capillary (2, 5) is a bottleneck for venting large quantities of acid generated by cancer cells (6). This diffusive restriction produces the characteristically acidic extracellular tumor microenvironment (7). Although an acidic milieu is conducive for cancer disease progression (4), there is a homeostatic requirement for regulating extracellular pH (pHe) within the tolerance limits of cancer cells. For instance, excessively low pHe makes it thermodynamically more costly for cells to maintain favorable pHi (8). The emerging consensus is that tumor E5344–E5353 | PNAS | Published online August 19, 2016
Metabolism energizes cancer growth, but only if its end product, acid, is removed effectively. A bottleneck for acid handling is slow diffusion across the underperfused extracellular milieu of hypoxic tumors. Here, we characterize the acid-handling mechanisms operating in stromal myofibroblasts that can improve the flow of acid through tumors. We show that myofibroblasts are high-capacity reservoirs that absorb excess extracellular acidity, via the AE2 transporter, and transmit this acid load across a syncytium fused by channels, such as connexin-43. Furthermore, the cytokine TGFβ1, which orchestrates many cancer–stromal interactions, can stimulate acid uptake and transmission in stromal cells with lower baseline activities. Because many colorectal cancer cells do not express AE2 and connexin-43, acid traffic would be routed preferentially through the stromal compartment of tumors.
+
Author contributions: A.H., J.W., W.F.B., and P.S. designed research; A.H., N.B., and L.-T.H. performed research; L.-T.H. contributed new reagents/analytic tools; A.H., N.B., L.-T.H., J.W., W.F.B., and P.S. analyzed data; and A.H., W.F.B., and P.S. wrote the paper. Reviewers: D.L.B., University of California, San Francisco; and R.J.G., H. Lee Moffitt Cancer Center. The authors declare no conflict of interest. Freely available online through the PNAS open access option. 1
To whom correspondence may be addressed. Email:
[email protected] or
[email protected].
This article contains supporting information online at www.pnas.org/lookup/suppl/doi:10. 1073/pnas.1610954113/-/DCSupplemental.
www.pnas.org/cgi/doi/10.1073/pnas.1610954113
Results In Myofibroblasts and Fibroblasts, Expression of SLC4A2 Is Highest Among Members of the SLC4 and SLC26 Families Coding for AcidLoading Transporters. A viable stromal mechanism for handling
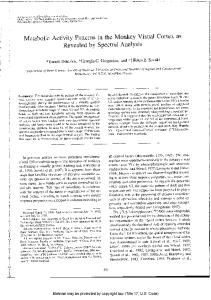
acid requires cells to express genes coding for acid-loading transporters. High activity of these transporters is necessary to preferentially divert extracellular acidity into the stromal compartment. Several members of the SLC4 and SLC26 gene superfamilies code for acid-loading transporters (18, 19). Expression profiling of these genes was performed by whole-genome microarray of myofibroblasts from normal and cancerous colon, and fibroblasts obtained from skin and foreskin (11). The highest expression was detected for SLC4A2 (Fig. 1). Thus, transport by AE2, coded by the SLC4A2 gene, is a candidate for acid loading into fibroblasts and myofibroblasts. Characterizing Fibroblast-Related Cell Lines as Either Myofibroblasts or Fibroblasts. Functional characterization of acid handling was
performed on four commercially available cell lines of fibroblastlike morphology (colorectal carcinoma-derived Hs675.T, intestinal InMyoFib, embryonal colon CCD-112-CoN, and normal skin NHDF-Ad) and compared with the phenotype of two colorectal carcinoma cell lines (HCT116 and HT29) (8, 20). The fibroblast-related lines were categorized as either myofibroblasts or fibroblasts on the basis of recently described markers (11). Expression, measured by reverse transcription–quantitative PCR (RT-qPCR), of the myofibroblast markers AOC3 (Hs675T > CCD-112-CoN > InMyoFib > NHDF-Ad) and NKX2-3 (CCD112-CoN > InMyoFib > Hs.675.T, not detected in NHDF-Ad), and the fibroblast marker SHOX2 (detected only in NHDF-Ad) indicated that Hs675.T, InMyoFib, and CCD-112-CoN are myofibroblast lines, whereas NHDF-Ad was confirmed as a skin
Fig. 1. Expression of SLC4/SCL26 genes in myofibroblasts and fibroblasts. Expression (mRNA level) of members of the SLC4 and SLC26 superfamilies measured by microarray in myofibroblasts from cancerous colon (Myo2020 and Myo2156), CCD-18Co myofibroblast line, myofibroblasts from normal colon (Myo6024 and Myo1998), and foreskin and skin fibroblasts (number refers to volunteer).
Hulikova et al.
PNAS PLUS
fibroblast (Fig. S1A). Analysis of immunofluorescence in nuclear regions of fixed cells (Fig. S1B) supported this cell type classification (SHOX2-positive/NKX2-3–negative NHDF-Ad fibroblasts, and SHOX2-negative/NKX2-3–positive InMyoFib, Hs675.T, and CCD-112-CoN myofibroblasts). In the case of CCD-112-CoN cells, a subpopulation was distinctly less NKX2-3 positive. Compared with CRC Cell Lines, InMyoFib and Hs675.T Myofibroblasts Have High Acid Uptake Capacity and SLC4A2 Expression. In hypoxic
tumors, low pHe is associated with metabolic acidosis (i.e., reduced [HCO3−]) resulting from the chemical titration between lactic acid and HCO3− ions. Thus, the pHi response to a low[HCO3−] superfusate (at constant pCO2) measures the capacity of a cell to absorb H+ ions or their chemical equivalents (e.g., secretion of HCO3−) under conditions relevant to the tumor microenvironment. Uptake of extracellular acid was measured in cocultures of CRC cells and myofibroblasts grown in the presence of serum. Myofibroblasts expressed eGFP for positive identification. An exemplar experiment performed on a coculture of HT29 CRC cells and InMyoFib myofibroblasts is shown in Fig. 2A. Cocultures were loaded with cSNARF1 (a pHi-reporter dye) and superfused in 5% CO2/22 mM HCO3− buffered solution (pH 7.4). Rapid switching to an acidic (pH 6.4) superfusate (containing 2.2 mM HCO3−) evoked a pHi response that was larger and faster in myofibroblasts compared with CRC cells (Fig. 2A). In both cell types, the pHi response was fully reversible. Retention of intracellular cSNARF1 fluorescence during the protocol confirmed that the surface membrane remained intact. Cellular acid uptake was quantified in terms of H+ flux by multiplying the initial rate of pHi change (calculated by best fit of pHi response to exponential curve) and buffering capacity (measured in separate experiments; Fig. S2). Acid uptake was an order of magnitude faster in InMyoFib cells compared with HT29 cells. Thus, in a solid tumor, extracellular acid would be absorbed preferentially into the highly buffered myofibroblast compartment. H+-monocarboxylate transporters, expressed in many tissues, can carry a lactate-coupled H+ flux. According to the “lactate shuttle” hypothesis (21, 22), stromal cells express MCT4 whereas cancer cells express MCT1, and this juxtaposition is proposed to transfer lactate and H + ions from the stroma to the cancer compartment. NHDF-Ad and InMyoFib cells express higher levels of MCT4 protein compared with MCT1 (Fig. S3), consistent with lactate being exported. Thus, the acid handling by stromal cells described above (operating in the absence of extracellular lactate) is unlikely to involve MCTs. In the absence of CO2/HCO3− (substituted with Hepes buffer), the pHi response was considerably reduced in InMyoFib cells, but unchanged in CRC cells. This result indicates that the myofibroblast transport mechanism has a preference for HCO3− over OH− (Fig. 2Bi). Acid uptake into InMyoFib myofibroblasts was reduced in the presence of 4,4′-diisothiocyano-2,2′-stilbenedisulfonic acid (DIDS) at 300 μM, a broad-spectrum inhibitor of HCO3− transport (18, 23, 24) (Fig. 2Bii). Replacing superfusate [Na+] with [K+] (140 mM), which depolarizes membranes and depletes intracellular Na+, did not affect acid uptake, suggesting an electroneutral and Na+-independent mechanism (Fig. 2Bii). The extent of acid loading was greatly reduced in Cl−-free solutions (Fig. 2Bii). The organic anion transport inhibitor probenecid (1 mM) and the gap junction inhibitor carbenoxolone (CBX) (100 μM) had no effect on acid loading into InMyoFib myofibroblasts (Fig. S4). Collectively, these observations are characteristic of the Cl−/HCO3− anion exchangers belonging to the SLC4 and SLC26 superfamilies of transporters (18, 19). Measurements of acid uptake were repeated on two additional myofibroblast lines (Hs675.T, CCD-112-CoN), a fibroblast line (NHDF-Ad), and another CRC line (HCT116), all grown in the presence of serum. The kinetics of the pHi response to extracellular acidification (pH 7.4 to 6.4) fell into two groups: “fast” in InMyoFib and Hs675.T myofibroblasts, and “slow” in NHDF-Ad PNAS | Published online August 19, 2016 | E5345
PHYSIOLOGY
junction-forming protein that couples cells into a syncytium. Additionally, stroma cells contain diffusible pH buffers for carrying H+ ions across this syncytium. The combined activity of these molecules allows the stroma to absorb extracellular acidity and transmit this acid load across the highly buffered syncytial volume. In some stromal cells with lower AE2 and Cx43 basal function, flux through this pathway is stimulated with transforming growth factor β1 (TGFβ1) (15), a cytokine involved in cancer–stroma interactions (16, 17). The stroma may thus provide a major route for venting tumor acidity.
fibroblasts, CCD-112-CoN myofibroblasts, and CRC lines (Fig. 2C). To further characterize the acid uptake process, fluxes were measured in response to a more modest acidification (pH 6.8 attained with 5.5 mM HCO3−). Additionally, the HCO3− dependence of flux was established by repeating experiments in the absence of CO2/HCO3−. An exemplar analysis for Hs675.T cells is shown in Fig. 2Di. The slope of the near-linear relationship between pHe and the acid uptake flux (Fig. 2Di) provides a measure of the rate of H+-equivalent uptake per unit of pHe disturbance, normalized to cell volume (units of mmol/l/min pHe unit). This acid uptake parameter (herein given symbol α) was highest in Hs675.T and InMyoFib myofibroblasts, compared with CCD-112-CoN myofibroblasts, NHDF-Ad fibroblasts, and the CRC cells (Fig. 2Dii). The expression profiling shown in Fig. 1 highlighted SLC4A2 as a candidate gene coding for an acid-loading transporter in myofibroblasts and fibroblasts. In agreement with this finding, the protein product of SLC4A2, AE2, was confirmed by immunoblot in InMyoFib, Hs675.T, NHDF-Ad, and CCD-112-CoN cells, but was absent in CRCs (Fig. 2E). AE2 levels correlated with α-smooth muscle actin (αSMA), a highly expressed protein
in fibroblasts and myofibroblasts. In fibroblast-related cells, AE2 expression levels were in agreement with acid uptake fluxes (Fig. 2Dii). The AE2-immunopositive band (∼140 kDa) is of lower molecular weight than predicted for a fully glycosylated AE2a/ AE2b protein (∼170 kDa). Early studies have argued that this lower band represents AE2 retained in the Golgi apparatus (25), but more recent findings have concluded that targeting mechanisms vary between different types of cell and do not depend strictly on sequence-specific sorting motifs (26). In the fibroblastrelated cells selected for this study, there was no immunofluorescence evidence for AE2 retention in the Golgi apparatus of permeabilized cells (Fig. S5 A–D). As a control, AE2 immunoreactivity was absent in fixed HCT116 and HT29 monolayers (Fig. S5 E and F). To test whether the absence of AE2 immunoreactivity in HT29 and HCT116 is representative of low SLC4A2 expression in CRCs, microarray data for a panel of 92 CRC lines was analyzed. There was only a 3.5-fold difference in SLC4A2 message between CRC lines at the 10th and 90th percentiles. SLC4A2 message in HCT116 and HT29 cells was 1.1- and 1.4-fold of the median value, respectively, arguing that
Fig. 2. Characterizing acid uptake into fibroblastrelated cells and CRC cells. (A) Coculture of HT29 CRC cells and InMyoFib myofibroblasts (latter expressing eGFP for identification). Monolayer superfused in CO2/ HCO3−-buffered media and imaged for pHi using cSNARF1. Extracellular acidity imposed by switching from 5% CO2/22 mM HCO3− (pH 7.4) to 5% CO2/ 2.2 mM HCO3− (pH 6.4) superfusate. Acid uptake was faster and greater into the myofibroblasts. (Bi) Experiments repeated in the absence of CO2/HCO3− (Hepesbuffered solutions). Dotted lines show recordings in the presence of CO2/HCO3−. (ii) Initial H+ influx was reduced by treatment with DIDS (300 μM), removal of CO2/HCO3−, replacing Cl− with gluconate, but not by replacing Na+ with 140 mM K+. Mean ± SEM of 35–45 myofibroblasts, repeated four times. (C) Comparison of the pHi response to extracellular acidity in four fibroblast-related lines and two CRC lines. Mean from 200– 300 CRCs or 10–50 fibroblasts per plating, repeated three to five times; SEMs not shown for clarity. (Di) Initial H+ influx measured as a function of extracellular pH, in the presence (filled symbols) or absence (open symbols) of CO2/HCO3−. Analysis shown for Hs675.T myofibroblasts; parameter α is defined as the slope of the pH-flux relationship. (ii) Parameter α for the six cell lines studied. (E) Immunoblot for AE2, α-smooth muscle actin (α-SMA), and loading controls (actin and tubulin). (F) Knockdown in NHDF-Ad fibroblasts: shRNA constructs (#1 to #4), pooled constructs, scrambled (Scr) construct, and untreated wild type (WT). Vectors also contained eGFP gene. (G) cSNARF1-loaded (i) NHDF-Ad and (ii) InMyoFib monolayers, showing eGFP-positive cells among wild-type cells (cSNARF fluorescence only; red). (H) Acid-loading protocol performed on NHDF-Ad cells in the presence of 5% CO2/HCO3−. Mean ± SEM of 37 SLC4A2 knockdown (KD) and 48 scrambled shRNA cells from four platings. (I) Acid-loading protocol repeated in InMyoFib myofibroblasts. Dotted lines show level of acid loading in CRCs (mean of HT29 and HCT116 data, offset to common starting pHi). Mean ± SEM of 19 SLC4A2 knockdown cells and 57 scrambled shRNA cells from four platings.
E5346 | www.pnas.org/cgi/doi/10.1073/pnas.1610954113
Hulikova et al.
Stimulation with TGFβ1 Increases Acid Uptake into Fibroblast-Related Cells That Have Lower Baseline Activity. Cancer cells can influence
the phenotype of stromal cells by factors such as the cytokine TGFβ1 (15–17). The protocols described above were performed to investigate the effect of TGFβ1 on acid handling by myofibroblasts, fibroblasts, and CRC cells. Cells were serum deprived and then grown in low-serum or serum-free conditions with recombinant TGFβ1 (6 ng/mL) for 48 h, and time-matched control experiments were performed in the absence of TGFβ1. Sensitivity to TGFβ1 was assayed in terms of SMAD2 phosphorylation (pSMAD2) at
Fig. 3. Acid uptake in CCD-112-CoN myofibroblasts and NHDF-Ad fibroblasts is increased by TGFβ1 signaling. (A) Immunoblot showing the effect of TGFβ1 on SMAD2 phosphorylation at S465/S467 (p-SMAD2) and total SMAD2 levels. (Bi) Acid uptake into NHDFAd fibroblasts, calculated from pHi response to extracellular acidosis. Cells were incubated in serum-free medium, in the presence or absence of recombinant TGFβ1. Mean ± SEM of 60–80 cells, repeated six times for each condition. (ii) Acid-loading experiment repeated on SLC4A2 knockdown NHDF-Ad fibroblasts, showing reduced response to TGFβ1. Mean ± SEM of 20–30 GFP-positive cells, repeated four times for each condition. (C) Summary of the effect of TGFβ1 on acid uptake into wild-type cells. Mean ± SEM of 10–50 myofibroblasts or 200–300 CRCs, repeated three to seven times. [The asterisk (*) denotes significant different (P < 0.05) between control and treatment, measured in the presence of CO2/HCO3− buffer.] (D) Immunoblot showing effect of TGFβ1 stimulation on total AE2 expression. TGFβ1 treatment also increased the expression of α-smooth muscle actin (αSMA), a known downstream target, in NHDF-Ad and CCD-112-CoN cells. (E) Densitometric quantification of total AE2 levels, determined by immunoblot. Mean ± SEM from three experiments. (F ) In TGFβ1treated cells, H+ influx was inhibited by DIDS (300 μM) and was reduced in the absence of CO2/HCO3−. Mean ± SEM of 10–50 myofibroblasts or 200–300 CRCs, repeated three times for each condition.
Hulikova et al.
PNAS PLUS
brought acid-loading rates to levels measured in CRCs (Fig. 2I). Thus, AE2 expression in wild-type myofibroblasts is related to their ability to absorb extracellular acid preferentially over CRC cells. Cells with a more powerful acid uptake mechanism are also expected to attain a more acidic steady-state pHi when presented with a sustained extracellular acid challenge. The steady-state pHe–pHi relationship (Fig. S7) was steep and linear in InMyoFib and Hs675.T myofibroblasts, curvilinear in CCD-112-CoN myofibroblasts and NHDF-Ad fibroblasts, but shallow in CRCs. Thus, the pHi of CRCs is relatively insensitive to pHe changes, whereas the pHi of Hs675.T and InMyoFib myofibroblasts was highly responsive to pHe disturbances. These phenotypes are consistent with the magnitude of acid-loading fluxes (Fig. 2E).
PNAS | Published online August 19, 2016 | E5347
PHYSIOLOGY
these lines are not outliers among CRCs (Fig. S6A). There was no significant difference in SLC4A2 expression between replication error (RER)-positive lines and RER-negative lines (P = 0.18). Thus, low SLC4A2 expression, and hence AE2 activity, is expected to be typical of CRC epithelial cells. SLC4A2 knockdown was performed to confirm AE2 as a major stromal acid-loading mechanism. shRNA constructs, also containing the gene for eGFP, were lentivirally delivered to NHDF-Ad and InMyoFib cells (scrambled construct used as a control). AE2 expression (∼140-kDa band) was reduced by knockdown, as shown for NHDF-Ad cells in Fig. 2F. eGFP immunoreactivity, which measures the yield of infection and genomic integration, was constructdependent. To study the effect of SLC4A2 knockdown on acid uptake, pHi measurements were analyzed in eGFP fluorescent cells [Fig. 2G; note that eGFP, excited at 488 nm, and cSNARF1, excited at 555 nm, do not overlap spectrally]. The shRNA construct with the greatest knockdown efficacy halved acid loading in NHDF-Ad fibroblasts (Fig. 2H) and InMyoFib myofibroblasts (Fig. 2I), relative to scrambled controls, bringing activities close to the rates measured in the presence of 300 μM DIDS (Fig. 2B). The remaining acid-loading flux is due to a combination of incomplete SLC4A2 knockdown and the activity of other acid–base transporters that collectively produce a “basal” level of acid loading, also observed in CRC cells. Indeed, SLC4A2 knockdown in InMyoFib myofibroblasts
S465/S467, a downstream reporter of TGFβ1 signaling (Fig. 3A). Under TGFβ1 stimulation, the pSMAD2/SMAD2 ratio increased sixfold in Hs675.T and NHDF-Ad cells, fourfold in InMyoFib cells, approximately threefold in CCD-112-CoN cells, twofold in HCT116, and was unchanged in HT29 cells. Thus, the fibroblastlike cells show robust TGFβ1 responses, whereas HCT116 cells show only a weak response and HT29 are essentially TGFβ1-insensitive. Refractoriness to TGFβ1 is commonly observed in CRC cells, and is consistent with mutations in the type II TGFβ1 receptor in HCT116 cells and other RER-positive lines, and SMAD4 mutations described in HT29 cells (17, 27, 28). Treatment with TGFβ1 increased acid uptake into NHDF-Ad fibroblasts (Fig. 3Bi) and CCD-112-CoN myofibroblasts, but not in InMyoFib and Hs675.T myofibroblasts, where flux was already high in serum-free conditions (Fig. 3C). The stimulatory effect of TGFβ1 on acid uptake into CCD-112-CoN and NHDF-Ad cells was not associated with a change in cell dimensions (Fig. S8 A and B) but, instead, correlated with an increase in the total level of AE2 protein (SLC4A2 product) measured by immunoblot near ∼140 kDa (Fig. 3 D and E). In SLC4A2 knockdown NHDF-Ad cells (construct 2 in Fig. 2F), the effect of TGFβ1 on acid loading was greatly reduced (Fig. 3Bii), confirming the involvement of AE2 in this pHi response. Since the acid-loading protocol measures the activity of transporters at the cell surface, the TGFβ1 effect on wild-type cells relates to an increase in plasmalemmal AE2 activity. In Hs675.T myofibroblasts, a heavier AE2-positive band became apparent with TGFβ1 treatment, but this did not correlate with a change in activity, indicating that the ∼140-kDa band relates better to the functional read-out. Acid uptake rates in HCT116 and HT29 cells remained low even after TGFβ1 treatment. Consistent with this, TGFβ1 did not induce SLC4A2 expression in the CRC cells. DIDS (300 μM) greatly reduced acid uptake (quantified as parameter α) in TGFβ1-treated stromal cells but had no inhibitory effect on acid loading in CRC cells (Fig. 3F). In summary, TGFβ1 signaling stimulates acid uptake activity in fibroblast-like cells that have lower baseline fluxes; in contrast, CRCs are refractory. Cell-to-Cell Transmission of Acid Through Gap Junctions Is High Between Fibroblast-Related Cells but Absent in CRC Cells. The cytoplasm of an
individual cell is a finite reservoir for H+ ions that will, eventually, become saturated under a sustained extracellular acid load. However, cells of a tissue can be coupled to produce a syncytium for transmitting small solutes over long distances (e.g., from hypoxic to well-perfused regions). Such coupling may provide a viable route for carrying acid away from regions of metabolic production in lieu of adequate vasculature. Diffusive coupling between cells was measured in confluent monolayers, loaded with the fluorescent marker calcein, in terms of the rate of fluorescence recovery following bleaching in a region of interest (ROI) wholly inside a central cell. Fig. 4A shows an example time course of fluorescence recovery after photobleaching (FRAP) in a CCD-112-CoN myofibroblast; fluorescence recovery was blocked fully by the gap junction inhibitor CBX (100 μM). By best fitting to an exponential curve, the recovery time course yields a coupling constant κ, proportional to cell-to-cell calcein permeability (Materials and Methods). κ was high and CBXsensitive in all four stromal cell lines, thus demonstrating strong cell– cell coupling via gap junctions (Fig. 4Bi). This activity was substantially greater than in HEK293.T cells, a positive control for epithelial coupling. In contrast, HCT116 and HT29 CRC cells had negligible coupling. Previous studies have demonstrated an acute effect of pHi on cell-to-cell coupling (29, 30). To test whether acidification uncouples the stromal syncytium, FRAP experiments were repeated on NHDF-Ad and InMyoFib monolayers equilibrated (>10 min) with acidic media. Under this protocol, both pHe and pHi are reduced, but strong coupling persisted in both stromal cell types (Fig. 4Bii). Thus, gap junctions remain open when cells are presented with an extracellular acid challenge. E5348 | www.pnas.org/cgi/doi/10.1073/pnas.1610954113
The highly buffered milieu inside cells hinders the movement of free H+ ions; therefore, the transmission of acid between cells relies on H+ ions being chaperoned aboard mobile (diffusible) H+ buffers (29, 31). These buffers include CO2/HCO3− and “intrinsic” molecules, such as amino acids, peptides, and phosphates. CO2/HCO3− is present in all cells because CO2 equilibrates across membranes rapidly (32), but its efficacy as a mobile buffer is restricted by low cytoplasmic carbonic anhydrase activity in fibroblast-related cells (33) (Fig. S3). In contrast, the reaction kinetics of intrinsic buffers are rapid (34), but their concentration in fibroblast-related cells is not known. To assay the content of intrinsic buffers, cytoplasmic H+ diffusivity was measured in sparsely cultured cells loaded with cSNARF1 and superfused with CO2/HCO3− -free (Hepes-buffered) solution. Superfusates also included 0.5 mM 6-nitroveratraldehyde (NVA), a membrane-permeant photolabile caged H+ compound that releases acid upon exposure to UV light (35) (0.5 mM NVA or its photolytic product do not cause abnormal changes in cell morphology, such as blebbing or loss of membrane integrity; Fig. S9). A point-source of acid was produced by alternating between whole-field imaging for pHi (cSNARF1 fluorescence) and UV excitation in a small ROI to uncage H+ ions (34) (exposure to UV light in the absence of NVA does not acidify cells; Fig. S9). Dissipation of acid away from the photolysis site was quantified in terms of a cytoplasmic diffusion coefficient (Dcyto) by best-fitting [H+] time courses (Fig. 4Ci) to a diffusion algorithm (Materials and Methods). Intrinsic Dcyto, plotted in Fig. 4Cii, demonstrates adequate mobile buffering, which was higher in fibroblast-related cells compared to CRC cells. Transmission of acid between cells is the product of gapjunctional conductance and mobile buffering capacity. This was measured by NVA photolysis in confluent monolayers in the presence or absence of CO2/HCO3−. H+ ions were uncaged in a central cell and their spread into neighboring cells provided a measure of H+ diffusivity through the syncytial tissue (Dtiss). An example of this experiment in an NHDF-Ad monolayer superfused with CO2/HCO3−-buffered solution is shown in Fig. 4Di. Acid transmission was blocked with 100 μM CBX, confirming a junctional route (Fig. S10A). The alternative, parajunctional route would involve an extracellular intermediate step, but the involvement of this can be excluded on the basis that superfusion promptly clears extracellular acidity before it could acidify neighboring cells. Arguing against a parajunctional route, the Na+/H+ inhibitor dimethylamiloride and the HCO3− transport inhibitor DIDS did not affect cell-to-cell acid transmission (Fig. S10B). Dtiss was high in fibroblast-related lines, but negligible in CRC monolayers (Fig. 4Dii), in agreement with FRAP data (Fig. 4B). The spacing between the geometrical centers of cells is a measure of how far apart their gap junctions are. These distances were longer in fibroblast-related cells, compared to CRC cells (Fig. 4E), but this cannot explain the observed differences in Dtiss. No significant difference in Dtiss was observed in the presence or absence of CO2/HCO3−. The apparent ineffectiveness of CO2/HCO3− in transmitting H+ ions between cells is likely to relate to low cytoplasmic carbonic anhydrase activity (33). As a result, H+ ions are preferentially shuttled by rapidly reacting intrinsic buffers, a mechanism that is equally active in the presence or absence of CO2/HCO3−. Gap junctions are made of connexin proteins, including Cx26, Cx43, and Cx45, which produce high-conductance gap junctions in many different types of tissues (36). Myofibroblasts, fibroblasts, and CRC cells were tested for expression of Cx26, Cx43, and Cx45 protein by immunoblot (Fig. 4F). The functional data (Fig. 4B) correlated best with Cx43 expression. Levels of Cx45 protein in stromal cells were substantially lower than Cx43. Weak Cx45 immunoreactivity was present in CRCs, but the absence of functional coupling in CRCs indicates that these levels are inadequate to meaningfully facilitate H+ transfer between cells. Cx26 was absent in the cell lines studied. Microarray data for Hulikova et al.
PNAS PLUS
92 CRC lines showed that 72 lines including HCT116 and HT29 have very low GJA1 message (coding for Cx43 protein) (Fig. S6B). Weak or absent cell-to-cell diffusive coupling by Cx43 is therefore predicted for a majority of CRC lines. TGFβ1 Stimulation Increases Gap-Junctional Acid Transmission Between Cells That Also Respond with an Increase in Acid Uptake.
Cell-to-cell diffusive coupling and acid transmission were measured in cells that were first serum deprived and then cultured in serum-free/low-serum conditions in the presence or absence of recombinant TGFβ1 (6 ng/mL). TGFβ1 increased coupling κ, measured by FRAP, in NHDF-Ad and CCD-112CoN cells, but did not affect coupling in Hs675.T or InMyoFib myofibroblasts. Confluent CRC monolayers remained uncoupled even after TGFβ1 treatment (Fig. 5A). TGFβ1 did not affect intrinsic mobile H+ buffering, quantified in terms of the cytoplasmic H+ diffusion coefficient (Dcyto; Fig. 5B). In agreement with a strengthening of coupling κ, TGFβ1 increased cell-to-cell acid transmission (Dtiss) measured by photolytic H+ uncaging in NHDF-Ad (Fig. 5C) and CCD-112-CoN cells, but did not affect Hulikova et al.
acid transmission between CRCs (where it was absent) or the other myofibroblasts (where basal activity was already high; Fig. 5D). Comparable values of Dtiss were obtained in the presence and absence of CO2/HCO3− (Fig. 5D), in agreement with findings shown in Fig. 4D. The effect of TGFβ1 on acid transmission between fibroblasts was not due to a change in the spacing between geometrical centers of coupled cells (Fig. S8C). Immunoblotting for Cx43 demonstrated a TGFβ1-evoked change in the intensity of Cx43-specific bands representing a range of posttranslational states (Fig. 5Ei). Previous studies (37, 38) have demonstrated that Cx43 activity is related to Cx43 phosphorylation state, which can be quantified in terms of the ratio of the upper bands (referred to in the literature as P1 and P2) to the total signal of all Cx43immunopositive bands. In NHDF-Ad cells, treatment with TGFβ1 increased the relative intensity of the upper Cx43 band by 2.3 ± 0.55-fold (from 15% to 32% of total signal; P = 0.003; Fig. 5Eii). No consistent TGFβ1-related change in Cx45 expression was observed (Fig. 5Ei). In summary, TGFβ1 stimulation can increase cell-to-cell coupling between fibroblast-like cells, but not between CRC cells. PNAS | Published online August 19, 2016 | E5349
PHYSIOLOGY
Fig. 4. Characterizing cell-to-cell diffusive coupling and acid transmission. (A) Fluorescence recovery after photobleaching (FRAP) protocol in calcein-loaded NHDF-Ad monolayers. (Bi) Coupling in six cell lines measured from the rate constant of FRAP. Mean ± SEM of 15–60 myofibroblasts or 200–400 CRCs, repeated eight times for each condition (control and CBX). (ii) Coupling constant κ measurements in NHDF-Ad (black circles) and InMyoFib (green triangles) cells that had been preequilibrated (>10 min) in Hepes-buffered media at pH 7.4, 6.8, and 6.4 (results normalized to measurements at pH 7.4). Numbers in brackets indicate steady-state pHi determined in parallel experiments. Mean ± SEM of 15–60 myofibroblasts. (Ci) Uncaging H+ ions photolytically (from 6-nitroveratraldehyde) by 405-nm laser in one end of an NHDF-Ad fibroblast, superfused in Hepes-buffered media (pH 7.4). Spread of acid to distal end provides measure of intrinsic H+ ion diffusivity in cytoplasm. (ii) Intrinsic H+ ion diffusivity in six cell lines is a readout of intrinsic mobile buffer content. Mean ± SEM from 7–16 cells for each cell line. (Di) Uncaging H+ ions photolytically in a central cell of an NHDF-Ad monolayer superfused with CO2/HCO3−-buffered solution. Transmission of acid into neighboring cells provides a measure of H+ ion diffusivity between cells. (ii) H+ ion diffusivity across monolayers was similar in the absence and presence of CO2/HCO3−, and correlated with FRAP data (calcein permeability). Mean ± SEM of 15–60 myofibroblasts or 200–400 CRCs, repeated 5–10 times for each condition. (E) Black histograms: mean distance between the geometrical centers of cells in a monolayer. Gray histograms: cell volume measured by flow cytometry in dissociated cells. Mean ± SEM. (F) Immunoblot for Cx43, Cx26, Cx45, loading controls (actin and tubulin), and α-smooth muscle actin (αSMA).
Fig. 5. Cell-to-cell diffusive coupling in CCD-112CoN myofibroblasts and NHDF-Ad fibroblasts is increased by TGFβ1. (A) Fluorescence recovery after photobleaching (FRAP) protocol in calcein-loaded NHDF-Ad monolayers. Fibroblasts were incubated in serum (FCS)-free conditions in the presence or absence of TGFβ1. Mean ± SEM of 15–60 myofibroblasts or 200–400 CRCs; measurement repeated 6–11 times for TGFβ1 and 6–13 times for low-serum condition. (B) Cytoplasmic H+ ion diffusivity measured by photolytic H+ ion uncaging in Hepes-buffered superfusates. Cells were incubated in serum-free conditions, in the presence or absence of TGFβ1. Mean ± SEM of 15–60 myofibroblasts or 200–400 CRCs, repeated 8–12 times for each condition. (C) H+ ion diffusivity across monolayer of NHDF-Ad cells, measured by photolytic H+ ion uncaging in CO2/ HCO3−-buffered superfusates. Measurements on (i) cells incubated in serum-free conditions and (ii) cells incubated in serum-free conditions containing TGFβ1. (D) H+ ion diffusivity across monolayers of NHDF-Ad and CCD-112-CoN fibroblasts was increased by TGFβ1. Mean ± SEM of 15–60 myofibroblasts or 200–400 CRCs, repeated for 8–12 times for each condition. (Ei) Immunoblot showing effect of TGFβ1 on Cx43 protein. (ii ) Densitometric quantification of the Cx43 upper band relative to the total signal. [The asterisk (*) denotes significant difference; P = 0.003.] Mean ± SEM of three experiments.
Discussion Metabolism by CRC cells releases large amounts of acid into the extracellular tumor microenvironment (39), which must be cleared efficiently. The findings of this study propose a role for the tumor stroma as a high-capacity reservoir for absorbing and transporting acid. The stromal compartment absorbs excess extracellular acidity by means of AE2 activity, the product of the SLC4A2 gene. Essentially all cells undergo some degree of acid loading when bathed in acidic media through the combined activity of many different acid–base transporters, but our results demonstrate that high SLC4A2 expression gives stromal cells a competitive advantage over CRCs in absorbing tumor acidity. This effect resembles competition for a common substrate (in this case, acid): the compartment with the highest acid uptake rate will absorb the greatest share of extracellular acidity. The capacity of a stromal cell to take up acid is enhanced by cell-to-cell coupling, which dissipates H + ions across the syncytial volume. Coupling is attained by gap junctions formed by connexins, such as Cx43 (product of GJA1). The diffusive transport of H+ ions through gap junctions and across the syncytium is facilitated by mobile buffers (29), which are present in stromal cytoplasm. Because stromal cytoplasmic carbonic anhydrase activity is low (33), the majority of H+ traffic is carried aboard membrane-impermeant (intrinsic) buffers rather than by membrane-permeant CO2/HCO3−, and is consequently routed through the syncytial cytoplasm. Collectively, E5350 | www.pnas.org/cgi/doi/10.1073/pnas.1610954113
the stroma has the acid-handling apparatus necessary for establishing an acid-venting route that is an alternative to the tortuous extracellular space (40–42). In contrast, CRC cells, with low acid uptake rate and absence of gap-junctional coupling, are unable to vent acidity this way. As a result, the stromal syncytium, but not CRC cells, is able to conduct a transcellular flow of acid. The model of stromal acid handling was inferred from measurements in two CRC cell lines (HT29 and HCT116) and a panel of fibroblast-related cell lines (colonic Hs675.T, colonic CCD-112-CoN, intestinal InMyoFib, and skin NHDF-Ad), and further supported by gene expression studies on a wider panel of CRC cells, myofibroblasts, and fibroblasts (Fig. 1 and Fig. S6). Using recently validated markers (11), Hs675.T, CCD-112-CoN, and InMyoFib were identified as myofibroblasts, whereas NHDF-Ad was confirmed as a skin fibroblast cell line (Fig. S1). Microarray analysis of primary colonic myofibroblasts and skin fibroblasts confirmed that SLC4A2 is the most highly expressed gene among candidates for acid-loading transporters of the SLC4 and SLC26 superfamilies (Fig. 1). All four fibroblast-related cell lines were positive for AE2 (product of the SLC4A2 gene), which correlated with αSMA expression (Fig. 2E). Previous studies have found stromal αSMA expression to have prognostic value (12, 43, 44), and we speculate that higher AE2 levels in these cells may be beneficial in terms of acid handling. Hs675.T and InMyoFib myofibroblasts had the highest AE2 protein levels and Hulikova et al.
Fig. 6. Role of the myofibroblast syncytium in absorbing and transporting acid. (A) Myofibroblasts produce a syncytial cytoplasmic volume by means of gap-junctional coupling (GJs). Acid uptake (Up) across the cell membrane loads the myofibroblasts syncytium with acid, produced primarily by cancer cell metabolism. The transmyofibroblast route is an alternative pathway for removing acid, in parallel to the extracellular route. (B) Mathematical model of pH in tumor compartments consisting of extracellular space, myofibroblasts (MFs), and colorectal cancer (CRC) cells. See Supporting Information for further details. (i) Extracellular pH and (ii) cancer cell pH modeled as a function of tumor depth. Cancer cell metabolic rate set as 4 mmol H+·L−1·min−1, and 10-fold lower for myofibroblasts. Volume fraction of myofibroblasts was varied to show the effect of stromal acid handling on steady-state pH. Effect of cancer cell metabolic rate on the (iii) extracellular pH and (iv) cancer cell pH at the hypoxic region of the tumor.
Hulikova et al.
PNAS | Published online August 19, 2016 | E5351
PNAS PLUS
This behavior resembles the response of normal skin NHDF-Ad fibroblasts (Fig. 3). The acid-loading response to TGFβ1 was substantially reduced in SLC4A2 knockdown fibroblasts, which argues for the involvement of plasmalemmal AE2 activity in the TGFβ1 response observed in wild-type cells (Fig. 3Bii). It is noteworthy that among the myofibroblasts, CCD-112-CoN cells showed the greatest variability in expression of the myofibroblast marker NKX2-3, which may relate to differences in acid handling between CCD-112-CoN cells and the other two myofibroblast lines. HT29 and HCT116 lines have been used extensively in many previous studies of CRC (45). These lines were selected for this investigation because their pHi regulation is well characterized (8, 20) and their TGFβ1 sensitivity is ablated, but for different reasons. AE2 protein was not detected in HCT116 and HT29 cells, in agreement with their low acid uptake rates and shallow pHe–pHi relationship. Thus, CRC cells absorb acidity slowly and to a limited extent, such that their steady-state pHi is relatively insensitive to fluctuations in microenvironment pHe (Fig. S7). A microarray of 92 CRC lines confirmed that, in terms of SLC4A2 message, HCT116 and HT29 were not outliers; thus, low AE2 activity may be considered typical of CRC cells (Fig. S6A). Treatment with TGFβ1 did not affect acid loading into HT29 and HCT116 (Fig. 5), which is consistent with the observations that CRC lines have reduced sensitivity to TGFβ1 (17) as a result of genetic changes, such as mutations in the TGFβ1RII receptor (associated with RER-positive lines such as HCT116) or SMAD4 (e.g., in HT29 cells) (27, 28). Indeed, refractoriness to TGFβ1 is a feature of many human colorectal tumors (17, 46–48), and several other CRC lines (e.g., LS180, Lovo, SW480, SW949, and CaCo2) are even less responsive to TGFβ1 compared to HCT116 and HT29 cells (17). These observations suggest that the absence of TGFβ1-evoked SLC4A2 expression may be a more general CRC phenomenon. All four fibroblast-related cells were capable of producing a well-coupled syncytium that can conduct a flow of acid between cells. The appearance of acid in neighboring cells during a localized, UV-controlled release of acid in a central cell indicates that the transfer of H + ions takes place via channels, such as gap junctions assembled from connexins including Cx43 (product of GJA1). Passage through the extracellular space can be excluded because the monolayers were under superfusion and any acid ejected from a “source” cell would be washed away before it could be captured by neighboring cells. A junctional mechanism is also supported by CBX sensitivity (Fig. S10A), insensitivity to inhibitors of acid–base transporters (Fig. S10B), and the observation that calcein, a relatively large molecule (0.6 kDa), is able to permeate (Fig. 4). The fibroblast-related cells that responded to TGFβ1 by raising SLC4A2 expression and acid uptake activity (i.e., CCD112-CoN and NHDF-Ad) also increased their cell-to-cell coupling in a bid to ensure that these two fluxes are closely matched (Fig. 5). A likely mechanism for increased coupling is a change in the phosphorylation state of Cx43 (Fig. 5E), a well-documented posttranslational modification affecting Cx43 activity (37, 38). Confluent HCT116 and HT29 monolayers, in contrast, did not form such a coupled volume and were Cx43 negative, even under TGFβ1 stimulation (Figs. 4 and 5). Microarray analysis of 92 CRC lines demonstrated that low GJA1 message was found in the majority of cases (Fig. S6B). Thus, only the tumor stroma is capable of transmitting cytoplasmic H+ ions over longer distances. Because the stromal volume is large and rich in mobile H+ carriers, it may produce a viable route for siphoning acid in lieu of adequate vasculature. The measurements presented in this study have characterized the individual elements of acid handling in stromal cells. A computational model was used to investigate how these elements may work together in producing a route for acid venting. The threecompartment model (stromal, cancer, and extracellular space) included variables describing compartment size, metabolic rate,
PHYSIOLOGY
very high acid uptake activity (Fig. 2), which persisted in the absence of serum and were unaffected by TGFβ1 treatment (Fig. 3). The magnitude of acid uptake into myofibroblast is substantial, reaching levels of several tens of millimoles per liter per minute. The HCO3− dependence of this flux indicates that the process involves secretion of HCO3− ions into the extracellular space for titrating H+ ions. SLC4A2 knockdown in InMyoFib myofibroblasts reduced acid uptake activity to the same level as in CRC cells, confirming that AE2 expression is related to the propensity of the stroma to absorb acid (Fig. 2I). Because the stromal uptake of extracellular acid must occur across the plasma membrane, a population of surface-expressed AE2 protein underlies the measured activity in wild-type cells. Furthermore, the pHe–pHi relationship in myofibroblasts was steep, indicating that acid uptake is highly responsive to changes in pHe (Fig. S7). The acid uptake process is fully reversible (Fig. 2A); therefore, the stromal syncytium would release its acid load into a well-perfused microenvironment of pHe closer to 7.4. CCD-112-CoN myofibroblasts, in contrast to InMyoFib and Hs675.T cells, had lower AE2 expression and acid uptake activity, but these were raised by TGFβ1 signaling (Fig. 3).
acid uptake rate, and cell-to-cell acid transmission (Fig. 6A; the equations are given in Supporting Information and model parameters are listed in Table S1). Using the experimental data obtained herein, the model simulated the effect on compartment pH of including a myofibroblast syncytium among cancer cells. The cancer cell-to-myofibroblast ratio and geometry of the model tissue can be set to a level relevant to solid tumors in vivo. For a tumor that is 30% extracellular fluid of tortuosity that reduces diffusivity 10-fold (40–42), with an intracellular tortuosity of 2-fold (49), of a capillary-to-core distance of 300 μm (i.e., beyond the O2 diffusion distance), and a metabolic rate that is an order of magnitude higher in CRCs compared to myofibroblasts, steady-state pHe and cancer cell pHi reach acidic levels at the tissue core (Fig. 6 Bi and Bii; here simulated for a cancer cell metabolic rate of 4 mmol H+·L−1·min−1). Increasing the myofibroblast-to-cancer cell ratio produced less acidic pH levels. Consequently, incorporating myofibroblasts into the tumor mass would allow cancer metabolism to operate at a higher rate, without excessively acidifying the immediate milieu (Fig. 6 Biii and Biv). In summary, simulations based wholly on experimental data support the proposal of an acid-absorbing myofibroblast syncytium that is capable of transporting acid. The molecules implicated in stromal acid handling (acidloading AE2 protein, acid-conducting Cx43 channels, and H+-carrying intrinsic mobile buffers) are potential targets for influencing tumor pH. These molecules have not been recognized thus far because our understanding of tumor pH regulation has been based mostly on acid extrusion processes measured in cancer cell monoculture. Although DIDS and CBX block AE2 and Cx43, respectively, these drugs have off-target effects and systemic toxicity in vivo. As shown for CCD-112-CoN myofibroblasts and NHDF-Ad fibroblasts, the activity of AE2 and Cx43 is sensitive to TGFβ1 stimulation, and this may provide an alternative means for manipulating the stromal acid-handling process via modulators of TGFβ1 signaling. It is noteworthy that commercially available culture sera can contain significant amounts of TGFβ1 (11), which may affect acid-handling measurements under conditions assumed to be basal. To summarize, we propose that in solid tumors the stromal route for venting acid may be significant in lieu of adequate vasculature. By acting as pHe-gated acid reservoirs, myofibroblasts may also be critical in dampening the amplitude of transient acid/base challenges that coincide with fluctuations in blood flow (50). Materials and Methods Gene Expression Analysis. Total RNA from cells was extracted using the RNeasy kit (Qiagen) according to the manufacturer’s instructions. All samples were processed in accordance with the Affymetrix protocol, and 2 μg of fragmented and labeled cDNA was hybridized to the Affymetrix GeneChip U133+2 arrays. Partek Genomic suite software was used to compare expression profiles between the fibroblast and myofibroblast cultures. For detection of differentially expressed genes, P values were adjusted for multiple testing using the Benjamini and Hochberg step-up procedure with a false discovery ratecorrected P value cutoff of 0.05. RNA Isolation and RT-qPCR. TaqMan (Applied Biosystems) real-time PCR (RTqPCR) probes and primers were used to measure gene expression. Total RNA was extracted using Qiagen RNeasy Spin Columns according to the manufacturer’s instructions. RNA quality was determined by analysis with a NanoDrop spectrophotometer (Thermo Fisher). All reverse transcription reactions were prepared using the Life Technologies High Capacity cDNA Synthesis kit with random primers according to the manufacturer’s instructions. Comparative real-time PCR was performed in triplicate. cDNA samples were used as input for TaqMan quantitative PCR using predesigned, manufacturer-validated primers and probes. RT-qPCR–based expression levels are given as ΔCt values converted to actual numbers by appropriate factors of 2, using UBC as the endogenous control. Further details of method and analysis are given in ref. 11. Primary Cells and Cell Lines. Three human normal skin fibroblast and foreskin fibroblast cultures were established in the laboratory of W.F.B. Myofibroblasts
E5352 | www.pnas.org/cgi/doi/10.1073/pnas.1610954113
were isolated from tumor and nontumor regions of whole colon tissues as described in ref. 11. Fresh tissues were from patients operated on for primary colorectal tumors at the Oxford University Hospitals. Project approval was obtained from the local Research Ethics Board, National Health Service (NHS) National Research Ethics Service (NRES) Committee South Central - Oxford C, and informed consent was obtained from each patient. The successful primary myofibroblast cultures were labeled myo1998 (normal), myo2020 (cancer), myo6024 (normal), and myo2156 (cancer). Two colorectal carcinoma (HCT116 and HT29), one embryonal kidney (HEK293.T), four myofibroblast lines (Hs675.T, InMyoFib, CCD-112-CoN, and CCD-18Co), and one fibroblast line (NHDF-Ad) were obtained from the American Type Culture Collection (HCT116, Hs675.T, CCD-112-Con, and CCD-18Co), Lonza (InMyoFib and NHDF-Ad), and Cancer Research UK (HT29 and HEK293.T). Cells were grown in HCO3−-containing, highglucose DMEM in 5% CO2 and 21% O2 (Galaxy 48R; New Brunswick). Unless indicated otherwise, media contained 10% (wt/vol) FCS. For coculture experiments, HT29 and eGFP-expressing InMyoFib cells (lentiviral transduction) were plated at a starting ratio of 1:50 and grown for 4–5 d until confluent monolayers were formed. For experiments testing effects of TGFβ1, cells were first cultured for 24 h in low-FCS (0% FCS for NHDF-Ad, CCD-112 Con, HCT116, HT29; 1% FCS for InMyoFib; 2% FCS for Hs675.T cells; minimum FCS content that supported growth was determined empirically). Subsequent to this, cells were cultured for 48 h in low-FCS supplemented with 6 ng/mL human recombinant TGFβ1 (Life Technologies). TGFβ1 was not added to time-matched control experiments. Cell cultures were regularly tested for Mycoplasma (MycoAlert Assay; Lonza). Immunoblotting. Cells were lysed in RIPA buffer [Cell Signaling Technologies (CST)] for 20 min on ice. Lysates were then centrifuged at 13,400 rpm for 20 min at 4 °C (IEC Micromax) to obtain supernatant, which was subjected to protein measurement by BCA assay (Life Technologies). This was followed by SDS/PAGE electrophoresis and blotting. PVDF membranes were blocked by 5% milk in PBS with 0.1% Tween 20, and then incubated with primary antibody against SLC4A2/AE2, α-SMA, GJC-1/Cx45 (Novus Biologicals), GJA-1/ Cx43 (CST), GJB-2/Cx26 (Abcam), MCT1, and MCT4 (Millipore) overnight, or against β-tubulin–HRP and actin-HRP (CST) for 1 h at room temperature. Secondary antibodies were used according to manufacturers’ instructions. Immunoreactivity was visualized using ECL (Life Technologies). Immunofluorescence. Cells were grown to 50–80% confluency, fixed with 4% paraformaldehyde in PBS (Pierce; Life Technologies) and permeabilized with 0.2% Triton X-100 in PBS. After blocking with 3% BSA in PBS for 2 h, cells were incubated with primary antibodies against SHOX2 and NKX2-3 (Novus Biologicals) or rabbit polyclonal antibody against human AE2 (RayBiotech) overnight at 4 °C. Cells were then washed and incubated with goat antirabbit Alexa Fluor 488 (NKX2-3, AE2) and chicken anti-mouse Alexa Fluor 488 (SHOX2) secondary antibodies (Life Technologies). Cell nuclei were costained with Hoechst 33342 (Life Technologies). shRNA Knockdown. HEK293T packaging cells were plated into 25T T/C flasks and grown to 50% confluency, and transfected (CaPO4 method) with packaging plasmids pSPAX2 and pMD2.G (gift from A. H. Harris, Oxford) and four shRNA expression constructs (Genecopoiea, HSH017367-LVRU6GP for AE2/SLC4A2 knockdown; CSHCTR001-LVRU6GP as scrambled control). Lentiviruscontaining media were collected, filtered through 0.45-μm syringe filter, and added to NHDF-Ad and InMyoFib cells for 72 h. Solutions. CO2/HCO3−-free solution contained 125 mM NaCl, 20 mM Hepes (titrated to pH 6.4, 6.8, or 7.4 with 4 M NaOH), 4.5 mM KCl, 11 mM glucose, 1 mM CaCl2, and 1 mM MgCl2. CO2/HCO3−-buffered solution was bubbled with 5% CO2/95% O2; Hepes was replaced with 2.2, 5.5, or 22 mM NaHCO3 (final pH 6.4, 6.8, or 7.4); and total [Na+] was adjusted to 147 mM with NaCl. Superfusion was performed at 37 °C in 2-mL Lab-Tek chambers (Nunc; Thermo) that allow fast solution exchange. FRAP experiments were performed in Ibidi slides (Thistle Scientific) heated to 37 °C by thermal block. NVA was added from 0.5 M DMSO stock, dropwise, to a well-stirred warm solution at pH 7.4. Imaging. Fluorescence was imaged confocally (Zeiss LSM 700) on an inverted microscope (Zeiss Axiovert). To measure pHi, cells were AM loaded (10 min) with 10 μM cSNARF1 (excitation, 555 nm; emission, 580 and 640 nm). cSNARF1 fluorescence ratio was converted to pHi using a calibration curve obtained using the nigericin method. For FRAP, cells were AM loaded (10 min) with calcein (excitation, 488 nm; emission, >525 nm).
Hulikova et al.
∂[H+]/∂t = ∂2[H+]/∂x2 + I(x), where I is a function describing localized H+ injection (photolysis) rate. For measurements of H+ ion diffusivity in single cells (Dcell), the equation was 1D and ROIs were selected in three regions of the cell along the long axis. For measurements of H+ ion diffusivity in monolayers (Dtiss), the equation was 2D and ROIs were the central and neighboring cells in the monolayer. Data are reported as mean ± SEM, and significance was tested at 5% level by t test.
1. Swietach P, Vaughan-Jones RD, Harris AL, Hulikova A (2014) The chemistry, physiology and pathology of pH in cancer. Philos Trans R Soc Lond B Biol Sci 369(1638):20130099. 2. Vaupel P, Kallinowski F, Okunieff P (1989) Blood flow, oxygen and nutrient supply, and metabolic microenvironment of human tumors: A review. Cancer Res 49(23):6449–6465. 3. Parks SK, Chiche J, Pouysségur J (2013) Disrupting proton dynamics and energy metabolism for cancer therapy. Nat Rev Cancer 13(9):611–623. 4. Gillies RJ, Verduzco D, Gatenby RA (2012) Evolutionary dynamics of carcinogenesis and why targeted therapy does not work. Nat Rev Cancer 12(7):487–493. 5. Dewhirst MW, Cao Y, Moeller B (2008) Cycling hypoxia and free radicals regulate angiogenesis and radiotherapy response. Nat Rev Cancer 8(6):425–437. 6. Gatenby RA, Gillies RJ (2004) Why do cancers have high aerobic glycolysis? Nat Rev Cancer 4(11):891–899. 7. Stubbs M, McSheehy PM, Griffiths JR, Bashford CL (2000) Causes and consequences of tumour acidity and implications for treatment. Mol Med Today 6(1):15–19. 8. Hulikova A, Vaughan-Jones RD, Swietach P (2011) Dual role of CO2/HCO3− buffer in the regulation of intracellular pH of three-dimensional tumor growths. J Biol Chem 286(16):13815–13826. 9. Gatenby RA, et al. (2007) Cellular adaptations to hypoxia and acidosis during somatic evolution of breast cancer. Br J Cancer 97(5):646–653. 10. Dvorak HF, Senger DR, Dvorak AM (1983) Fibrin as a component of the tumor stroma: Origins and biological significance. Cancer Metastasis Rev 2(1):41–73. 11. Hsia L-T, et al. (2016) Myofibroblasts are distinguished from activated skin fibroblasts by the expression of AOC3 and other associated markers. Proc Natl Acad Sci USA 113(15):E2162–E2171. 12. Kalluri R, Zeisberg M (2006) Fibroblasts in cancer. Nat Rev Cancer 6(5):392–401. 13. McAllister SS, Weinberg RA (2010) Tumor-host interactions: A far-reaching relationship. J Clin Oncol 28(26):4022–4028. 14. Hanahan D, Coussens LM (2012) Accessories to the crime: Functions of cells recruited to the tumor microenvironment. Cancer Cell 21(3):309–322. 15. Massagué J (2012) TGFβ signalling in context. Nat Rev Mol Cell Biol 13(10):616–630. 16. Desmoulière A, Geinoz A, Gabbiani F, Gabbiani G (1993) Transforming growth factorbeta 1 induces alpha-smooth muscle actin expression in granulation tissue myofibroblasts and in quiescent and growing cultured fibroblasts. J Cell Biol 122(1):103–111. 17. Hawinkels LJ, et al. (2014) Interaction with colon cancer cells hyperactivates TGF-β signaling in cancer-associated fibroblasts. Oncogene 33(1):97–107. 18. Romero MF, Chen AP, Parker MD, Boron WF (2013) The SLC4 family of bicarbonate (HCO3−) transporters. Mol Aspects Med 34(2-3):159–182. 19. Alper SL, Sharma AK (2013) The SLC26 gene family of anion transporters and channels. Mol Aspects Med 34(2-3):494–515. 20. Hulikova A, Harris AL, Vaughan-Jones RD, Swietach P (2013) Regulation of intracellular pH in cancer cell lines under normoxia and hypoxia. J Cell Physiol 228(4):743–752. 21. Whitaker-Menezes D, et al. (2011) Evidence for a stromal-epithelial “lactate shuttle” in human tumors: MCT4 is a marker of oxidative stress in cancer-associated fibroblasts. Cell Cycle 10(11):1772–1783. 22. Pérez-Escuredo J, et al. (2016) Monocarboxylate transporters in the brain and in cancer. Biochim Biophys Acta, 10.1016/j.bbamcr.2016.03.013. 23. Humphreys BD, Jiang L, Chernova MN, Alper SL (1994) Functional characterization and regulation by pH of murine AE2 anion exchanger expressed in Xenopus oocytes. Am J Physiol 267(5 Pt 1):C1295–C1307. 24. Stewart AK, Kurschat CE, Vaughan-Jones RD, Alper SL (2009) Putative re-entrant loop 1 of AE2 transmembrane domain has a major role in acute regulation of anion exchange by pH. J Biol Chem 284(10):6126–6139. 25. Ruetz S, Lindsey AE, Ward CL, Kopito RR (1993) Functional activation of plasma membrane anion exchangers occurs in a pre-Golgi compartment. J Cell Biol 121(1):37–48. 26. Holappa K, Kellokumpu S (2003) Targeting of the AE2 anion exchanger to the Golgi apparatus is cell type-dependent and correlates with the expression of Ank(195), a Golgi membrane skeletal protein. FEBS Lett 546(2-3):257–264.
27. Ilyas M, Efstathiou JA, Straub J, Kim HC, Bodmer WF (1999) Transforming growth factor beta stimulation of colorectal cancer cell lines: Type II receptor bypass and changes in adhesion molecule expression. Proc Natl Acad Sci USA 96(6):3087–3091. 28. Woodford-Richens KL, et al. (2001) SMAD4 mutations in colorectal cancer probably occur before chromosomal instability, but after divergence of the microsatellite instability pathway. Proc Natl Acad Sci USA 98(17):9719–9723. 29. Swietach P, Rossini A, Spitzer KW, Vaughan-Jones RD (2007) H+ ion activation and inactivation of the ventricular gap junction: A basis for spatial regulation of intracellular pH. Circ Res 100(7):1045–1054. 30. Spray DC, Harris AL, Bennett MV (1981) Gap junctional conductance is a simple and sensitive function of intracellular pH. Science 211(4483):712–715. 31. Junge W, McLaughlin S (1987) The role of fixed and mobile buffers in the kinetics of proton movement. Biochim Biophys Acta 890(1):1–5. 32. Hulikova A, Swietach P (2014) Rapid CO2 permeation across biological membranes: Implications for CO2 venting from tissue. FASEB J 28(7):2762–2774. 33. Hulikova A, Aveyard N, Harris AL, Vaughan-Jones RD, Swietach P (2014) Intracellular carbonic anhydrase activity sensitizes cancer cell pH signaling to dynamic changes in CO2 partial pressure. J Biol Chem 289(37):25418–25430. 34. Swietach P, Spitzer KW, Vaughan-Jones RD (2007) pH-dependence of extrinsic and intrinsic H+-ion mobility in the rat ventricular myocyte, investigated using flash photolysis of a caged-H+ compound. Biophys J 92(2):641–653. 35. Hulikova A, Swietach P (2016) Nuclear proton dynamics and interactions with calcium signaling. J Mol Cell Cardiol 96:26–37. 36. Elfgang C, et al. (1995) Specific permeability and selective formation of gap junction channels in connexin-transfected HeLa cells. J Cell Biol 129(3):805–817. 37. Solan JL, Lampe PD (2005) Connexin phosphorylation as a regulatory event linked to gap junction channel assembly. Biochim Biophys Acta 1711(2):154–163. 38. Grosely R, et al. (2013) Effects of phosphorylation on the structure and backbone dynamics of the intrinsically disordered connexin43 C-terminal domain. J Biol Chem 288(34):24857–24870. 39. Hirayama A, et al. (2009) Quantitative metabolome profiling of colon and stomach cancer microenvironment by capillary electrophoresis time-of-flight mass spectrometry. Cancer Res 69(11):4918–4925. 40. Zhang H, Verkman AS (2010) Microfiberoptic measurement of extracellular space volume in brain and tumor slices based on fluorescent dye partitioning. Biophys J 99(4):1284–1291. 41. Verkman AS (2013) Diffusion in the extracellular space in brain and tumors. Phys Biol 10(4):045003. 42. Jain RK (1987) Transport of molecules in the tumor interstitium: A review. Cancer Res 47(12):3039–3051. 43. Tsujino T, et al. (2007) Stromal myofibroblasts predict disease recurrence for colorectal cancer. Clin Cancer Res 13(7):2082–2090. 44. Tsukada T, McNutt MA, Ross R, Gown AM (1987) HHF35, a muscle actin-specific monoclonal antibody. II. Reactivity in normal, reactive, and neoplastic human tissues. Am J Pathol 127(2):389–402. 45. Mouradov D, et al. (2014) Colorectal cancer cell lines are representative models of the main molecular subtypes of primary cancer. Cancer Res 74(12):3238–3247. 46. Akhurst RJ, Derynck R (2001) TGF-beta signaling in cancer—a double-edged sword. Trends Cell Biol 11(11):S44–S51. 47. Markowitz SD, et al. (1994) A benign cultured colon adenoma bears three genetically altered colon cancer oncogenes, but progresses to tumorigenicity and transforming growth factor-beta independence without inactivating the p53 tumor suppressor gene. J Clin Invest 93(3):1005–1013. 48. Leivonen SK, Kähäri VM (2007) Transforming growth factor-beta signaling in cancer invasion and metastasis. Int J Cancer 121(10):2119–2124. 49. Mastro AM, Babich MA, Taylor WD, Keith AD (1984) Diffusion of a small molecule in the cytoplasm of mammalian cells. Proc Natl Acad Sci USA 81(11):3414–3418. 50. Yasui H, et al. (2010) Low-field magnetic resonance imaging to visualize chronic and cycling hypoxia in tumor-bearing mice. Cancer Res 70(16):6427–6436.
Hulikova et al.
PNAS PLUS
Equations for Flux Analyses. Acid uptake flux J (units of millimoles H+ per liter per minute) was calculated as dpHi/dt × β, where β is buffering capacity (equal to intrinsic buffering in Hepes-buffered media or intrinsic plus CO2/HCO3−-dependent buffering in CO2/HCO3−-containing media). Cell-to-cell diffusive coupling κ (units of micrometers per second): FRAP recovery time course was best-fitted to an exponential curve. In the case of large cells (such as fibroblasts), the fitting function was a biphasic exponential curve f(t) = A0 − Afast × exp(−t/τfast) − Aslow × exp(−t/τslow). The faster time constant τfast reflects diffusion within the photobleached cell and the slower time constant τslow is inversely proportional to cell-to-cell calcein permeability through gap junctions, κ. Using the perimeter/cell area ratio ρ for the central cell, κ was calculated as Aslow/(τslow × ρ × (1 − A0 + A slow )). H + diffusion coefficient D (units of square micrometers per second): [H+] time courses in ROIs were fitted to a diffusion algorithm
PNAS | Published online August 19, 2016 | E5353
PHYSIOLOGY
ACKNOWLEDGMENTS. This work was supported by Worldwide Cancer Research (2012/0027; to P.S. and A.H.), the E. P. Abraham Fund (P.S.), the Department of Oncology Oxford University (W.F.B.), the European Commission under the Seventh Framework Programme (278204 Cell-o-matic) (to W.F.B.), and a Clarendon award from the University of Oxford (to L.-T.H.). P.S. is a Royal Society University Research Fellow.