ww w.E asy
En gi
nee
rin g
.ne t
**Note: Other Websites/Blogs Owners Please do not Copy (or) Republish this Materials, Students & Graduates if You Find the Same Materials with EasyEngineering.net Watermarks or Logo, Kindly report us to
[email protected]
Visit : www.EasyEngineering.net
Dharmapuri – 636 703 Downloaded From : www.EasyEngineering.net
LAB MANUAL
ww
Regulation
w.E
: 2013
Branch
: B.E.–All Branches
Year & Semester
: I Year / I Semester
asy
En
GE6163GE6163-CHEMISTRY LABORATORY - I
gin
E NG
Visit : www.EasyEngineering.net
eer
ing
.ne t
ANNA UNIVERSITY: CHENNAI SYLLABUS R – 2013
GE6163 - CHEMISTRY LABORATORY - I LIST OF EXPERIMENTS (Any 5 Experiments)
ww
1. Determination of Dissolved Oxygen in Water [Winkler’s Method]. 2. Determination of Chloride Content in Water by Argentometric Method
w.E
[Mohr’s Method].
asy
3. pH Metry - Determination of Strength of HCl by NaOH. 4. Determination of Strength of Acids in a Mixture Using Conductivity Meter.
En
5. Conductometric Titration of Strong Acid with Strong Base (Determination of NaOH).
gin
eer
6. Determination of Molecular Weight of Polyvinyl Alcohol Using Ostwald Viscometer.
ing
7. Estimation of Iron Content of the Water by Spectrophotometry.
Visit : www.EasyEngineering.net
.ne t
INDEX Ex. No.
Date
Signature of the Staff
Name of Experiment
1.
Determination of Dissolved Oxygen in Water [Winkler’s Method].
2.
Determination of Chloride Content in Water by Argentometric Method [Mohr’s Method].
ww
3.
4.
Remarks
pH Metry – Determination of Strength of HCl by NaOH.
w.E
Conductometric Titration of Strong Acid with Strong Base (Determination of NaOH).
asy
En
5.
Determination of Strength of Acids in a Mixture Using Conductivity Meter.
6.
Determination of molecular weight of polyvinyl alcohol using Ostwald viscometer.
7.
Estimation of iron content of the water sample using spectrophotometer.
Visit : www.EasyEngineering.net
gin
eer
ing
.ne t
GE 6163-Chemistry Laboratory - I
EX. NO: 1 DATE:
DETERMINATION OF DISSOLVED OXYGEN IN WATER [Winkler’s Method] AIM To determine the amount of dissolved oxygen in the given water sample by Winkler’s method, a standard solution of K2Cr2O7 of strength ……..N is given.
PRINCIPLE Oxygen is dissolved in water to the extent of 7–9 mgs/lit at a temperature range of 25°C - 35°C.
ww
The estimation of dissolved oxygen in water is useful in studying corrosion effects of boiler feed water and in studying water pollution. The amount of dissolved oxygen in water is estimated using Winkler’s
w.E
reagent (Potassium bromide + Potassium bromate). Water sample is collected carefully avoiding
asy
aeration/deaeration in ground stoppered flask. Initially manganous sulphate and alkali-iodide reagents are added and the reactions occur as follows. Mn2+ + 2OH– Mn(OH)2 +
O2
En
Mn(OH)2
gin
MnO(OH)2
(White) (Yellow brown)
eer
ing
The precipitate dissolves in concentrated sulphuric acid liberating iodine and the liberated iodine is titrated against Na2S2O3. MnO(OH)2 + 2H2SO4 Mn (SO4)2 + 2KI 2Na2S2O3 + I2
Mn(SO4)2 + 3H2O MnSO4 + K2SO4 + I2
.ne t
Na2S4O6 + 2NaI
MATERIALS REQUIRED 1. Sodium thiosulphate solution, 2. Std. Potassium dichromate solution, 3. Dil. H2SO4, 4. 5% KI, 6. Starch indicator, 7. Manganese sulphate, 8. Alkali-iodide mixture, 9. Conc. H2SO4 10. Burette, pipette, iodine flask.
2
Department of Chemistry Varuvan Vadivelan Institute of Technology, Dharmapuri – 636 703
Visit : www.EasyEngineering.net
GE 6163-Chemistry Laboratory - I
PROCEDURE TITRATION – I Standardisation of Sodium Thiosulphate The burette is washed and rinsed with sodium thiosulphate solution. Then the burette is filled with the given sodium thiosulphate solution upto zero mark. 20 ml of ……..N potassium dichromate solution is pipetted out into a clean conical flask. To this, 5 ml of sulphuric acid and 15 ml of 5% potassium iodide solution are added. This is titrated against sodium thiosulphate solution. When the solution becomes straw yellow colour, starch indicator is added and then titration is continued. The end point is disappearance of blue colour and appearance of light green colour. The titration is repeated to get concordant value.
ww
TITRATION – II Determination of dissolved oxygen
w.E
100-150 ml of the water sample is taken in the iodine flask, 2ml of manganese sulphate and 2ml
asy
of alkali-iodide mixture are added. The stopper is replaced and the flask is inverted and shaked several times for the rough mixing of reagents. The flask is left aside for some time. When half of the precipitate
En
settles down, the stopper is removed and 2ml of concentrated sulphuric acid is added.
gin
The stopper is replaced and the flask is inverted several times for complete dissolution of the
eer
precipitate to get a clear yellow solution. 20 ml of this solution is pipetted out in a clean conical flask and
ing
titrated against standardized sodium thiosulphate solution. When the solution becomes light yellow starch indicator is added. The titration is continued until the blue colour disappears. From the titre value the
.ne t
strength of dissolved oxygen is calculated and hence the amount of dissolved oxygen in the water sample is calculated.
3
Department of Chemistry Varuvan Vadivelan Institute of Technology, Dharmapuri – 636 703
Visit : www.EasyEngineering.net
GE 6163-Chemistry Laboratory - I
TITRATION – I Potassium dichromate Vs. Sodium thiosulphate Burette Readings Volume of Potassium dichromate
Sl. No
Initial
1.
Indicator
ml ml
20
0
20
0
Starch
ww 2.
Final
ml
ml
Concordant Volume of Sodium thiosulphate
w.E
CALCULATION:
asy
Volume of Potassium dichromate
V1 = 20 ml
Strength of Potassium dichromate
N1 = ………………N
En
Volume of Sodium thiosuphate
gin
V2 = ………………ml N2 =?
Strength of Sodium thiosuphate
According to the law of volumetric analysis
eer
V 1N 1 = V 2N 2
ing
.ne t
N2 =
N2= Strength of Sodium thiosulphate =……………….N
4
Department of Chemistry Varuvan Vadivelan Institute of Technology, Dharmapuri – 636 703
Visit : www.EasyEngineering.net
GE 6163-Chemistry Laboratory - I
TITRATION II Water sample Vs. Sodium thiosulphate Burette Readings
Volume of Water Sample
Sl. No
ml 1.
ww 2.
Initial
Final
ml
ml
Concordant Volume of Sodium thiosulphate
Indicator
ml
20
0
20
0
Starch
w.E
CALCULATION:
asy
En
Volume of Sodium thiosuphate
V1 = ………………ml
Strength of Sodium thiosuphate
N1 = ………………N
Volume of Water sample
V2 = 20 ml
Strength of Water sample
N2 =?
gin
eer
According to the law of volumetric analysis
V 1N 1 = V 2N 2
ing
.ne t
N2 =
N2= Strength of Water sample =……………….N
5
Department of Chemistry Varuvan Vadivelan Institute of Technology, Dharmapuri – 636 703
Visit : www.EasyEngineering.net
GE 6163-Chemistry Laboratory - I
Amount of dissolved oxygen in 1 litre of tap water = Normality x Eq.wt. of O2 x 1000 mgs = ………………N x 8 x 1000 = …………………mgs/lit
ww
w.E
asy
En
gin
eer
ing
.ne t
RESULT Amount of dissolved oxygen in water sample = ……………….mgs/lit.
6
Department of Chemistry Varuvan Vadivelan Institute of Technology, Dharmapuri – 636 703
Visit : www.EasyEngineering.net
GE 6163-Chemistry Laboratory - I
EX. NO: 2 DATE:
DETERMINATION OF CHLORIDE CONTENT IN WATER BY ARGENTOMETRIC METHOD [Mohr’s Method]. AIM To determine the amount of chloride present in 100 ml of the given water sample, being supplied with standard solution of sodium chloride of strength …………N and an approximately N/20 solution of silver nitrate.
PRINCIPLE
ww
Generally water contains chloride ions (Cl–) in the form of NaCl, KCl, CaCl2 and MgCl2. The
w.E
concentration of chloride ion in water, more than 250 ppm, is not desirable for drinking purpose. The total chloride ion can be determined by argentometric method (Mohr’s Method).
asy
In this method Cl– ion solution is directly titrated against AgNO3 using potassium chromate (K2CrO4) as an indicator.
AgNO3 + NaCl
En
(in water)
gin
AgCl
+ NaNO3
eer
(White precipitate)
At the end point, when all the Cl– ions are removed. The yellow colour of chromate changes into reddish brown due to the following reaction. 2AgNO3 + K2CrO4 (Yellow)
Ag2CrO4
ing + 2KNO3
(Reddish brown precipitate)
.ne t
MATERIALS REQUIRED 1. Std. NaCl solution, 2. AgNO3 solution, 3. 2% K2CrO4 indicator, 4. Burette, 5. Pipette, 6. Conical flask.
7
Department of Chemistry Varuvan Vadivelan Institute of Technology, Dharmapuri – 636 703
Visit : www.EasyEngineering.net
GE 6163-Chemistry Laboratory - I
PROCEDURE Step I TITRATION – I Standardisation of Silver nitrate The burette is washed well with distilled water and rinsed with the small amount of AgNO3 solution. It is then filled with the same solution upto the zero mark without any air bubbles. The pipette is washed well with distilled water and rinsed with the small amount of standard NaCl solution. 20 ml of this solution is pipetted out into a clean conical flask. 1ml of 2% K2CrO4
ww
indicator is added and titrated against AgNO3 solution taken in the burette. The end point is the change of colour from yellow to reddish brown. The titration is repeated for concordant values. Step II
w.E
TITRATION – II Determination of chloride ions
asy
20 ml of the given water sample is pipetted out into a clean conical flask and 1ml of 2%
En
K2CrO4 indicator is added. It is then titrated against standardized AgNO3 solution taken in the burette.
gin
The end point is the change of colour from yellow to reddish brown. The titration is repeated for concordant values.
8
eer
ing
.ne t
Department of Chemistry Varuvan Vadivelan Institute of Technology, Dharmapuri – 636 703
Visit : www.EasyEngineering.net
GE 6163-Chemistry Laboratory - I
Step I: STANDARDISATION OF SILVER NITRATE TITRATION – I Standard NaCl Vs. AgNO3
Sl. No
ml 20
1.
Final
ml
ml
ml
Indicator
0 K2CrO4
ww
2.
Initial
Concordant volume of AgNO3
Burette Readings
Volume of Nacl
20
0
w.E
CALCULATION:
Volume of Sodium Chloride V1 = 20 ml
asy
Strength of Sodium Chloride N1 = ……………N
En
Volume of Silver Nitrate
Strength of Silver Nitrate According to the law of volumetric analysis
V2 = …………..ml
gin N2=?
V 1N 1 = V 2N 2
eer
N2 =
ing
.ne t
N2=
∴ Strength of Silver Nitrate = ……………….N
9
Department of Chemistry Varuvan Vadivelan Institute of Technology, Dharmapuri – 636 703
Visit : www.EasyEngineering.net
GE 6163-Chemistry Laboratory - I
Step II: DETERMINATION OF CHLORIDE ION TITRATION – II Water sample Vs. Std. AgNO3
Sl. No
Volume of water sample
ml 20
1.
Final
ml
ml
ml
Indicator
0 K2CrO4
ww
2.
Initial
Concordant volume of AgNO3
Burette Readings
20
0
w.E
Calculation of Normality of the water sample (Chloride ion)
asy
Volume of water sample
En
Strength of water sample Volume of Silver Nitrate
Strength of Silver Nitrate
V1 = 20 ml N1 = ?
gin
V2 = …………..ml
eer
N2 =……………N
According to the law of volumetric analysis
V 1N 1 = V 2N 2
ing
.ne t
N1 =
N2= Strength of water sample = ……………….N
10
Department of Chemistry Varuvan Vadivelan Institute of Technology, Dharmapuri – 636 703
Visit : www.EasyEngineering.net
GE 6163-Chemistry Laboratory - I
Calculation of amount of the chloride Amount of the chloride ion present in 1 litre of the water sample
=
Equivalent weight of chloride ion X Strength of the chloride ion
= 35.46 x ……………..N = ………………gms
⸫ Amount of the chloride ion present in100 ml of the given water sample = ………………gms x 100/1000
ww
= ………………gms
w.E
asy
En
gin
eer
ing
.ne t
RESULT 1. Amount of chloride ion present in the whole of the given water sample = ………….gms/mgs/ppm 2. Amount of chloride ion present in the 100 ml of the given water sample = ………....gms/mgs/ppm
11
Department of Chemistry Varuvan Vadivelan Institute of Technology, Dharmapuri – 636 703
Visit : www.EasyEngineering.net
GE 6163-Chemistry Laboratory - I
EX. NO: 3 DATE:
pH METRY - DETERMINATION OF STRNGTH OF HCl BY NaOH AIM To determine the strength of given HCl by pH metry, a standard solution of NaOH of …………N is provided.
PRINCIPLE Since the pH of the solution is related to the H+ ion concentration by the following formula,
ww
pH = –log [H+]
w.E
measurement of pH of the solution gives the concentration of H+ ions in the solution. When NaOH is added slowly from the burette to the solution of HCl, the fast moving H+ ions are progressively
asy
replaced by slow moving Na+ ions. As a result pH of the solution increases.
En
HCl + NaOH
NaCl + H2O
gin
The increase in pH takes place until all the H+ ions are completely neutralized (upto the end
eer
point). After the end point, further addition of NaOH increases the pH sharply as there is an excess of fast moving OH– ions.
MATERIALS REQUIRED
ing
.ne t
1. pH meter, 2. Glass electrode, 3. 100 ml Beaker, 4. Standard NaOH, 5. Given HCl, 6. Burette, pipette, glass rod etc., 7. Distilled water.
PROCEDURE TITRATION – I
The given hydrochloric acid solution is transferred into 100 ml standard flask and made up to the zero mark using distilled water. 20 ml of this made up solution is pipetted out into a clean 100 ml beaker and diluted by adding 20 ml of distilled water. The glass electrode is dipped in it and connected with a pH meter.
12
Department of Chemistry Varuvan Vadivelan Institute of Technology, Dharmapuri – 636 703
Visit : www.EasyEngineering.net
GE 6163-Chemistry Laboratory - I
The burette is washed well with water and rinsed with a small amount of given NaOH solution. It is then filled with the same upto zero mark. Titration is carried out by adding std. NaOH solution in portions of 1ml from the burette to the HCl solution taken in the beaker and pH of the solution is noted for each addition. This process is continued until atleast 5 readings are taken after the end point, and the range at which the end point lies is found out by plotting volume of NaOH added against pH (graph I). TITRATION – II
Another titration is carried out by adding std. NaOH solution in portions of 0.1 ml near the end point and pH of the solution is noted after each addition. The addition of NaOH is continued even
ww
after the end point for further 1 ml. The accurate end point is found out by plotting ∆pH/∆V against
w.E
volume of NaOH added (graph II). From the end point, the strength of HCl solution and hence the amount of HCl is calculated.
asy
En
13
gin
eer
ing
.ne t
Department of Chemistry Varuvan Vadivelan Institute of Technology, Dharmapuri – 636 703
Visit : www.EasyEngineering.net
GE 6163-Chemistry Laboratory - I
TABLE – I (Titration – I) Titration of HCl (20 ml) Vs. NaOH S. No
pH
Volume of NaOH
Remarks
ml 1. 2. Gradual increase
3.
ww 4. 5. 6. 7.
w.E
8. 9. 10.
asy
End point
En
gin
eer
Sudden increase
11. 12. 13.
14
ing
.ne t
Department of Chemistry Varuvan Vadivelan Institute of Technology, Dharmapuri – 636 703
Visit : www.EasyEngineering.net
GE 6163-Chemistry Laboratory - I
TABLE – II (Titration – II) Titration of HCl (20 ml) Vs. NaOH S. No
pH
Volume of NaOH ml
∆pH
∆V
∆pH / ∆V
Ml
1. 2. 3.
ww 4. 5. 6.
w.E
asy
En
7. 8. 9. 10. 11. 12. 13.
gin
eer
ing
.ne t
14. 15. 16. 17. 18. 19. 20. 15
Department of Chemistry Varuvan Vadivelan Institute of Technology, Dharmapuri – 636 703
Visit : www.EasyEngineering.net
GE 6163-Chemistry Laboratory - I
ww
Calculation
w.E
asy
Step I: Calculation of Strength of HCl
En
Volume of HCl
Strength of HCl
V1 = 20 ml
gin
N1 = ?
eer
Volume of NaOH
V2 = ……………ml (titre value)
Strength of NaOH
N2 = ……………N
According to the law of volumetric analysis,
V 1N 1 = V 2N 2 N1 =
ing
.ne t
= Strength of HCl = ……………….N Step – II: Calculation of amount of HCl The amount of HCl present in 1000 ml of the given solution = …….N x Eq. wt. of HCl (36.45) = …………….. x 36.45 = ……………..gms 16
Department of Chemistry Varuvan Vadivelan Institute of Technology, Dharmapuri – 636 703
Visit : www.EasyEngineering.net
GE 6163-Chemistry Laboratory - I
ww
w.E
asy
En
gin
eer
ing
.ne t
RESULT 1. Strength of the given HCl solution = …………………N. 2. Amount of HCl present in 1 litre of the solution = …………………….gms.
17
Department of Chemistry Varuvan Vadivelan Institute of Technology, Dharmapuri – 636 703
Visit : www.EasyEngineering.net
GE 6163-Chemistry Laboratory - I
EX. NO: 4 DATE:
CONDUCTOMETRIC TITRATION OF STRONG ACID WITH STRONG BASE (Determination of NaOH) AIM To determine the amount of sodium hydroxide present in 250 ml of the given solution by conductometric titration. You are provided with standard hydrochloric acid of ……………….N.
PROCEDURE
ww
Solution of electrolytes conducts electricity due to the presence of ions. The specific
conductance of a solution is proportional to the concentration of ions in it. The reaction between HCl
w.E
and NaOH may be represented as,
asy
HCl + NaOH
NaCl + H2O
When a solution of hydrochloric acid is titrated with NaOH, the fast moving hydrogen ions are
En
progressively replaced by slow moving sodium ions. As a result conductance of the solution decreases.
gin
This decrease in conductance will take place until the end point is reached. Further addition of alkali
eer
raises the conductance sharply ad there is an excess of hydroxide ions.
ing
A graph is drawn between volume of NaOH added and the conductance of solution. The exact end point is intersection of the two curves.
MATERIALS REQUIRED
.ne t
1. Conductivity bridge, 2. Conductivity cell, 3. 100 ml beaker, 4. Standard HCl, 5. Given NaOH solution, 6. Distilled water, 7. Burette, Pipette, glass rod etc.
PROCEDURE TITRATION The burette is washed well with distilled water and rinsed with the given NaOH solution. It is then filled with same upto the zero level. 20 ml of the standard HCl is pipetted out into a clean 100 ml beaker.
18
Department of Chemistry Varuvan Vadivelan Institute of Technology, Dharmapuri – 636 703
Visit : www.EasyEngineering.net
GE 6163-Chemistry Laboratory - I
The conductivity cell is placed in it and immersed in the solution. The two terminals of the cell are connected with a conductivity bridge. Now 1 ml of NaOH from the burette is added to the solution, taken in the beaker, stirred for some time and then conductivity is measured. (The conductivity is going on decreasing up to the end point).This process is repeated until at least five readings are taken after the end point has been reached. Now the graph is plotted by taking volume of NaOH in the X-axis and conductance in the Yaxis. The end point is the intersection of the two curves. From the volume of NaOH, the strength and hence the amount of NaOH present in 250 ml of the solution is calculated.
ww
w.E
asy
En
19
gin
eer
ing
.ne t
Department of Chemistry Varuvan Vadivelan Institute of Technology, Dharmapuri – 636 703
Visit : www.EasyEngineering.net
GE 6163-Chemistry Laboratory - I
Step I TABLE – I Titration of Standard HCl Vs. NaOH Volume of HCl taken = 20 ml S. No
Volume of NaOH added ml
1.
0
21
2.
1
22
3.
2
23
Conductance
Remarks
mho
Decreases
ww
4.
3
24
5.
4
6.
5
7.
6
8.
7
28
9.
8
29
10.
9
30
11.
10
31
12.
11
32
13.
12
33
14.
13
34
15.
14
35
16.
15
36
17.
16
37
18.
17
38
19.
18
39
20.
19
40
w.E 25 26 27
asy
En
gin
eer
End point
ing
.ne t
Increases
20
Department of Chemistry Varuvan Vadivelan Institute of Technology, Dharmapuri – 636 703
Visit : www.EasyEngineering.net
GE 6163-Chemistry Laboratory - I
Graph: Conduction Vs. Volume of NaOH
ww
w.E
asy
Step II
Calculation of Strength of NaOH Volume of HCl
En
gin
V1 = 20 ml
eer
Strength of HCl
N1 = ……………..N
Volume of NaOH
V2 = ……………ml (titre value)
Strength of NaOH
N2 = ?
According to the law of volumetric analysis,
V 1N 1 = V 2N 2
ing
.ne t
N2 =
N2 = Strength of NaOH = ……………….N
21
Department of Chemistry Varuvan Vadivelan Institute of Technology, Dharmapuri – 636 703
Visit : www.EasyEngineering.net
GE 6163-Chemistry Laboratory - I
Calculation of amount of NaOH The amount of NaOH present in 1000 ml of the given solution
= 40 x …………..N = ………….gms = 40 x ………..N x 250/1000
The amount of NaOH present in 250 ml of the given solution
= ………….gms
ww
w.E
asy
En
gin
eer
ing
.ne t
RESULT 1. The strength of given NaOH solution = ………………….N 2. The amount of NaOH present in 250 ml of the given solution = ………………..gms.
22
Department of Chemistry Varuvan Vadivelan Institute of Technology, Dharmapuri – 636 703
Visit : www.EasyEngineering.net
GE 6163-Chemistry Laboratory - I
EX. NO: 5 DATE:
DETERMINATION OF STRENGTH OF ACIDS IN A MIXTURE USING CONDUCTIVITY METER AIM To determine the strength and amount of a strong acid and a weak acid (HCl and CH3COOH) present in one litre of the given solution by conductometric titration. You are provided with standard NaOH solution of ……………….N.
PRINCIPLE
ww
Solution of electrolytes conducts electricity due to the presence of ions. Since specific
w.E
conductance of a solution is proportional to the concentration of ions in it. Conductance of the solution is measured during titration.
asy
When the sodium hydroxide is added slowly from the burette to the solution, HCl (strong acid)
En
gets neutralized first. Since the fast moving H+ ions are replaced by slow moving sodium ions,
gin
decrease in conductance take place until the end point is reached. HCl + NaOH
eer
NaCl + H2O ( Ist neutralization)
ing
After the complete neutralization of all HCl, the neutralization of CH3COOH starts, CH3COOH + NaOH
.ne t
CH3COONa + H2O (IInd neutralization)
Since CH3COONa is stronger electrolyte than CH3COOH, conductivity slowly increases until all CH3COOH is completely neutralized. When the end point is reached, addition of NaOH will cause sudden increase in the conductance. This is due to the presence of fast moving OH– ions.
MATERIALS REQUIRED 1. Conductivity bridge, 2. Conductivity cell, 3. 100 ml beaker, 4. Standard NaOH, 5. Given HCl and CH3COOH mixture, 6. Burette, Pipette, glass rod etc., 7. Distilled water.
23
Department of Chemistry Varuvan Vadivelan Institute of Technology, Dharmapuri – 636 703
Visit : www.EasyEngineering.net
GE 6163-Chemistry Laboratory - I
PROCEDURE TITRATION The given mixture of acids (HCl + CH3COOH) is transferred into 100 ml standard flask and made upto zero mark using distilled water. 20 ml of the made up solution is pipetted out into a clean 100 ml beaker and the conductivity cell is placed in it and immersed in the solution. The two terminals of the cell are connected with a conductivity bridge. The burette is washed well with water and rinsed with the given standard NaOH solution. It is then filled with NaOH solution up to the zero level.
ww
Now 1 ml of NaOH from the burette is added to the solution, taken in the beaker, stirred for
some time and then conductivity is measured. (The conductivity is going on decreasing up to the end
w.E
point).This process is repeated until at least five readings are taken after the end point (A) has been reached.
asy
After the end point, again NaOH is gradually added, which causes increase in conductance.
En
This increase in conductance is observed until the end point (B) is reached.
gin
After the second end point, sudden increase in conductance is observed on further addition of
eer
NaOH. The readings are continuously measured for each addition of NaOH and are tabulated. Now the graph is plotted between the volume of NaOH Vs conductivity. From the graph the first end point (A)
ing
and the second end point (B) are noted. From the end points the strengths and amount of HCl and CH3COOH present in 1 liter of the mixture of solution are calculated.
24
.ne t
Department of Chemistry Varuvan Vadivelan Institute of Technology, Dharmapuri – 636 703
Visit : www.EasyEngineering.net
GE 6163-Chemistry Laboratory - I
ww
w.E
asy
En
25
gin
eer
ing
.ne t
Department of Chemistry Varuvan Vadivelan Institute of Technology, Dharmapuri – 636 703
Visit : www.EasyEngineering.net
GE 6163-Chemistry Laboratory - I
TABLE – I Titration of mixture (HCl + CH3COOH) Vs. NaOH S. No
ww
Conductance
ml
mho
1.
0
20
2.
1
21
3.
2
22
4.
3
23
5.
4
24
6.
5
25
6
26
w.E 7. 8.
26
Volume of NaOH added
asy 7
En 27
9.
8
28
10.
9
29
11.
10
30
12.
11
31
13.
12
32
14.
13
33
15.
14
34
16.
15
35
17.
16
36
18.
17
37
19.
18
38
20.
19
39
gin
eer
ing
.ne t
Department of Chemistry Varuvan Vadivelan Institute of Technology, Dharmapuri – 636 703
Visit : www.EasyEngineering.net
GE 6163-Chemistry Laboratory - I
Step I Calculation of Strength of HCl Volume of the mixture (HCl)
V1 = 20 ml
Strength of the mixture (HCl)
N1 = ?
Volume of the NaOH
V2 = …………… (A) ml (Ist titre value)
Strength of the NaOH
N2 = ………………N
According to the law of volumetric analysis,
V 1N 1 = V 2N 2
ww
N1 =
w.E
=
asy
Strength of HCl = ……………….N
Calculation of amount of HCl
En
gin
∴The amount of HCl present in 1000 ml of the given solution
eer
= Strength of HCl x Eq. wt. of HCl
ing
= ……………….N x 36.45 = ……………….gms Step I Calculation of Strength of CH3COOH
27
.ne t
Volume of the mixture (CH3COOH)
V1 = 20 ml
Strength of the mixture (CH3COOH)
N1 = ?
Volume of the NaOH
V2 = ………… (B-A) ml (IInd titre value)
Strength of the NaOH
N2 = ………………N
Department of Chemistry Varuvan Vadivelan Institute of Technology, Dharmapuri – 636 703
Visit : www.EasyEngineering.net
GE 6163-Chemistry Laboratory - I
According to the law of volumetric analysis,
V 1N 1 = V 2N 2 N1 =
= Strength of CH3COOH = ……………….N Calculation of amount of CH3COOH
ww
∴The amount of CH3COOH present in 1000 ml of the given solution
w.E
= Strength of CH3COOH x Eq.wt. of CH3COOH = ……………….N x 60
asy
= ……………….gms.
En
gin
eer
ing
.ne t
RESULT 1. The strength of HCl present in 1 litre of the given solution
= ………………….N
2. The amount of HCl present in 1 litre of the given solution
= ………………..gms
3. The strength of CH3COOH present in 1 litre of the given solution
= ………………….N
4. The amount of CH3COOH present in 1 litre of the given solution
= ………………..gms
28
Department of Chemistry Varuvan Vadivelan Institute of Technology, Dharmapuri – 636 703
Visit : www.EasyEngineering.net
GE 6163-Chemistry Laboratory - I
EX. NO: 6 DATE:
DETERMINATION OF MOLECULAR WEIGHT OF POLYVINYL ALCOHOL USING OSTWALD VISCOMETER AIM To determine the molecular weight of the polyvinyl alcohol using Ostwald’s viscometer, a 1% PVA solution is provided.
PRINCIPLE
ww
Molecular weight of PVA means average molecular weight of the polymer. This can be
determined by measuring the intrinsic viscosity (ղ i) of a dilute PVA solution. This intrinsic
w.E
viscosity is related to the molecular weight by the following relationship.
asy
a
ղ i = kM (Mark Hownik equation)
En
where, ղ i = Intrinsic viscosity
gin
k & a = Constants for a given PVA-solvent combination at a given temperature. M = Average molecular weight.
eer
ing
Moleular weight constants (k and a) for some polymer / solvent systems are given in table III.
MATERIALS REQUIRED
.ne t
1. PVA, 2. Distilled water, 3. Viscometer, 4. 50 ml std. flask , 5. 20 ml graduated pipette, 6. Stop watch. Important Viscosity definitions 1. Relative viscosity (ղ r)
ղr=
2. Specific viscosity (ղ sp)
ղ sp =
= =
3. Reduced viscosity (ղ red) ղ red =
29
Department of Chemistry Varuvan Vadivelan Institute of Technology, Dharmapuri – 636 703
Visit : www.EasyEngineering.net
GE 6163-Chemistry Laboratory - I
4. Intrinsic viscosity (ղ i)
ղ i=
Where, ղ i = Absolute viscosity of a PVA solution. ղ o = Absolute viscosity of a pure solvent
t = Flow time for the PVA solution to = Flow time for the solvent (H2O).
PROCEDURE
ww
Step I: Preparation of PVA solutuions of different concentrations
w.E
PVA solutions of different concentrations, say 0.2%, 0.4%, 0.6%, 0.8% and 1% are prepared
from the given polymer stock solution as in Table - I.
asy
Step II: Determination of flow time of water
En
20 ml of the water is taken into the viscometer and is sucked through the capillary tube upto the
gin
uppermark, without any air bubbles. Now the flow time is noted for the water to flow from the uppermark (A1) to lowermark (A2).
eer
Step 3: Determination of flow time of PVA solutions
ing
.ne t
Now fill the viscometer with 20 ml of one of the PVA solution (say I) into the viscometer and flow time is determined as before. Similarly the flow time of the other PVA solutions (IInd, IIIrd etc.,) are determined.
Note: For each PVA solution, the viscometer is washed and rinsed with water. From the flow times, reduced viscosity (ղ sp/C) can be calculated. Graph is plotted between ղ sp/C vs concentration, straight line is obtained with an intercept is called intrinsic viscosity (ղ i).
30
Department of Chemistry Varuvan Vadivelan Institute of Technology, Dharmapuri – 636 703
Visit : www.EasyEngineering.net
GE 6163-Chemistry Laboratory - I
ww
w.E
asy
En
gin
TABLE - I
Preparation of various PVA solutions S. No
Volume of 1% PVA solutions (Stock Solutions)
eer
Volume of water
ing
Concentration
ml
ml
%
I
4
16
0.2
II
8
12
0.4
III
12
8
0.6
IV
16
4
0.8
V
20
0
1.0
31
.ne t
Department of Chemistry Varuvan Vadivelan Institute of Technology, Dharmapuri – 636 703
Visit : www.EasyEngineering.net
GE 6163-Chemistry Laboratory - I
TABLE – II Viscosity data for PVA / water Flow time of the pure (t0) = ……. sec
S. No
Concentration
Flow time t
%
Sec
I
0.2
II
0.4
III IV
t/t0 – 1 = ղ sp
ղ /ղ 0 = t/t0 = ղ r
ղ sp/C = ղ red
ww
0.6
w.E
0.8
1.0
V Calculations
asy
Molecular weight of the PVA
En
gin
Mark – Hownik equation is given by
ղ i = kM
a
log ղ i = log k + a log M
eer
log M =
ing
.ne t
M = A . log Where, M = Molecular weight of the polymer. M = A log
RESULT The molecular weight of the given polymer = ………….
32
Department of Chemistry Varuvan Vadivelan Institute of Technology, Dharmapuri – 636 703
Visit : www.EasyEngineering.net
GE 6163-Chemistry Laboratory - I
EX. NO: 7 DATE:
ESTIMATION OF IRON CONTENT OF THE WATER BY SPECTROPHOTOMETRY AIM To estimate the amount of iron content present in given water sample by spectrophotometry using ammonium thiocyanate.
PRINCIPLE
ww
Spectrophotometer is an instrument used to measure the intensity of the light absorbed by
w.E
a substance. The relationship between absorbance (A) and the concentration of the solution (C) is given by Beer – Lambert’s law.
asy
log Io/I = A = εCx
En
Where
gin
Io = Intensity of incident light
I = Intensity of transmitted light
ε = Molar absorption co-efficient x = Thickness of the cell C = Concentration of the solution
eer
ing
.ne t
From the equation it is seen that, the absorbance (A) is directly proportional to the molar concentration and thickness of the cell. In the determination of the iron, ferrous iron solution is acidified with HNO3 to convert Fe2+ into Fe3+. Fe3+ ions does not give any colour in solution. But it gives red colour when it reacts with potassium thiocyanate (KSCN) (or) Ammonium thiocyanate (NH4SCN) solution.
33
Department of Chemistry Varuvan Vadivelan Institute of Technology, Dharmapuri – 636 703
Visit : www.EasyEngineering.net
GE 6163-Chemistry Laboratory - I
This complex has maximum absorption in the region λ = 480 nm. A calibration curve is drawn by measuring the absorbance of known solution. Then the absorbance of unknown solution is measured, using which the concentration can be determined from the calibration curve.
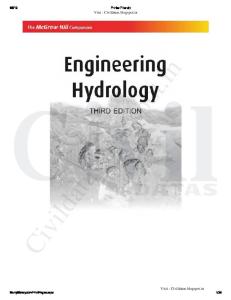
MATERIALS REQUIRED 1. Spectrophotometer, 2. Ferrous ammonium sulphate, 3. HNO3, 4. 25 ml standard flask 10 Nos, 5. Graduated pipette, 6. Potassium thiocyanate (or) Ammonium thiocyanate.
PROCEDURE 1. Preparation of stock Fe3+ iron solution
ww
A stock solution of Fe3+ is prepared by dissolving 0.0838 gms of ferrous
w.E
ammonium sulphate with 1 ml of con. HNO3 and made upto 1 litre in a standard flask using distilled water.
asy
From the stock solution, various concentrations are prepared (1, 2, 3, 4, 5, & 6 ppm) as shown in Table I.
En (or)
gin
Instead of various ppm Fe3+ solutions, various normal solutions are prepared.
eer
A stock solution of 0.1 N Fe3+ is prepared by dissolving 39.0 gms of FAS with 1 ml of con. HNO3 in 1 liter of distilled water.
ing
.ne t
From the stock solution, various concentrations are prepared (0.01, 0.02, 0.03, 0.04, 0.05 & 0.06 N) as shown in Table I. 2. Estimation of iron content
The spectrophotometer is switched on and warmed up to 10 minutes. The monochromater is adjusted for λ = 480 nm. The blank solution (distilled water) is kept in the cell and the absorbance is measured for which the absorbance is zero and transmittance is 100. Now the absorbance of all the standard solutions are similarly measured. Also the absorbance of unknown solution is measured. (Table II).
34
Department of Chemistry Varuvan Vadivelan Institute of Technology, Dharmapuri – 636 703
Visit : www.EasyEngineering.net
GE 6163-Chemistry Laboratory - I
The calibration graph is drawn between the concentration and absorbance from which the concentration of unknown solution is measured. Layout of spectrophotometer
ww
w.E
asy
TABLE –I
En
Preparation of various concentration of Fe3+ solution
S. No.
Volume Iron Volume of Solution
dil. HNO3
Volume of NH4SCN
gin
Volume of distilled H2O Concentration of Iron
eer
(to make equal. Volume)
ing ppm
N
ml
ml
ml
ml
1
10
5
10
75
1
2
20
5
10
65
2
.ne t
3
30
5
10
55
3
0.03
4
40
5
10
45
4
0.04
5
50
5
10
35
5
0.05
6
60
5
10
25
6
0.06
35
Department of Chemistry Varuvan Vadivelan Institute of Technology, Dharmapuri – 636 703
Visit : www.EasyEngineering.net
0.01 0.02
GE 6163-Chemistry Laboratory - I
Graph: Calibration curve (absorbance Vs concentration)
ww
w.E
TABLE – II
asy
Measurement of absorbance
En
Blank (distilled water): zero absorbance; λmax = 480 nm
S. No
36
gin
Concentration
1.
1 ppm
0.01 N
2.
2 ppm
0.02 N
3.
3 ppm
0.03 N
4
4 ppm
0.04 N
5
5 ppm
0.05 N
6
6 ppm
0.06 N
7
Unknown
eer
Absorbance
ing
.ne t
Department of Chemistry Varuvan Vadivelan Institute of Technology, Dharmapuri – 636 703
Visit : www.EasyEngineering.net
GE 6163-Chemistry Laboratory - I
Calculation of amount of iron content Amount of iron present in the given solution
= N x Eq. wt of iron x 1000 ppm = ……… x 55.85 x 1000 ppm = ……… ppm (or) mgs/lit
ww
w.E
asy
En
gin
eer
ing
.ne t
RESULT Amount of iron present in the given water sample = ………… ppm.
37
Department of Chemistry Varuvan Vadivelan Institute of Technology, Dharmapuri – 636 703
Visit : www.EasyEngineering.net
ww w.E asy
En gi
nee
rin g
.ne t
**Note: Other Websites/Blogs Owners Please do not Copy (or) Republish this Materials, Students & Graduates if You Find the Same Materials with EasyEngineering.net Watermarks or Logo, Kindly report us to
[email protected]
Visit : www.EasyEngineering.net