2QFY06 Results Update SECTOR: INFORMATION TECHNOLOGY
Geometric Software STOCK INFO.
BLOOMBERG
21 October 2005
BSE Sensex: 8,069 GMSS IN
Neutral
REUTERS CODE
S&P CNX: 2,444
Equity Shares (m)
Rs86
Previous Recommendation: Buy
GEOM.BO
57.1
YEAR
NET SALES
PAT
EPS
EPS
P/E
P/BV
ROE
ROCE
EV/
EV/
END
(RS M )
(RS M)
(RS)
GROWTH (%)
(X)
(X)
(%)
(%)
SALES
EBITDA
-24/-43/-1
3/05A
1,682
275
4.9
28.1
17.6
4.0
24.6
34.6
2.7
9.8
M.Cap. (Rs b)
4.9
3/06E
2,257
319
5.6
13.8
15.5
3.3
22.9
32.5
1.9
8.0
M.Cap. (US$ b)
0.1
3/07E
2,930
416
7.1
26.6
12.2
2.8
24.1
33.3
1.4
5.8
52-Week Range (Rs)
132/60
1,6,12 Rel. Perf. (%)
Geometric Software reported consolidated revenue of Rs508m, up 5% QoQ as against our expectation of Rs522m for 2QFY06. Net profit was down 57% QoQ at Rs38m as against our expectation of Rs40m. The products business grew 8.3% QoQ with only Teksoft reporting flat revenues. CAD-PDM launch continues to be delayed. Engineering services grew slower at 4.5%. However, offshore growth was greater at 6.2%. The company has initiated a new service offering called Application Maintenance Services (AMS), which is designed to give an annuity component to the revenue stream. Gross margins were up 270bp due to improvement in utilization in products business and greater offshore growth in the engineering services business. EBITDA margin went up 200bp due to lower G&A expenses. Net profit was down 56.7% due to low other income (other income was high at Rs70m in 1QFY06 due to adjustment in the accounting policy for investments). The company maintains that the demand in the PLM market continues to be strong. The company has refrained from giving guidance for the full year, but has indicated that it would be unable to meet its earlier guidance. While the growth in the second half of the year promises to be more robust, any further setback would negatively impact stock price. The stock currently trades at a PE of 12.2x FY07E earnings. Maintain Neutral. QUARTERLY PERFORMANCE
(Rs Million) FY05
Y/E MARCH
Revenues Q-o-Q Change (%) Direct Expenses Sales, General & Admin. Expenses Operating Profit
FY06E
FY05
FY06E
2,257
1Q
2Q
3Q
4Q
1Q
2Q
3Q
4Q
349
399
435
499
486
510
592
668
1,682
13.0
14.1
9.1
14.7
-2.6
5.0
16.1
12.8
58.6
34.2
226
239
246
292
298
299
324
349
1,003
1,270
42
49
46
76
105
114
114
123
213
455
81
111
143
131
83
98
155
196
466
532
23.3
27.8
33.0
26.2
17.2
19.1
26.1
29.4
27.7
23.6
Other Income
21
10
-5
26
71
-2
10
20
51
99
Depreciation
29
30
32
37
37
41
46
52
128
176
PBT bef. Extra-ordinary
73
90
106
120
118
55
118
164
389
455
Provision for Tax
13
17
17
25
20
8
20
28
70
76
17.2
18.3
15.7
20.6
17.4
14.2
17.0
17.0
18.1
16.8
9
11
10
14
19
13
14
14
44
61
51
63
80
82
78
34
85
122
275
319
-5.4
24.0
25.7
2.6
-4.3
-56.5
148.5
44.3
31.5
15.9
Margins (%)
Rate (%) Minority interest Net Income bef. Extra-ordinary Q-o-Q Change (%) E: MOSt Estimates
Diviya Nagarajan (
[email protected]); Tel: +91 22 39825426
© Motilal Oswal Securities Ltd., 81-82, Bajaj Bhawan, Nariman Point, Mumbai 400 021 Tel: +91 22 56575200 Fax: 2281 6161
Geometric Software
Revenue growth slower at 5% In line with Geometric’s earnings warning stating that it would report mid-single digit growth in revenue for 2QFY06 as against the previously expected double-digit growth, the company has reported consolidated revenue of Rs508m, up 5% QoQ as against our expectation of Rs522m for 2QFY06. The reasons for the slower growth included: ? Delay in commencement of certain projects that were supposed to start in the beginning or middle of the second quarter; these projects commenced in September. ? Delay in commencement of large engineering services project from one of the company’s business partners; the projects commenced in the last week of September as opposed to expected commencement in the beginning of the quarter. ? Delay in the launch of the CAD-PDM product due to delay in alignment with its channel partners. Product business up 8.3% QoQ The products business grew 8.3% QoQ with Teksoft reporting flat revenues, while all other products grew during the quarter. The company launched new versions of Feature Recognition, Nestlib, GeomCaliper and 3DSearch IT product suites during the quarter, which added to the growth momentum. The company also won three new deals for eDrawings. CAD-PDM launch was delayed due to channel partner issues. PRODUCT REVENUE (RS M) SEP-04
Products QoQ growth %
DEC-04 MAR-05
JUN-05
SEP-05
30
39
76
69
75
-5.8
31.4
95.3
-8.7
8.3
Source: Company/Motilal Oswal Securities
Engineering services up 4.5% due to offshore momentum While onsite growth in engineering services was flat at 0.5% QoQ, offshore revenue grew 6.2% sequentially during the quarter. Consequently, the total revenue from engineering services was up 4.5% QoQ. The sales cycles
21 October 2005
have become longer due to increase in deal sizes, which contributed to the delay in project starts. Of the delayed projects from business partners, several started during the current quarter, except for one partner that was acquired, leading to cancellation of projects. The company has announced that it would not be able to meet it US$5m revenue guidance for the full year. ENGINEERING SERVICES REVENUE (RS M) SEP-04
Onsite QoQ growth % Offshore QoQ growth % Total QoQ growth %
DEC-04
MAR-05
JUN-05
SEP-05
131
94
113
123
130
21.6
19.8
9.0
5.8
0.5
275
283
300
287
304
14.4
3.0
6.0
-4.5
6.2
369
396
423
417
435
16.1
7.3
6.8
-1.5
4.5
Source: Company/Motilal Oswal Securities
AMS to add annuity component to revenue stream The company has initiated a new service offering called Application Maintenance Services (AMS), which is designed to give an annuity component to the revenue stream. The company plans to offshore routine maintenance work through this practice, which it believes holds immense potential as maintenance offshoring is minimal at present. The move is a part of the company’s strategy to smoothen out the fluctuations in its PLM revenues by offering a wider basket of services. The company has started discussion with two of its customers for AMS work, which it expects to start after a few quarters. The company is also trying to reduce dependence on the automotive industry (currently at 18-20% of revenue) by approaching new sectors such as machine tools and equipment manufacturing. Some of the company’s customers in the automotive industry (especially the German customers) have been facing declining revenue coupled with escalating costs, which has prompted the company to look for new sectors where it can vend its expertise. While it is early to comment on specifics in this business, we believe that this is a step in the right direction.
2
Geometric Software
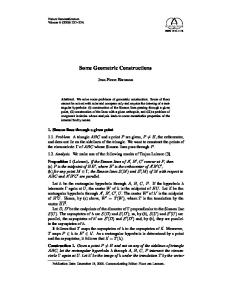
EBITDA margin rises by 200bp The gross margin in 2QFY06 was up 270bp due to improvement in utilization in products business and greater offshore growth in the engineering services business. While overall utilization including trainees dropped to 76% from 80% in 1QFY06, the drop in utilization excluding trainees was lower at 2% (85% in 2QFY06 as against 87% in 1QFY06). Our interaction with the company revealed that the utilization in the products business was higher during the quarter, which improved gross margins. Additionally, higher offshore growth in the engineering business (6.2%) also boosted margins for the quarter. EBITDA margin was up 200bp due to 50bp increase G&A expenses. MARGIN IMPROVEMENT
Revenue (Rs) - LHS
600
EBITDA % - RHS
40
450
30
300
20
150
10
Sep-05
Jun-05
Mar-05
Dec-04
Sep-04
Jun-04
Mar-04
0 Dec-03
0
Source: Company/Motilal Oswal Securities
21 October 2005
Net profit plunges by 57% The net profit for the quarter was down 56.7% due to the impact of slower revenue growth and negative other income. The last quarter saw a spike in other income at Rs70m due to a change in the method of valuation of the company’s forward contracts wherein it moved to markto-market valuation of outstanding forward contract, which resulted in an incremental forex gain of Rs40m and boosted net margins by 820bp for the quarter. The absence of this spike caused net margin to plummet to 9.2% from 20% in the previous quarter. Outlook and view The company maintains that the demand in the PLM market continues to be strong. The company has refrained for giving guidance for the full year, but has indicated that it would be unable to meet its earlier guidance. While we believe that the company would report revenue growth of 34.2% for the full year ending March 2006, profit growth is expected to be muted at 15.9%. The stock has corrected sharply since the company announced an earnings warning. While the growth in the second half of the year promises to be more robust, any further setback would negatively impact stock price. The stock currently trades at a PE of 12.2x FY07E earnings. Maintain Neutral.
3
Geometric Software
Geometric Software: an investment profile Company description Geometric Software is a niche player offering PLM software and services employing more than 1,000 engineers. It has relationship with eight of the top 11 software OEMs in the PLM segment and set up a JV with Dassault Systems, the largest PLM software company globally. Its key clients include Dassualt Systems, UGS PLM, Matrix One and other leaders in the PLM software segment. Its vision is to grow revenues to US$100m by FY07 from US$38m in FY05. Key investment arguments ? Largest beneficiary of increased spending by PLM Software OEMs due to established relationships ? Partnerships with IBM Global, EDS and HP enabling involvement in bidding for projects with large clients ? Offshore growth to accelerate as partnerships mature Key investment risks ? Dependent on partners for business and initiating client relationship ? Realisation from industrial clients could be lower due to revenue sharing with partners ? Rupee-based billing could increase if relationship with partners is transferred to their India centres
Recent developments ? New Application Maintenance Service launched to generate annuity billing ? IBM entered the top-10 client category Valuation and view ? Revenue growth of 34.2% and earnings growth of 16% in FY06 ? Valuations at 15.4x FY06E earnings are expensive given the muted growth prospects for the year. ? Maintain Neutral with a target price of Rs92. Sector view ? Various CIO surveys indicate increasing share of offshore spending in IT budgets ? Indian offshore vendors gaining market share in competition with MNCs ? Prefer large companies as bulk of volumes going to them while niche players benefit due to lack of offshore competition
EPS: INQUIRE FORECAST VS CONSENSUS (RS)
COMPARATIVE VALUATIONS GEOMETRIC
HEXAWARE
DATAMATICS
INQUIRE
CONSENSUS
VARIATION
FORECAST
FORECAST
(%)
P/E
FY06E
15.4
14.7
12.6
FY07E
12.2
13.7
7.5
FY06
5.6
5.9
-4.3
P/BV
FY06E
3.3
3.9
2.0
FY07
7.1
8.8
-19.3
FY07E
2.8
3.0
1.8
EV/Sales (x)
FY06E
1.9
1.9
1.3
TARGET PRICE AND RECOMMENDATION
0.8
CURRENT
RECO.
PRICE (RS)
FY07E EV/EBITDA (x)
1.4
1.5
FY06E
8.0
11.3
7.9
FY07E
5.7
9.4
4.1
TARGET
UPSIDE
PRICE (RS)
(%)
92
7.0
86
Neutral
STOCK PERFORMANCE (1 YEAR)
Geometric (Rs) - LHS
Rel. to Sensex (%) - RHS
140
SHAREHOLDING PATTERN (%)
70 SEP.05
JUN.05
SEP.04
120
Promoters
30.8
31.0
31.6
100
30
Domestic Institutions
16.6
20.2
19.5
80
10
FIIs/FDIs
19.3
16.1
13.0
Others
33.3
32.7
35.9
60 Oct-04
21 October 2005
50
Jan-05
Apr-05
Jul-05
-10 Oct-05
4
Geometric Software
I N C O M E S T A T E M ENT Y/E MARCH
Sales Change (%)
(Rs Million)
RATIOS
2003
2004
2005
2006E
2007E
Y/E MARCH
841
1,060
1,682
2,257
2,930
Basic (Rs)
26.0
58.6
34.2
29.8
34.6
2003
2004
2005
2006E
3.3
3.8
4.9
5.6
7.1
4.4
5.3
7.2
8.7
10.7
14.6
17.6
21.5
25.9
31.2
0.4
0.5
0.6
0.7
1.1
12.4
12.5
12.5
12.5
15.0
P/E
22.6
17.6
15.5
12.2
Cash P/E
16.2
12.0
10.0
8.0
EV/EBITDA
15.0
9.8
8.0
5.8
EV/Sales
4.1
2.7
1.9
1.4
Price/Book Value
4.9
4.0
3.3
2.8
Dividend Yield (%)
0.6
0.7
0.8
1.2
EPS Cash EPS
Employee Costs Travelling & Conveyance Other Operating Expenses
434
569
923
1,270
1,668
33
53
80
87
111
141
149
213
368
440
233
289
466
532
710
27.7
27.3
27.7
23.6
Book Value DPS Payout %(Incl.Div.Taxes)
2007E
Valuation (x)
EBITDA % of Net Sales
24.2
Depreciation
61
82
128
176
217
Other Income
36
64
51
99
80
PBT Tax Rate (%) PAT M inority Interest
208 18 8.8
Change (%)
29 10.5
390 70 18.1
455 76 16.8
574 86 15.0
190
242
319
379
487
19
34
44
61
73
1
0
1
0
0
Extraordinary Net Income
271
171 32.7
208
275
22.3
31.8
3 19 15.9
416 30.5
P rofitability Ratios (%) RoE
24.0
23.4
24.6
22.9
24.1
RoCE
28.7
29.9
34.6
32.5
33.3
Turnover Ratios Debtors (Days)
57
69
75
72
70
Fixed Asset Turnover (x)
1.8
1.4
1.5
1.7
1.9
0.0
0.0
0.0
0.0
0.0
2005
2006E
2007E
454
553
710
Leverage Ratio Debt/Equity Ratio(x)
BALANCE SHEET Y/E MARCH
(Rs Million) 2003
2004
2005
2006E
2007E
Share Capital
53
54
112
112
112
CASH FLOW STATEMENT
Share Premium
112
134
101
101
101
Y/E MARCH
603
773
990
1,269
1,622
768
962
1,203
1,481
1,835
43
61
73
Reserves Net Worth M inority Interest Loans
18
31
30
0
15
0
0
Capital Employed
8 16
993
1,261
1,542
1,907
Gross Block
474
780
1,111
Less : Depreciation Net Block CWIP Investments Curr. Assets
1,321
1,561
150
230
357
533
750
325
550
754
788
8 11
32
50
88
10
10
146
178
135
95
95
480
505
747
1,109
1,566
CF from Operations
(Rs Million) 2003
251
Cash for Working Capital Net Operating CF
Net Purchase of FA Net Purchase of Invest. Net Cash from Invest.
11 240
-369
-132
-240
3
-18
-61
- 19
-390
6
24
0
0
0
-40
-62
445
562
573
898
Cash Flow from Fin.
12
49
63
191
77
90 Free Cash Flow
162
15
16
460
574
5
18
48
24
30
Other Liabilites
113
184
253
320
395
Provisions
50
88
161
116
149
Net Current Assets
3 13
2 15
285
649
991
Application of Funds
8 16
993
1,261
1,542
1,907
Creditors
Net Cash Flow
0
-34
176 13
0
-26
366
462
24
-301
-30
228 14
- 151
30
200
290
-366
-24
132
13
22 688
-67
286
167
-34 587
-323
Cash & Bank Balance
Current Liab. & Prov
129 325
58
Debtors
Other Current Assets
-35 364
Dividend Payments
Loans & Advances
329
-78
Proceeds from Pvt. Place. Proceeds from LTB/STB
2004
233
-32
41
- 11
-44
-58
-52
228
-40
455 397
-62
448 325
Opening Cash Balance
53
286
176
573
Add: Net Cash
233
-58
-52
397
325
286
228
176
573
898
Closing Cash Balance
E: M OSt Estimates
21 October 2005
5
Geometric Software
For more copies or other information, contact Institutional: Navin Agarwal. Retail: Manish Shah, Mihir Kothari Phone: (91-22) 56575200 Fax: (91-22) 22885038. E-mail:
[email protected] This report is for the personal information of the authorized recipient and does not construe to be any investment, legal or taxation advice to you. Motilal Oswal Securities Limited (hereinafter referred as MOSt) is not soliciting any action based upon it. This report is not for public distribution and has been furnished to you solely for your information and should not be reproduced or redistributed to any other person in any form. The report is based upon information that we consider reliable, but we do not represent that it is accurate or complete, and it should not be relied upon such. MOSt or any of its affiliates or employees shall not be in any way responsible for any loss or damage that may arise to any person from any inadvertent error in the information contained in this report. MOSt or any of its affiliates or employees do not provide, at any time, any express or implied warranty of any kind, regarding any matter pertaining to this report, including without limitation the implied warranties of merchantability, fitness for a particular purpose, and non-infringement. The recipients of this report should rely on their own investigations. MOSt and/or its affiliates and/or employees may have interests/ positions, financial or otherwise in the securities mentioned in this report. To enhance transparency, MOSt has incorporated a Disclosure of Interest Statement in this document. This should, however, not be treated as endorsement of the views expressed in the report. Disclosure of Interest Statement 1. Analyst ownership of the stock 2. Group/Directors ownership of the stock 3. Broking relationship with company covered
Geometric Software No No No
MOSt is not engaged in providing investment-banking services. This information is subject to change without any prior notice. MOSt reserves the right to make modifications and alternations to this statement as may be required from time to time. Nevertheless, MOSt is committed to providing independent and transparent recommendations to its clients, and would be happy to provide information in response to specific client queries.
21 October 2005
6