Wear 255 (2003) 1314–1322
Head–disk contact detection in the hard-disk drives Andrei Khurshudov∗ , Peter Ivett IBM, Storage System Division, 5600 Cottle Road, Bld. 28/C202, San Jose, CA 95193, USA
Abstract The increasing capacity of current hard-disk drives places a great importance on reliability, as tens of gigabytes of data can be lost in an instant due to a single tribological failure event. To improve the reliability of the head–disk interface there is a need to predict, measure and monitor any interactions during manufacture. This paper discusses some different techniques that can be used for head–disk contact detection. These techniques range from a traditional acoustic emission method to some drive specific tests, such as thermal asperity (TA) detection and variable gain amplifier (VGA) signal measurements. The paper also discusses the merits of these techniques and ways to theoretically predict contact. © 2003 Published by Elsevier Science B.V. Keywords: Head–disk contact; Magnetic hard-disk drive; Detection techniques; Reliability
1. Introduction The areal recording density on rigid magnetic disks continues to increase, consequently, so do the challenges associated with producing a robust head–disk interface (HDI). Smoother disk surfaces, reduced carbon overcoat thickness, and lower flying heads increasingly stress the HDI and impact tribological reliability. At the same time, drive reliability requirements remain unchanged or increase with time. For example, the industry-standard reliability demonstration test (RDT) requires no more than about 1% of drives failures over 1000 power-on hours for a population of 1000 server-class (100% duty cycle) drives. This means that of 1000 drives reading and writing constantly for almost 42 days, only about 10 drives are allowed to have even one of those so-called hard errors or unrecoverable errors, which result in data loss. Clearly, this requirement is hard to meet without having a robust and predictable HDI. One positive thing about the HDI of the magnetic hard-disk drive (HDD) is that if there is no slider (or head)–disk contact then there is almost no danger of tribological problems and following errors. However, the slider–disk contact can be caused by numerous mechanisms: • Drive particulate contaminants [1] or wear products [1], when a particle gets stuck between the slider and the disk. • Disk lubricant via formation of liquid bridges [2], dynamically established roughness [3,4], or lubricant dewetting mechanism [5]. ∗ Corresponding author. Tel.: +1-408-578-1652; fax: +1-408-256-7842. E-mail address:
[email protected] (A. Khurshudov).
0043-1648/03/$ – see front matter © 2003 Published by Elsevier Science B.V. doi:10.1016/S0043-1648(03)00201-1
• Disk corrosion [1]. • And finally, by direct slider–disk interaction. The consequences of this interaction range from “soft magnetic errors” (see below) to “thermal asperities” (see below) and to severe media damage, that can lead to a complete mechanical and magnetic drive failure. Besides causing unrecoverable (“hard”) errors, slider–disk contacts in the HDD may cause the so-called “soft” errors or events where multiple-retries are required to retrieve the information stored on the disk. Moving particles on the disk or slider, pools and droplets of the lubricant, non-repeatable disk run-out, and other phenomena may cause this type of error, but they do not necessarily threaten drive’s reliability. However, they may strongly affect its performance (since retries lower the rate at which the “useful” data is transferred). The purpose of this study is to test and compare different techniques for slider–disk contact detection using working HDDs. The techniques used in this study range from traditional acoustic emission (AE) measurements to some drive-specific techniques such as variable gain amplifier (VGA) signal detection and thermal asperity (TA) detection techniques. 2. Experimental All experiments in this study were so-called “drive-level” experiments, where a fully functional working drive equipped with an AE sensor was “questioned” via the Small Computer System Interface (SCSI, pronounced “scuzzy”)
A. Khurshudov, P. Ivett / Wear 255 (2003) 1314–1322
bus in order to obtain information about its status. IBM HDDs inside computer-controlled low-pressure chambers were used in this work. In most experiments, slider–disk clearance was intentionally reduced to promote contacts. The main method of bringing the slider, which was initially flying at the nominal flying height of 22–23 nm, into contact with the disk (or reducing the slider–disk clearance), was an air pressure reduction. The AE techniques [6] used in this study are based on measurements of elastic stress waves propagating in solids from such sources as zones of elastic or/and plastic deformation, cracks, etc. The AE sensor, which mainly consists of a piezo-electric crystal (PZT) crystal, is attached near the source of elastic waves. The signal is usually conditioned (amplified and filtered) to obtain the highest signal-to-noise ratio and to “target” some specific frequency range of interest. In our experiments, AE sensor (from Physical Acoustics Co.) was attached to the actuator screw on the top cover of the drive or to the actuator arm of the upper suspension inside the drive. The signal was amplified by 40 dB and filtered out below 600 kHz and above 3 MHz to “view” the slider body resonance frequencies (which start from ∼1.2 MHz). In the case when AE sensor was attached to the actuator arm of the upper suspension, an opening was cut in the cover of the drive in order to fit-in the AE sensor and to physically attach it to the suspension. The latter technique is, however, intrusive and the results we have obtained could have been affected to an unknown extent. The VGA signal is the signal coming from the internal drive circuitry, which conditions the raw read-back signal from the disk in order to keep its amplitude within some optimal range. For example, if the read-back signal is too
1315
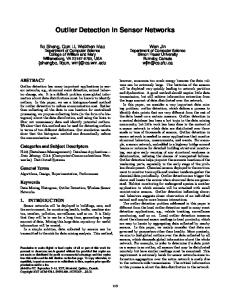
weak (e.g. the magnetic head is flying too high), then the VGA circuit increases the signal amplification (or gain). If the signal is too strong (e.g. the head is flying too close to the disk), the VGA circuit will reduce signal amplification. Therefore, the VGA signal is roughly proportional (but not linearly proportional) to the magnetic spacing, and the change in VGA signal can be often only attributed to flying height change. The TA is an event registered when the magneto-resistive (MR) read element of the slider touches the disk surface. Since this contact takes place at high speed, then some element heating takes place, and the base line of the raw read-back magnetic signal moves away from its normal position (see Fig. 1). This base-line shift occurs very quickly (in the order of a fraction of a millisecond) and disappears as quickly with cooling of the MR stripe. However, the temperature rise can be so high that the MR stripe electrical resistance can change far beyond the expected range thereby increasing (or decreasing—depending on the circuit polarity) the signal beyond its saturation threshold making it unreadable to the drive’s circuitry. This type of error could be intermittent (recoverable, or “soft”) or permanent (“hard”). TA events have a degrading effect on drive performance and reliability. However, the TA-detection technique itself is a good way of studying slider–disk interactions, or, more precisely, contacts between the MR element and the disk surface. In this study, all of the three above techniques were used to investigate slider–disk contacts. Many of the tests that involved high-speed low air-pressure contacts between the slider and disk were destructive and, therefore, new drives were used in each of these tests.
Fig. 1. The drive’s so-called “scope trace” showing the TA event. The base line of the raw read-back signal “takes a quick dive” when the MR sensor touches the disk and also recovers quickly after the sensor cools down. The entire event takes about 0.2 us time.
1316
A. Khurshudov, P. Ivett / Wear 255 (2003) 1314–1322
Fig. 2. AE measurements done on the drive with the opening in the top cover indicate the predominant slider–disk contact to occur at about 0.22–0.30 atm. The measurements also show some increase in AE activity starting from ∼0.5 atm.
3. Results and discussion Fig. 2 shows the results of AE measurements done on the one drive with the opening in the top cover. The AE signal stays relatively unchanged while the air pressure is slowly reduced down to ∼0.5 atm (∼50 kPa), when some increase in AE activity is observed. When the pressure is reduced even further, the signal starts increasing rapidly indicating the transition from “occasional” contacts (when the slider infrequently touches isolated disk locations) to “predominant” contact, when the slider starts rubbing on the surface of the disk. These results indicate that the predominant slider–disk contact occurs for this drive at about 0.22 atm (∼22 kPa) to 0.30 atm (∼30 kPa). This type of measurements using AE has both advantages and disadvantages. The main advantage is that the AE sensor is mounted as close to the HDI as possible, which keeps signal losses (both signal power and frequency content) to a minimum. One disadvantage is that the measurement is done for one HDI only, while other HDIs in the drive are too far away from the sensor and their contribution to AE signal is too small to extract any useful information about their state during the test. Another disadvantage is, of course, the need to cut the opening in the drive cover to mount the sensor onto a flexible slider suspension arm, which may change the slider–disk interaction in some uncontrollable and unknown way (e.g. increase the suspension pre-load, twist and bend the suspension, change the flying height of the slider, etc.). Fig. 3 shows the results of AE measurements done on the closed drive with the AE sensor attached to the voice-coil actuator securing screw on the top of the drive cover. Again, the “predominant” slider–disk contact occurs in the range of about 0.25–0.30 atm (or ∼25–30 kPa). The mea-
surements also show some change in AE response starting from ∼0.4 atm (∼40 kPa), which may be an indicator of increasing “occasional” contacts. Fig. 4 shows AE measurements on five closed drives indicating that the predominant slider–disk contact in those drives takes place at about 0.25–0.33 atm. AE signal activity for two or three of these drives starts increasing almost immediately as the air pressure is reduced, which may be an indicator of the occasional contacts from ∼0.9 atm (∼90 kPa). The above measurements indicate that there appears to be two distinct types or states of slider–disk contact: “occasional”, when the slider and disk do not interact very frequently and the contacts take place only at a few isolated locations on the disk, and “predominant”, when the slider is rubbing on the disk (while still being partially supported by the air-bearing). The question is how to better evaluate these two different states of contact experimentally? For this purpose, VGA and TA measurements could be useful. Firstly, let us study the case of “predominant” contact. Fig. 5 presents VGA measurements at the very outer diameter (OD) of the fully functional closed drive. The most interesting part of this curve, which approximately represents a change in the magnetic spacing between the slider and disk with the decreasing air pressure, is the range where the data curves start forming a “knee” at low pressure. The reason for this “knee” is that the slider starts making high-speed contact with the disk, and the friction force applies a torque to the slider in such a way that it pitches forward thus lifting the trailing edge, with the magnetic element. Therefore, the distance between the element and magnetic layer increases, reversing the trend with decreasing air pressure. The point of the physical touchdown can be associated with the curve minimum for each slider in the drive. Apparently, different
A. Khurshudov, P. Ivett / Wear 255 (2003) 1314–1322
1317
Fig. 3. AE measurements done on the closed drive with the AE sensor attached to the voice-coil actuator screw on the top of the cover indicate the predominant slider–disk contact to occur at about 0.25–0.30 atm. The measurements also show some increase in AE activity starting from ∼0.4 atm.
sliders have different initial flying height and slightly different pressure-sensitivities, which result in a range of the contact pressures. The measurements in Fig. 5 indicate that the “predominant” slider–disk contact—or the initial slider touchdown—took place at about 0.20–0.28 atm. Since the test is on a single data track, the occasional contacts are too few to be reliably detected by this technique. But, VGA signal measurements can reliably estimate a transition to slider–disk sliding.
When this technique for detection of the “predominant” contact is established, let us try to use the TA scan as a way to investigate individual or “occasional” contacts. Fig. 6 shows a full-surface TA scan for all head–disk interfaces inside the drive made at two air pressures: at 1 atm (circles) and at 0.7 atm (+). This figures show the coordinates of detected TA events using sectors and cylinders, which are the logical coordinates used to locate the data in the drive. Numbering of the cylinders in a drive starts from the OD of the disks and continues towards the inner
Fig. 4. AE measurements on five closed drives indicate that the predominant slider–disk contact in those drives takes place at about 0.25–0.33 atm. Occasional contacts start from ∼0.9 atm in 20–30% drives.
1318
A. Khurshudov, P. Ivett / Wear 255 (2003) 1314–1322
Fig. 5. VGA measurements are done at the very OD of the disks in the drive. The measurements indicate that the predominant slider–disk contact—or slider touchdown—takes place at about 0.20–0.28 atm. Occasional contacts cannot be reliably detected by this technique.
diameter (ID) of the disks. Assigning numbers to the sectors is less straightforward and falls outside the scope of this paper, but is done in the circumferential direction for the disks. The main observations from Fig. 6 are (a) There are more TA events (contacts) at 0.7 atm than at 1 atm, which correlates with the predictions of increasing number of “occasional” contacts from the AE measurements. (b) Only a few of these TA events are repeatable at both pressures, which may be an indicator of a few
things. For example, these TA events can be caused by moving particles, by lubricant droplets, lubricant roughness effects, lubricant pooling, etc., which could cause the same results. This could be also a result of a non-repeatable disk run-out, which prevents repeatable contacts at the very same locations. All of these mechanisms were already mentioned in the introduction and are studied in several previous publications [1–5]. If the TA technique is used to study both the “occasional” contact and the “predominant” contact, and the drive
Fig. 6. A full-surface TA scan for all head–disk interfaces inside the drive made at two air pressures: at 1 atm (circles) and at 0.7 atm (+). Horizontal axis shows sectors of the TA events, and the vertical axis shows cylinders.
A. Khurshudov, P. Ivett / Wear 255 (2003) 1314–1322
1319
Fig. 7. Full-surface TA scans for all head–disk interfaces inside the drive at different air pressures: at 1, 0.7, 0.4, 0.30, 0.25, and 0.20 atm. At 0.20 atm, the number of TA events becomes very large. Horizontal axis shows sectors of the TA events, and the vertical axis shows cylinders.
(a different one) is pumped-down, then the following picture will emerge (see Fig. 7). Some TA events will appear and disappear until the pressure becomes substantially low—about 0.4 atm, which corresponds to about 8 nm loss in the slider’s flying height relative to it flying at 1 atm. The range of pressure from 1 to 0.7 atm represents (for this specific drive) the range of non-repeatable “occasional” slider–disk contact. When the pressure is reduced even further, more and more contacts take place and more and more of those contacts become repeatable TA events. In the pressure range of 0.20–0.25 atm, the number of TA events becomes very large indicating transition to “predominant” slider–disk contact. Fig. 8 re-plots the data from Fig. 7 in a way similar to that in Figs. 2–5. A summary of the merits of all three techniques is shown in Table 1. It seems that all the techniques agree well on their predictions.
It is interesting to find a good method of predicting the above-presented experimental results using some kind of theoretical or empirical model. For example, one way is to analyze the lubrication modes (e.g. [7,8]) for a given drive design at different pressure levels and see if this technique can predict the predominant or occasional contact mode. The main parameter used ([7,8], etc.) to estimate the lubrication regime in a tribological system is the dimensionless parameter Λ, which is the ratio of the thickness of the film h (liquid or gas) to the equivalent r.m.s. roughness of both contacting surfaces, Rq = (Rq21 + Rq22 )0.5 . Using Λ parameter, three major regimes of lubrication can be defined in general as follows: • Boundary lubrication: the entire load is carried by the surface asperities, Λ < 1. Friction force in this mode is high.
Table 1 Technique
Predominant contact (atm)
Occasional contact (atm)
Best application
VGA TA AE
0.20–0.28 0.20–0.25 0.25–0.33
N/A 0.25–1.0 0.33–0.9
Predominant contact detection Occasional contact detection, but can be used for both Both, but less accurate
1320
A. Khurshudov, P. Ivett / Wear 255 (2003) 1314–1322
Fig. 8. This figure re-plots the data from Fig. 7 in a way similar to that in Figs. 2–5. This plot indicates that the predominant slider–disk contact takes place at about 0.20–0.25 atm. Occasional contacts for this drive start at 1 atm, while the repeatable occasional contacts start at 0.4 atm. Horizontal axis shows sectors of the TA events, and the vertical axis shows cylinders.
• Thin-film lubrication (or mixed lubrication): part of the load is carried by the asperities and the rest is carried by the film (air-bearing generated air film), 1 < Λ < 3–5. When is this regime, the friction is rising rapidly from very low (flying) to high (sliding). • Thick-film lubrication: the total separation of asperities by the (air) film is many times larger than the size of the surface roughness. The (air) film predominantly carries the load, Λ > 5. In this mode, the friction is usually very low. If this approach is used for the HDD design discussed in this work, then the main lubrication regime predicted for al-
most the entire pressure range would be the thick-film lubrication regime, as shown in Fig. 9. It has to be mentioned that the majority of HDDs are designed to operate in the pressure range from 1 to 0.7 atm (or ∼70 kPa, which equals the pressure at the altitude of ∼10,000 feet). Our estimation (see Fig. 9) for this pressure range shows that the Λ parameter changes from 13 to 16 indicating that the slider–disk separation is about 13–16 times larger than the equivalent r.m.s. roughness of both surfaces, which means a complete separation of the surfaces. An attempt to predict the ‘predominant’ contact using this approach yields a quite satisfactory result: according to the Λ-based approach, the transition from a thick-film lubrication regime to a thin-film lubrication (or
Fig. 9. The dimensionless slider flying height (Λ) is shown as a function of air pressure. The flying height curve intercepts the estimated upper boundary of the mixed lubrication regime at about 0.18 atm.
A. Khurshudov, P. Ivett / Wear 255 (2003) 1314–1322
1321
Fig. 10. The slider flying height is shown as a function of air pressure. The flying height curve intercepts the upper boundary of the mixed lubrication regime (TOH level) at about 0.17 atm.
mixed lubrication) should take place at the air pressure as low as ∼0.18 atm, which is not far off the experimentally observed transitional range of 0.2–0.3 atm. Therefore, one may conclude that the Λ-based approach may be used for estimations of slider–disk separation in the HDDs. However, we do not believe that this conclusion is a general one since the disk and slider roughness are just two of many parameters affecting the slider–disk clearance. For example, this model does not consider possible effects of the disk waviness, slider air-bearing design (shape), lubricant dynamic roughness, and some other parameters that are known to affect the clearance. Therefore, even if the Λ-based approach in this work was able to predict slider–disk contacts relatively well, we believe that this is rather coincidental than real, and another model may be required to support the Λ-based model. Another way to predict a transition to the “predominant” contact is to use a so-called “take-off height” (TOH) of the disk (or the “glide-height avalanche” value), which is routinely measured for the rigid magnetic recording disks. The TOH is the lowest flying height the slider could achieve on a given disk and is, therefore, an empirically obtained parameter, which takes into account disk waviness, lubricant dynamic roughness, etc. However, the slider used in this test is not the very same slider used in the drive, but is a specially made slider equipped with the PZT sensor mounted directly onto the slider. This provides for very high sensitivity to slider–disk contacts and, in combination with an elaborate calibration procedure, allows for detecting TOH values down to a few nanometers. Unfortunately, the sliders used in the drive are not equipped with any sensors but magnetic read and write heads.
Fig. 10 shows the model based on the TOH approach that predicts the transition from thick-film lubrication to the mixed lubrication at about 0.17 atm, which is in perfect agreement with the Λ-based model, and also is in a good agreement with the experimental results. It seems that the best approach to predicting the transition to ‘predominant’ contact or mixed lubrication regime in the HDD is to use both models to obtain the whole range of air pressures. Apparently, the models discussed above give a good estimate of when the slider starts touching the disk. Unfortunately, predicting the ‘occasional’ contacts is not as straightforward as predicting the ‘predominant’ contact. Slider–disk interaction at high pressure (and larger clearances) is very statistical in nature and also is very disk and slider specific. This means that some isolated disk defects or some very low-flying sliders (or the combination of both) may produce lots of occasional (and often repeatable) contacts even when the model predicts large slider–disk clearance. Also, the variation in ‘occasional’ contacts from drive to drive is usually very large, while the transition to the ‘predominant’ contact is more-or-repeatible for the same family of drives.
4. Conclusions 1. Two different slider–disk contact modes are discussed in this study: the ‘occasional’ contact mode, when the contacts (repeatable or not) take place at some isolated disk locations only and the ‘predominant’ mode, when the slider is rubbing on the disk (while still being partially supported by the air-bearing). The changes of the
1322
A. Khurshudov, P. Ivett / Wear 255 (2003) 1314–1322
slider–disk interface were investigated while the transition from one mode to another is forced using decreasing air pressure. 2. Three different experimental techniques for detecting slider–disk contacts in the HDDs were demonstrated and compared in this work. While all three measurements— AE, VGA, and TA scans—correlated well on predicting the transition to ‘predominant’ slider–disk contact in the pressure range of 0.2–0.3 atm, they (AE and TA scan) also predicted ‘occasional’ slider–disk contacts for almost the entire operating pressure range of the drive. Further analysis of TA scans shows that the great majority of high-pressure contacts are non-repeatable in nature. 3. Two models were discussed, compared and found to be correlating relatively well with each other (and with the experimental results) in predicting the pressure when the ‘predominant’ slider–disk contact would first occur. Use of both models for the drive analysis is recommended in order to increase the accuracy of predictions.
References [1] A. Khurshudov, R.J. Waltman, Tribology challenges of modern magnetic hard disk drives, Wear 251 (2001) 1124–1132. [2] A. Khurshudov, P. Baumgart, R.J. Waltman, In-situ quantitative analysis of nano-scale lubricant migrations at the slider–disk interface, Wear 225–229 (1999) 690–699. [3] A. Khurshudov, R.J. Waltman, The contribution of thin PFPE lubricants to slider–disk spacing, Tribol. Lett. 11 (3–4) (2001) 143– 149. [4] R.J. Waltman, A.G. Khurshudov, The contribution of thin PFPE lubricants to slider–disk spacing. 2. Effect of film thickness and lubricant end groups, Tribol. Lett., submitted for publication. [5] R.J. Waltman, A. Khurshudov, G.W. Tyndall, Tribol. Lett., in press. [6] A. Khurshudov, F.E. Talke, A study of sub-ambient pressure tri-pad sliders using acoustic emission, ASME Trans., J. Tribol. 120 (1996) 54–59. [7] H.S. Cheng, Lubrication regimes, ASM Handbook, vol. 18, Friction, Lubrication, and Wear Technology, ASM International, 1992, pp. 89–97. [8] G.-L. Chen, J. Huan, The effect of lubricant–roughness ratio, lambda (Λ), on tribological performance of magnetic thin film disks, IEEE Trans. Magn. 29 (6) (1993) 3936–3938.