Heart Transplant Outcome Prediction using UNOS Data Ankit Agrawal
Jaishankar Raman
Dept. of Electrical Engineering and Computer Science Northwestern University 2145 Sheridan Rd Evanston, IL 60201 USA
Section of Cardiothoracic & Vascular Surgery Department of Surgery Rush University Medical Center Chicago, IL USA
[email protected]
[email protected] Mark J. Russo Department of Cardiothoracic Surgery Center for Aortic Diseases Barnabas Health Heart Centers Livingston, NJ 07039 USA
[email protected]
Alok Choudhary Dept. of Electrical Engineering and Computer Science Northwestern University 2145 Sheridan Rd Evanston, IL 60201 USA
[email protected]
ABSTRACT
Keywords
We analyze heart transplant data from the United Network for Organ Sharing (UNOS) program with the aim of developing accurate risk prediction models for mortality within 1 year of heart transplant using data mining techniques. The data used in this study is de-identified and consists of 50 predictor attributes, and 1-year posttranplant survial outcome for patients who underwent heart transplant between the years 2000 and 2009. Our dataset had 19,429 such patient instances. Several data mining classification techniques were used on this data along with various data mining optimizations and validations to build predictive models for the abovementioned outcome. Prediction results were evaluated using c-statistic metric, and the highest c-statistic obtained was 0.656. Further, we also applied feature selection techniques to reduce the number of attributes in the model from 50 to 8, while trying to have minimal degradation in c-statistic (0.645). We believe the resulting predictive model on the reduced dataset can be quite useful to integrate in a risk calculator to aid both physicians and patients in risk assessment.
Biomedical informatics, Heart transplant, Decision making, Predictive modeling
Categories and Subject Descriptors H.2.8 [Database Applications]: Data mining; J.3 [Life and Medical Sciences]: Medical information systems
Permission to make digital or hard copies of all or part of this work for personal or classroom use is granted without fee provided that copies are not made or distributed for profit or commercial advantage and that copies bear this notice and the full citation on the first page. Copyrights for components of this work owned by others than ACM must be honored. Abstracting with credit is permitted. To copy otherwise, or republish, to post on servers or to redistribute to lists, requires prior specific permission and/or a fee. Request permissions from
[email protected].. KDD-DMH’13, August 11, 2013, Chicago, Illinois, USA. c 2013 ACM 978-1-4503-2174-7/13/08 ...$15.00. Copyright
1.
INTRODUCTION
A heart transplant, or a cardiac transplant, is a surgical transplant procedure performed on patients with end-stage heart failure or severe coronary artery disease [7]. As of 2009, the survival rates for heart transplant after 1 year were 88.0% in males and 86.2% in females [30]. Typical expenses during the first year (everything including surgery, hospitalization, lab testing, medications) average around $800,000 [2, 5]. Given the critical scarcity of organs available for transplant (about 2,500 available every year [1] compared to 60,000 potential recepients [35]), achieving maximal benefit from heart transplantation depends upon improved recipient and donor selection [31]. Thus accurate estimation of heart transplant outcomes can improve both informed patient consent by helping patients better understand its risks and benefits, and also aid the physicians in decision making by assessing the true patient-specific risks of the operation, rather than relying on population-wide risk assessments. To this end, accuarate outcome prediction of performing transplantation is extremely important. The United Network for Organ Sharing (UNOS) is a private, non-profit organization that manages the nation’s organ transplant system under contract with the federal government [12]. UNOS is involved in many aspects of the organ transplant and donation process, including maintaining the database that contains all organ transplant data for every transplant event that occurs in the US. Applying data mining techniques to heart transplantation data can be useful to rank and link pretransplantation attributes to the outcome. Here we use data mining techniques on UNOS heart transplantation data to estimate 1-year survival of heart transplant patients, based on pretransplant
characteristics. Experiments with nearly 50 modeling techniques were conducted and the results compared to find the best model for the data used in this study. It was found that rotation forest ensembles of alternation decision trees resulted in the best discrimination (c-statistic) between survived and non-survived heart recepients. Further, feature selection was used to find a smaller subset of attributes that can potentially achieve similar prediction performance, but can result in a simpler model. The rest of the paper is organized as follows: Section 2 describes the data mining techniques used in this study followed by a brief description of the UNOS data used in this study in Section 3. Experiments and results are presented in Section 4, and the conclusion and future work is presented in Section 5.
2.
DATA MINING TECHNIQUES
2.1
Modeling
We used 47 classification schemes in this study, including both direct application of classification techniques and also constructing their ensembles using various ensembling techniques. Due to space limitations, here we briefly describe only those classification/ensembling techniques whose results we present in the next section. 1. Support vector machines: SVMs are based on the Structural Risk Minimization(SRM) principle from statistical learning theory. A detailed description of SVMs and SRM is available in [33]. In their basic form, SVMs attempt to perform classification by constructing hyperplanes in a multidimensional space that separates the cases of different class labels. It supports both classification and regression tasks and can handle multiple continuous and nominal variables. 2. Artificial neural networks: ANNs are networks of interconnected artificial neurons, and are commonly used for non-linear statistical data modeling to model complex relationships between inputs and outputs. The network includes a hidden layer of multiple artificial neurons connected to the inputs and outputs with different edge weights. The internal edge weights are ’learnt’ during the training process using techniques like back propagation. Several good descriptions of neural networks are available [14, 18]. 3. Decision Table: Decision table typically constructs rules involving different combinations of attributes, which are selected using an attribute selection search method. Simple decision table majority classifier [28] has been shown to sometimes outperform state-of-the-art classifiers. 4. KStar: KStar [17] is a lazy instance-based classifier, i.e., the class of a test instance is based upon the class of those training instances similar to it, as determined by some similarity function. It differs from other instance-based learners in that it uses an entropybased distance function. 5. Reduced error pruning tree: Commonly known as REPTree [34], it is a implementation of a fast decision tree learner, which builds a decision/regression tree
using information gain/variance and prunes it using reduced-error pruning. 6. Random forest: The Random Forest [16] classifier consists of multiple decision trees. The final class of an instance in a Random Forest is assigned by outputting the class that is the mode of the outputs of individual trees, which can produce robust and accurate classification, and ability to handle a very large number of input variables. It is relatively robust to overfitting and can handle datasets with highly imbalanced class distributions. 7. Alternating decision tree: ADTree [19] is decision tree classifier which supports only binary classification. It consists of two types of nodes: decision nodes (specifying a predicate condition, like ’age’ > 45) and prediction nodes (containing a single real-value number). An instance is classified by following all paths for which all decision nodes are true and summing the values of any prediction nodes that are traversed. This is different from the J48 decision tree algorithm in which an instance follows only one path through the tree. 8. Decision stump: A decision stump [34] is a weak tree-based machine learning model consisting of a singlelevel decision tree with a categorical or numeric class label. Decision stumps are usually used in ensemble machine learning techniques. 9. Naive Bayes: The naive bayes classifier [22] is a simple probabilistic classifier that is based upon the Bayes theorem. This classifier makes strong assumptions about the independence of the input features, which may not always be true. It makes use of the variables contained in the data sample, by observing and relating them individually to the target class, independent of each other. Despite this assumption, the naive bayes classifier works well in practice for a wide variety of datasets and often outperforms other complex classifiers. 10. Bayesian Network: A Bayesian network is a graphical model that encodes probabilistic relationships among a set of variables, representing a set of random variables and their conditional dependencies via a directed acyclic graph (DAG). Bayesian network learning can be used with various search algorithms for searching the network structures, and estimator algorithms for finding the conditional probability tables of the network. 11. Logistic Regression: Logistic Regression [26] is used for prediction of the probability of occurrence of an event by fitting data to a sigmoidal S-shaped logistic curve. Logistic regression is often used with ridge estimators [29] to improve the parameter estimates and to reduce the error made by further predictions. 12. AdaBoost: AdaBoost [20] is a commonly used ensembling technique for boosting a nominal class classifier. In general, boosting can be used to significantly reduce the error of any weak learning algorithm that consistently generates classifiers which need only be a
little bit better than random guessing. It usually dramatically improves performance, but is also prone to overfitting. 13. LogitBoost: The LogitBoost algorithm is an ensembling technique implementation of additive logistic regression which performs classification using a regression scheme as the base learner, and can handle multiclass problems. In [21], the authors explain the theoretical connection between Boosting and additive models. 14. Bagging: Bagging [15] is a meta-algorithm to improve the stability of classification and regression algorithms by reducing variance. Bagging is usually applied to decision tree models to boost their performance. It involves generating a number of new training sets (called bootstrap modules) from the original set by sampling uniformly with replacement. The bootstrap modules are then used to generate models whose predictions are averaged to generate the final prediction. Bagging has been shown work better with decision trees than with linear models. 15. Random subspace: The Random Subspace classifier [25] constructs a decision tree based classifier consisting of multiple trees, which are constructed systematically by pseudo-randomly selecting subsets of features, trying to achieve a balance between overfitting and achieving maximum accuracy. It maintains highest accuracy on training data and improves on generalization accuracy as it grows in complexity. 16. Rotation Forest: Rotation forest [32] is a method for generating classifier ensembles based on feature extraction, which can work both with classification and regression base learners. The training data for a the base classifier is created by applying Principal Component Analysis (PCA) [27] to K subsets of the feature set, followed by K axis rotations to form the new features for the base learner, to encourage simultaneously individual accuracy and diversity within the ensemble.
2.2
Feature Selection
Feature selection techniques are typically used to select a subset of relevant features for use in a model. It is based on the assumption that data contains many redundant or irrelevant attributes that do not add much to the information provided by other existing attributes. We used 2 feature selection techniques in this study: 1. Correlation Feature Selection (CFS): CFS is used to identify a subset of features highly correlated with the class variable and weakly correlated amongst them [23]. CFS was used in conjunction with a greedy stepwise search to find a subset S with best average merit, which is given by: M eritS = p
n.rf o n + n(n − 1).rf f
where n is the number of features in S, rf o is the average value of feature-outcome correlations, and rf f is the average value of all feature-feature correlations.
2. Information Gain: This is used to assess the relative predictive power of the predictor attributes, which evaluates the worth of an attribute by measuring the information gain with respect to the outcome status: IG(Class, Attrib) = H(Class) − H(Class|Attrib) where H(.) denotes the information entropy. The CFS technique evaluates subsets rather than individual attributes, so it was first used to find a smaller subset of attributes. Subsequently, information gain was used on the reduced set of attributes to get a ranking of the attributes in the order of their predictive potential, as information gain evaluates each attribute independently.
3.
UNOS DATA
All individuals aged 18 years and older undergoing heart transplantation between 2000 and 2009 in the United States were part of the study population, with a total of 19,429 patients, and 50 attributes were assessed. The outcome variable was 1-year survival. We omit the details of all the input 50 attributes here due to space constraints. A brief description of the selected subset 8 attributes used in the final model is presented later. Out of 19,429 patients, 2,615 patients (13.46%) did not survive more than 1 year after transplant.
4.
EXPERIMENTS AND RESULTS
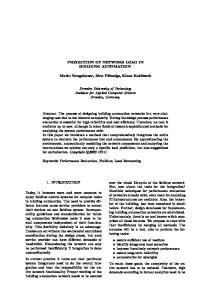
We used the WEKA toolkit 3.6.7 for the implementation of data mining techniques described earlier [24]. 3-fold crossvalidation was used for evaluation. Cross-validation is routinely used to evaluate the prediction performance of data mining models to eliminate any chances of over-fitting. In k-fold cross-validation, the input data is randomly divided into k segments. k − 1 segments are used to build the model and the remaining 1 segment unseen by the model is used to test/evaluate it. This is repeated k times with different test segments, and the results are aggregrated. In this way, each instance of the dataset is run through a model that has not seen it during the training phase. Running a test instance through a trained model generates a probability distribution for that instance to belong to different possible class values (here, binary 1-year survival). Area under the ROC curve, or c-statistic was used as the metric for model evaluation, as it measures the ability of the model to effectively discriminate between cases and non-cases. As mentioned before, we used 47 classification schemes on this data. Fig. 1 present the results on 15 classification schemes for 1-year survival, consisting of most of the popular classifiers. For each of the ensembling techniques, many underlying classfiers were tried in the experiments but only the one with the best c-statistic is preented in the figure. Blue bars represent the c-statistic with the entire set of 50 attributes, and red bars represent the results with the reduced set after feature selection. Using correlation based feature selection (CFS) technique yielded a subset of only 8 features for the given outcome of 1-year survival. In Fig. 1, the technique that resulted in the best c-statistic is placed at extreme right. The number on top of the each bar is the corresponding c-statistic. The numbers in brown represent that the c-statistic is significantly lower than the best model at p=0.05. Other numbers in black indicate that
Figure 1: Prediction performance comparison for 1-year survival in terms of area under the ROC curve (c-statistic).
Figure 2: Relative information gain of features resulting from the CFS technique for 1-year survival.
the performance is not statistically distinguishable from the best model at p=0.05. The figures clearly show that many of the evaluated classification schemes perform comparably well for 1-year survival. Of all the models used in this study, Rotation Forest with Alternate Decision Trees as the underlying classifier gave the best c-statistic of 0.656 with 50 attributes, and of 0.645 with 8 attributes. Thus, feature selection techniques were able to identify a much smaller subset without a significant loss in c-statistic. Figure 2 presents the relative predictive power of the resulting smaller subset of attributes identified by CFS for 1-year survival. Following is a brief description of these 8 attributes: 1. Estimated GFR at time of aortic cross clamp: Glomerular filtration rate (GFR) is a test used to check how well the kidneys are working. Specifically, it estimates how much blood passes through the tiny filters in the kidneys (glomeruli) per minute [6]. An aortic cross-clamp is a surgical instrument used in cardiac surgery to clamp the aorta and separate the systemic circulation from the outflow of the heart [3]. 2. Intubated at transplant: Intubation refers to the insertion of a tube into an external or internal orifice of the body for the purpose of adding or removing fluids [9]. This is a binary attribute. 3. Hemodialysis at transplant: Hemodialysis is a method that is used for extracorporeal removal of waste products such as creatinine and urea and free water from the blood when the kidneys are in a state of renal failure [8]. This is also a binary variable. 4. Time spent on the list before transplantation: Patients who are determined to be eligible for a heart transplant are placed on a waiting list. This waiting list is part of a national allocation system for donor organs run by the Organ Procurement and Transplantation Network (OPTN) [13]. 5. Age of donor: The age of the donor heart (contiunous attribute). 6. MCS, explant of VAD at transplant: Mechanical circulatory support (MCS) therapy boosts hemodynamic function in failing hearts via ventricular assist devices (VADs). For cardiac transplant-eligible patients waiting for a donor heart, MCS can provide Bridge-to-Transplantation Therapy, both for intermediate support and for optimization of long-term transplant outcomes [11]. This is a binary attribute. 7. Ischemic time of the organ: The time that an organ is outside the body when the heart is not beating or supplied with oxygen by the coronary arteries [10]. This is a contiunous attribute. 8. ECMO at transplant: Extracorporeal membrane oxygenation (ECMO) is an extracorporeal technique of providing both cardiac and respiratory support oxygen to patients whose heart and lungs are so severely diseased or damaged that they can no longer serve their function [4]. This is a binary attribute.
We believe that the preliminary results obtained in this work are quite encouraging and the fact that we can significantly reduce the number of attrbutes in the model without sacrificing much on the front of accuracy motivates integration of such models in clinical decision making.
5.
CONCLUSION AND FUTURE WORK
In this workshop paper, we present our preliminary results of data mining on UNOS data on heart transplantation outcome. We evaluated nearly 50 classification schemes for predicting 1-year survival after the transplant. c-statistic of up to 0.656 was achieved. Further, feature selection techniques were able to significantly reduce the number of attributes in the model, incurring a minimal cost in c-statistic (0.645). We believe that the resulting models can be very useful to aid physicians in decision making by providing them with patient-specific risk estimations. Future work includes developing more sophisticated models for the studied outcome, and also exploring conditional outcome models using some post-transplant information (e.g. risk of 2-year mortality, given that the patient has already survived 1 year after transplant), and exploring the use of undersampling/oversampling to deal with unbalanced data. We also plan to do similar analysis for other types of transplants, and integrate the current and future work into healthcare and clinical decision making in practice, in the form of risk calculators, for example.
6.
ACKNOWLEDGMENTS
This work is supported in part by the following grants: NSF awards CCF-0833131, CNS-0830927, IIS-0905205, CCF0938000, CCF-1029166, and OCI-1144061; DOE awards DEFG02-08ER25848, DE-SC0001283, DE-SC0005309, DESC0005340, and DESC0007456; AFOSR award FA9550-12-1-0458.
7.
REFERENCES
[1] Optn/drtr 2008 annual report. available at http://www.ustransplant.org/annual_reports/ current/313_ord.htm, accessed january 27, 2010. [2] Url: 2008 u.s. organ and tissue transplant cost estimates and discussion, millman inc., http:// publications.milliman.com/research/health-rr/ pdfs/2008-us-organ-tisse-RR4-1-08.pdf, accessed may 13, 2013. [3] Url: Aortic cross-clamp, wikipedia, http: //en.wikipedia.org/wiki/Aortic_cross-clamp, accessed may 15, 2013. [4] Url: Extracorporeal membrane oxygenation, wikipedia, http://en.wikipedia.org/wiki/ Extracorporeal_membrane_oxygenation, accessed may 15, 2013. [5] Url: Financing a transplant, tranplant living, http://www.transplantliving.org/ before-the-transplant/financing-a-transplant/ the-costs/, accessed may 13, 2013. [6] Url: Glomerular filtration rate, medlineplus, http://www.nlm.nih.gov/medlineplus/ency/ article/007305.htm, accessed may 15, 2013. [7] Url: Heart transplantation, wikipedia, https: //en.wikipedia.org/wiki/Heart_transplantation, accessed may 13, 2013.
[8] Url: Hemodialysis, wikipedia, http://en.wikipedia.org/wiki/Hemodialysis, accessed may 15, 2013. [9] Url: Intubation, wikipedia, http://en.wikipedia.org/wiki/Intubation, accessed may 15, 2013. [10] Url: Ischemic time, the free dictionary, http://medical-dictionary.thefreedictionary. com/ischemic+time, accessed may 15, 2013. [11] Url: Mechanical circulatory support therapy, thoratec corporation, http://www.thoratec.com/medical-professionals/ treating-advanced-heart-failure/mcs-therapy. aspx, accessed may 15, 2013. [12] Url: United network for organ sharing, unos, http://www.unos.org/about/index.php, accessed may 13, 2013. [13] Url: What to expect before a heart transplant, national heart lung and blood institute, http://www.nhlbi.nih.gov/health//dci/Diseases/ ht/ht_before.html, accessed may 15, 2013. [14] C. Bishop. Neural Networks for Pattern Recognition. Oxford: University Press, 1995. [15] L. Breiman. Bagging predictors. Machine Learning, 24(2):123–140, 1996. [16] L. Breiman. Random forests. Machine learning, 45(1):5–32, 2001. [17] J. G. Cleary and L. E. Trigg. K*: An instance-based learner using an entropic distance measure. In In Proceedings of the 12th International Conference on Machine Learning, pages 108–114. Morgan Kaufmann, 1995. [18] L. Fausett. Fundamentals of Neural Networks. New York, Prentice Hall, 1994. [19] Y. Freund and L. Mason. The alternating decision tree learning algorithm. In Proceeding of the Sixteenth International Conference on Machine Learning, pages 124–133. Citeseer, 1999. [20] Y. Freund and R. E. Schapire. Experiments with a new boosting algorithm. 1996. [21] J. Friedman, T. Hastie, and R. Tibshirani. Special invited paper. additive logistic regression: A statistical view of boosting. Annals of statistics, 28(2):337–374, 2000. [22] H. George. John and Pat Langley. Estimating continuous distributions in bayesian classifiers. In Proceedings of the Eleventh Conference on Uncertainty in Artificial Intelligence, pages 338–345, 1995. [23] M. Hall. Correlation-based feature selection for machine learning. PhD thesis, Citeseer, 1999. [24] M. Hall, E. Frank, G. Holmes, B. Pfahringer, P. Reutemann, and I. H. Witten. The weka data mining software: An update. SIGKDD Explorations, 11(1), 2009. [25] T. Ho. The random subspace method for constructing decision forests. IEEE Transactions on Pattern Analysis and Machine Intelligence, 20(8):832–844, 1998. [26] D. Hosmer and S. Lemeshow. Applied Logistic Regression. John Wiley and Sons, Inc., 1989. [27] I. T. Jolliffe. Principal Component Analysis. Springer,
second edition, 2002. [28] R. Kohavi. The power of decision tables. In Proceedings of the 8th European Conference on Machine Learning, ECML ’95, pages 174–189, 1995. [29] S. le Cessie and J. van Houwelingen. Ridge estimators in logistic regression. Applied Statistics, 41(1):191–201, 1992. [30] W. G. Members, V. L. Roger, A. S. Go, D. M. Lloyd-Jones, E. J. Benjamin, J. D. Berry, W. B. Borden, D. M. Bravata, S. Dai, E. S. Ford, C. S. Fox, H. J. Fullerton, C. Gillespie, S. M. Hailpern, J. A. Heit, V. J. Howard, B. M. Kissela, S. J. Kittner, D. T. Lackland, J. H. Lichtman, L. D. Lisabeth, D. M. Makuc, G. M. Marcus, A. Marelli, D. B. Matchar, C. S. Moy, D. Mozaffarian, M. E. Mussolino, G. Nichol, N. P. Paynter, E. Z. Soliman, P. D. Sorlie, N. Sotoodehnia, T. N. Turan, S. S. Virani, N. D. Wong, D. Woo, and M. B. Turner. Heart disease and stroke statistics-2012 update: A report from the american heart association. Circulation, 125(1):e2–e220, 2012. [31] J. Orens, M. Estenne, S. Arcasoy, J. Conte, P. Corris, J. Egan, T. Egan, S. Keshavjee, C. Knoop, R. Kotloff, F. Martinez, S. Nathan, S. Palmer, A. Patterson, L. Singer, G. Snell, S. Studer, J. Vachiery, and A. Glanville. International guidelines for the selection of lung transplant candidates: 2006 update–a consensus report from the pulmonary scientific council of the international society for heart and lung transplantation. J Heart Lung Transplant, 25(7):745–55, 2006. [32] J. Rodriguez, L. Kuncheva, and C. Alonso. Rotation forest: A new classifier ensemble method. Pattern Analysis and Machine Intelligence, IEEE Transactions on, 28(10):1619 –1630, oct. 2006. [33] V. N. Vapnik. The nature of statistical learning theory. Springer, 1995. [34] I. Witten and E. Frank. Data Mining: Practical machine learning tools and techniques. Morgan Kaufmann Pub, 2005. [35] J. Zaroff, B. Rosengard, W. Armstrong, W. Babcock, A. D’Alessandro, G. Dec, N. Edwards, R. Higgins, V. Jeevanandum, M. Kauffman, J. Kirklin, S. Large, D. Marelli, T. Peterson, W. Ring, R. Robbins, S. Russell, D. Taylor, A. V. Bakel, J. Wallwork, and J. Young. Consensus conference report: maximizing use of organs recovered from the cadaver donor: cardiac recommendations. Circulation, 106:836–41, 2002.