Hospital Mergers and the Hypothetical Monopolist Test presentation by
Gregory J. Werden Senior Economic Counsel Antitrust Division U.S. Department of Justice*
at the
Antitrust Division and Federal Trade Commission Health Care and Competition Law and Policy Hearings *The views expressed herein are not purported to reflect those of the U.S. Department of Justice.
Standard Formulae for Applying the Hypothetical Monopolist Test Critical Elasticity of Demand Analysis Profit-Maximization Calculation Breakeven Calculation
Critical Sales Loss Analysis Profit-Maximization Calculation Breakeven Calculation
Critical Elasticity of Demand Analysis Profit-Maximization Calculation: The maximum elasticity of demand a profit-maximizing monopolist could face at pre-merger prices and still want to increase price by some significance threshold, e.g., 5%
Breakeven Calculation: The maximum elasticity of demand a monopolist could face at pre-merger prices and still not experience a net reduction in profits from a given price increase, e.g., 5%
Critical Sales Loss Analysis Profit-Maximization Calculation: The maximum reduction a hypothetical, profit-maximizing monopolist would be willing to tolerate in its quantity sold to sustain a given price increase, e.g., 5%
Breakeven Calculation: The maximum reduction a monopolist could experience in its quantity sold and still not experience a net reduction in its profits from a given price increase, e.g., 5%
Profit-Maximization vs. Breakeven Profit-Maximization Calculations: These calculations implement the HMGs’ hypothetical monopolist test but are sensitive to the unknown shape of the hypothetical monopolist’s demand curve.
Breakeven Calculations: These are close to profit-maximization calculations for small price increases and high margins, and critical sales loss is independent of the shape of the demand curve.
Critical Elasticities of Demand for Market Delineation Demand Curve
Profit Maximization
Break-Even
Linear
1 m + 2t
1 m+t
Isoelastic
1+t m+t
log(m + t) – log(m) log(1 + t)
m = price-cost margin
t = price increase significance level
Critical Sales Loss for Market Delineation Demand Curve
Profit Maximization
Break-Even
Linear
t m + 2t
t m+t
Isoelastic
–1– t 1– (1+ t) m + t
m = price-cost margin
t m+t
t = price increase significance level
Pitfalls In Applying Standard Formulae ! While typical applications posit small price increases, the profit-maximizing monopoly price increase, and even that from the merger, may be large. ! While standard formulae presume constant marginal cost and no avoidable fixed costs, actual cost functions may be quite different. ! While standard formulae implicitly increase all prices proportionately, profit-maximization often implies highly disproportionate price increases.
FTC v. Tenet Health Care Corp. 17 F. Supp. 2d 937 (E.D. Mo. 1998), rev’d, 186 F.2d 1045 (8th Cir. 1999) ! The district court accepted the FTC’s contention that the geographic scope of the relevant market was a 50-mile radius around Poplar Bluff, Missouri. ! On appeal, the defendant argued that its critical loss analysis demonstrated that the FTC’s market was too narrow. ! The Eighth Circuit held that the FTC failed to show that hospitals outside its alleged market were not “practical alternatives for many Poplar Bluff consumers.”
United States v. Mercy Health Services 902 F. Supp. 968 (N.D. Iowa 1995), vacated as moot, 107 F.3d 632 (8th Cir. 1997) ! Relying on defendant’s breakeven critical loss of 8%, the court found sufficient switching would occur “in the event of a 5% price rise” “to make the price rise unprofitable.” ! The government predicted the total elimination of managed care discounts—a far larger price increase, so the court also considered a larger (albeit not large enough) price increase. ! The court reckoned the critical loss at 20–35%, although it was actually about 46%.
California v. Sutter Health System 84 F. Supp. 2d 1057 (N.D. Cal. 2000), aff’d, 217 F.3d 846 (9th Cir. 2000), amended by 130 F. Supp. 2d 1109 (N.D. Cal. 2001) ! A major point of contention was whether the critical loss analysis should consider only a 5% price increase. ! Purporting to follow the Horizontal Merger Guidelines, the court held that only 5% should be used. ! This may be the most clear-cut and serious error ever made by a court in applying the hypothetical monopolist paradigm. ! Although a 5% price increase is unprofitable, a far greater price increase still could be profit maximizing.
An Illustration Resembling Actual Cases ! The two hospitals in a small City propose to merge. ! The two hospitals annually serve 10,000 patients from the City, and they are not easily shifted to other hospitals. ! The two annually serve 5,000 patients from the Region but not from the City, and they are easily shifted to other hospitals. ! Geographic price discrimination is infeasible.
Applying the Elzinga-Hogarty Test ! The Elzinga-Hogarty test says that the market is larger than just the City because LOFI is only 67%; i.e., only 2/3 of the hospitals’ discharges are to the City. ! In-Region hospitals outside the City annually serve 5,000 patients, all from inside the Region but outside the City. ! Out-of-Region hospitals annually serve 7,000 patients from the Region, 1,000 of which are from the City. ! The Elzinga-Hogarty test says that the market is larger than the Region because LIFO is only 74%; i.e., Region hospitals account for less than 3/4 of patients discharged to the Region.
Naively Applying Critical Loss Analysis ! Suppose both merging hospitals have margins of 50%. ! The breakeven critical sales loss for a 5% price increase is 9%. ! Actual sales loss would exceed 9% even if lost patients would amount to no more than 1/3 of the “at risk” patients from the Region’s outlying areas. ! The relevant market, therefore, must be larger than the City.
Modeling the Hypothetical Monopolist ! Assume constant marginal cost and no fixed costs are avoidable. ! The hypothetical monopolist’s marginal cost curve is now implied by the pre-merger price level and margin. ! Assume both patient groups have linear demands. ! The hypothetical monopolist’s demand curve is now implied by the pre-merger elasticities of demand for its two patient groups. ! Finally, suppose the merging hospitals estimated demand elasticity for City patients is .25 and that for outlying Regional patients is 6.
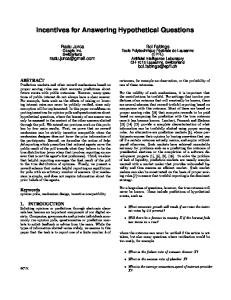
Pricing by the Hypothetical Monopolist ! With the hypothetical monopolist’s demand and a marginal cost curves, it is simple to compute its profit-maximizing price. ! Under all the assumptions made, the hypothetical monopolist would raise price 175%. ! Contrary to the implications of both the Elzinga-Hogarty Test and a naive application of critical loss analysis, the relevant market in fact is just the City.
Profit
Premerger Price
Price +\SRWKHWLFDO�0RQRSROLVW¶V�3URILWV�DV�D�)XQFWLRQ�RI�LWV�3ULFH
Critical Loss Analysis Revisited ! The breakeven critical sales loss is greater than 9% for price increases greater than 5%. ! For price increases between 31% and 319%, the actual sales loss does not exceed the breakeven critical sales loss.
Sales Loss Breakeven Critical Sales Loss
31%
Actual Sales Loss
319%
Price Increase
&ULWLFDO�/RVV�$QDO\VLV�IRU�/DUJH�DQG�6PDOO�3ULFH�,QFUHDVHV
Assessing Price-Cost Margins: Theory ! The relevant cost concept is avoidable cost, and which costs are avoidable depends on the magnitude of the change in output and the time period considered. ! The relevant change in output depends on how much price actually would be increased and on the elasticity of demand. ! Sales contracts and other institutional details may affect which costs are avoidable.
Assessing Price-Cost Margins: Issues ! Could shutting down some capacity avoid any fixed costs? Would an entire hospital be closed? Would a department or floor of a hospital be closed? ! Could capacity be diverted to other profitable uses? Would an entire hospital be switched to non-acute care? Would some beds be switched to non-acute care? ! What is the margin on the particular patients lost?