How Laws Affect Behaviour
Roberto Galbiati† and Pietro Vertova‡ Abstract Laws and other formal rules are ‘obligations backed by incentives’. We explore how laws work and affect behavior. Our analysis is based on a series of modified experimental public good games designed to isolate the impact of exogenously requested minimum contributions (obligations) from those of marginal incentives backing them. We find that obligations have a sizeable effect on cooperative behaviour even in absence of incentives. When non-binding incentives are introduced, requested contributions strongly sustain cooperation. Therefore, in contrast with cases in which incentives crowd out cooperative behaviour, in our experiments obligations and incentives are complements, jointly supporting high levels of contributions. Our results are consistent with the view that conformity to a rule is perceived as an obligation when it is backed by a system of incentives whose role in this case is not to modify the payoffs from material actions, but to give salience to the content of the rule. Moreover, we find that variations in obligations affect behaviour even when incentives are held constant. Finally, the effect of obligations on behaviour depends both on their impact on people’s beliefs about others’ contributions and on a direct effect of obligations on individuals’ preferences for cooperation. Keywords: Beliefs, Formal Rules, Human Behaviour, Incentives, Laws, Obligations, Preferences, Public Good Game. JEL Classification: C91, C92, H26, H41, K40.
ACKNOWLEDGEMENTS: We wish to thank Sam Bowles, Ernst Fehr and Jan Potters for extremely useful discussions, suggestions and encouragement in this project. We benefited from comments and suggestions by Simon Gaechter, Theo Offermann, Urs Fischbacher, Michele Bernasconi, Oriana Bandiera, David Levine, Francesco Drago, Steffen Huck, Michael Kosfeld, Karl Schlag, Christian Zehnder, Dorith Geva and participants in seminars at Amsterdam (UVA), Bergamo, Bologna, Bocconi University, The European University Institute, Napoli, Toronto and Zuerich (IEW). We are grateful to Francesco Lomagistro for his excellent assistance in the lab. We gratefully acknowledge the University of Siena and the University of Bergamo for financial support. All the usual disclaimers apply. †
Roberto Galbiati (corresponding author), CNRS-EconomiX Paris. E-mail:
[email protected]
‡
Pietro Vertova, Department of Economics, University of Bergamo and Econpubblica-Bocconi University. E-mail: vertova@uni-
bocconi.it
1
1. Introduction Authorities who want to influence behaviours usually set formal rules of conduct. Legislators, managers or parents, for instance, recommend citizens, employees or children to maintain certain behaviours and try to induce compliance by setting incentives in the form of rewards and/or sanctions. Understanding the effects of formal rules on individuals’ behaviour is a crucial issue for the social sciences and for public policy design. When approaching the study of formal rules, economists focus on their enforcement and on the design of optimal incentives. Nonetheless, in reality incentives are often non-binding and their enforcement power is limited. A relevant puzzle in economics is actually why people obey rules and laws when they are typically poorly enforced.1 When incentives are not strong enough to affect significantly individuals’ payoffs why do formal rules affect social equilibrium outcomes? The aim of this paper is to provide a more complete view of how stated rules affect human behaviour based on empirical evidence from a series of modified experimental public good games. In particular we explore the idea that a deeper understanding of the behavioural consequences of formal rules may be achieved by combining a traditional analysis of the effects of the incentives they set with an exploration of the effects of other constitutive elements of the rules.2
According to an established Anglo-American legal tradition – the imperative theory of law - formal rules (e.g. laws) are “obligations backed by incentives”.3 The obligation part of a formal rule consists of the normative content established by that rule, or in other words the behaviour the rule states people should keep.4 This in fact represents a fundamental component of formal rules, but it is usually neglected by economists since it cannot alter the structure of material payoffs for individuals. While economics focuses on the enforcement mechanism of the rules, legal theorists and social psychologists5 suggest that laws are effective in regulating people’s behaviour not only for what they do (i.e. the enforcement structure) but also for what they say. According to this view, laws and formal rules have an expressive power and they can affect people’s behaviours by 1
For instance Slemrod (1992) and Andreoni, Erard and Feinstein (1998), in a relevant field such as tax law, remark that, given the low expected sanctions related to tax evasion, the widespread tax compliance observed in many countries is quite puzzling. 2
The idea that components of laws different from incentives may influence equilibrium outcomes has been theoretically explored among others by Mailath, Morris and Postlewaite (2001), and Kahan (1997). 3 See Raz (1980). 4 Typically, a formal rule is a statement such as: “you ought to… and you then will get…” (or “you ought to… or else you will pay…”). In this sentence, incentives are captured by the “and you will get/or else you will pay …” part, and obligations by the “you ought to…” component. 5 See Tyler (1990).
2
activating values and/or coordinating individuals’ beliefs.6 Under this perspective the normative content of the law can activate people’s motivation and induce compliance, even more than the material incentive enforcing the rule itself. The idea is fascinating but it is also contested because of the lack of systematic empirical evidence. To have a complete picture of how formal rules affect behaviour, it is thus crucial to understand how obligations work and how they interact with incentives in affecting human behaviour. This last aspect is particularly relevant. As we mentioned above, in reality we observe a widespread use of weak incentives either because the probability of monitoring a certain undesired behaviour is very low or the expected sanctions are small. In principle weak/non-binding incentives are somehow superfluous. Indeed, they are not useful to induce desired behaviours as they are not able to modify individuals’ payoffs in such a way to render desired strategies dominant. Moreover, according to a huge recent literature non-binding incentives could even backfire by crowding-out intrinsic motivation for cooperation (see Frey and Jegen, 2001 for a review). All in all, we ask whether obligations are actually able to affect behaviour and how non-binding incentives interact with them. An unexplored revealing pattern that emerges from the analysis of our experimental results is that obligations and non-binding incentives are complements that crucially sustain each other to make rules work. Obligations may affect individuals’ beliefs about others actions and individuals’ preferences for cooperation and nonbinding incentives complement them by making them salient. The presence of incentives can highlight obligations that thus activates7 people’s beliefs and preferences.
More precisely, our research plan led us to ask the following questions: Question 1: Do obligations per se affect cooperative behaviour? If obligations exert any effect, what
is their
interaction with incentives?
Do
incentives complement or
crowd-out
obligations? Question 2: When incentives are present, do variations in obligations have any per se effect on people’s behaviour? Question 3: Which are the motivational channels through which the possible effects of obligations come into play? In particular, we search for the possible effects of obligations on people’s motives for behaviour: their beliefs8 and preferences for cooperation. 6
See Kahan (1997), Cooter (2000) and McAdams (2000). In economics the theoretical works by Huck(1998) and BarGill and Fershtman (2004) explored the possibility that laws affects behaviours by driving the evolution of preferences. 7 Despite the analysis of mechanism through which rules affect individuals’ preferences is not an object of our paper we may plausibly think that incentives highlight obligations thus affecting beliefs’ about others’ actions as people have the tendency to anchor their beliefs to available pieces of information (Tversky and Kahneman, 1974). 8 We focus our attention on individuals’ beliefs about others’ behaviour.
3
The experimental design is based on a one-shot linear public good game9 with the peculiarity that subjects face an exogenous request of a minimum contribution: “a minimum contribution of X tokens to the public good is required from each individual”. To answer Question 1 and Question 2 we first compare a baseline treatment in which we run a one shot public good game with a treatment in which we introduce the minimum contribution without any incentive structure. Then we modify the game by adding an incentive structure: an individual contributing less (more) than the minimum contribution is subject to a probabilistic penalty (reward). The peculiarity of such an incentive structure is that it is perfectly symmetric with respect to the minimum contribution: those contributing more than the requested expect a reward; those contributing less a sanction. By resorting to such a framework, we are able to keep the marginal incentives fixed across treatments. Thus the marginal incentives to contribute are independent of the minimum contribution. This aspect is crucial - our incentive structure is non-binding and marginal payoffs are independent of the minimum contribution. Hence, if we observe any difference in treatments with different minimum contributions, this cannot be imputed to the effect of incentives on payoffs but its justification should be sought elsewhere. To investigate the motivational channels thorough which the rules affect behaviours (Question 3) the experiment consists of three stages. In the first stage, individuals decide how much to contribute to the public good game (unconditional contribution). Next, we elicit individual conditional contributions: we ask people to decide how much they want to contribute for different hypothetical average group contributions.10 Finally, we ask each subject her beliefs about the others’ average unconditional contributions. Our conjecture about the motivational channels through which obligations come into play is that obligations act as a coordination device for conditional co-operators (Fischbacher et al. 2001)11. Obligations may coordinate individuals’ beliefs about others’ behaviours to a common focal point, thus driving conditional co-operators’ contributions. A second possibility is that obligations may affect behaviours because they affect individual preferences for cooperation.
9
The choice of carrying out our experimental investigation in a public good setting is motivated by the fact that formal rules, and in particular legal rules, are often set by legislators and governments with the specific objective of overcoming social dilemmas (e.g. free riding in income tax compliance, common pool resources management, traffic behaviour, or environmental regulation) by aligning private incentives to the common good. 10
To elicit unconditional contributions we follow the design by Fischbacher et al. (2001).
11
It is a well documented pattern in experimental public good games that a share of subject are willing to cooperate if the others in their group contribute to a sufficient extent.
4
The overall picture emerging from our experimental results is the following. The introduction of a minimum contribution rule has a sizeable effect on cooperation in a baseline public good game even in absence of a structure of incentives. Nonetheless when we add a non binding incentive structure, the effect of recommended contribution on individuals’ contributions to the public good raise strongly and significantly. This means that in our experiments obligations and incentives are complements, jointly supporting high levels of contributions. As the incentive structure is such that it cannot modify individuals’ best response based material payoffs, this result also sheds light on a further function of incentives that complements those traditionally highlighted in economic theory and behavioural economics. Incentives do not only affect behaviours by changing the payoff structure of games and/or by activating or crowding out social preferences, they also play a further fundamental role: they make stated rules effective by making their content salient. This result is consistent with the view that conformity to a rule is perceived as an obligation when it is backed by a system of incentives whose role in this case is not to modify the payoffs from material actions, but to give salience to the content of the rule.12 This role of incentives is confirmed both by the results we obtain in the absence of obligations and by varying the level of incentives for a given obligation. We do not observe any difference between contributions in a baseline public good game and contributions in a treatment with non-binding incentives for positive contributions. Moreover, when we fix the requested minimum contribution to high level and we compare two treatments with different levels of incentives we do not observe any difference in the levels of cooperation. This reveals that the crucial role of non-binding incentives is to complement the minimum contribution obligations and that it is the presence and not the level of incentives that matters. Then, by further focusing on the effects of obligations, our experimental results show that variations in obligations strongly affect people’s behaviour independently of the marginal incentives backing them. All in all, incentives complement the effects of obligations by strengthening them, but once the incentive structure is fixed obligations are independent in driving individuals’ contributions to the public good. Finally, regarding the channels through which obligations affect behaviours, by comparing beliefs about others’ contributions to the public good we corroborate the hypothesis that obligations anchor beliefs about others’ contributions. As we expected, obligations act as a focal point for beliefs about others’ contributions. Moreover, by comparing the conditional contribution schedules emerging from the different treatments, we are able to determine whether or not obligations have 12
From this point of view, this study contributes to a burgeoning literature in behavioural economics aiming at providing us with a greater understanding of the psychological effects of incentives (see among others Benabou and Tirole, 2003 and forthcoming; Bohnet, Huck and Frey, 1997; Bowles, 2008; Bowles and Hwang, forthcoming; Falk and Kosfeld, 2006; Falk, Fehr and Fischbacher, 2005; Fehr and Falk, 2002; Fehr and Schmidt, 2002, Gneezy and Rustichini, 2000).
5
any direct effect on preferences. Here the results are more surprising. We find that conditional contribution schedules are on average significantly different across the treatments. As conditional contributions tell us how much people are willing to contribute given any possible level of others’ contributions, this finding supports the idea that obligations directly affect individuals’ preferences for cooperation.
The paper is structured as follows. Section 2 reports the experimental design and the behavioural predictions. Section 3 describes and comments on the results. Section 4 provides some concluding remarks.
2. The Experiment 2.1. The experimental game The basic experiment consists of a one-shot linear public good game followed by a conditional contribution stage. Overall, we ask participants to make two choices. The first is a choice of ‘unconditional contribution’: subjects are asked to make their contributions to the public good. After all subjects have chosen their unconditional contribution, we ask participants to make their choices of ‘conditional contribution’, that is to say, to select how much to contribute to the public good in correspondence to different average contributions from the other group members. Finally, we elicit individual beliefs about others’ unconditional contributions. Individuals know the others’ decisions and their own payoff only after all these three stages have taken place. The linear public good game we implement differs from a standard voluntary contribution mechanism in that we fix exogenously a minimum contribution. The minimum contribution indicates a minimum level of contribution that each subject is required to provide for the public good. The game has two main variants. The first without incentives at all: we simply introduce the requested minimum contribution without any form of monitoring of individuals’ actual behaviour. In the second variant the minimum contribution is backed by a structure of incentives: there is a probability of control and a probabilistic penalty (reward) for individuals whose contributions are lower (higher) than the level of minimum contribution required.13 As we are interested in understanding if the minimum contribution has a different effect in the presence and in the absence of incentives, and in the second case we want to isolate its effects from those of the marginal incentives, we keep the level of marginal incentives fixed across all treatments, i.e. the probability of being audited and the penalty/reward rate do not vary with the minimum contribution obligation. 13
The penalty (reward) is proportional to the negative (positive) difference between the actual contribution and the minimum contribution required.
6
On the contrary, the level of the minimum contribution required changes across the treatments. The incentives are fixed at a very low level. This choice is for two reasons: firstly, we aim to test whether or not an obligation of minimum contribution affects cooperation when incentives are such that the optimal strategy for self-interested individuals is full free-riding, even if they are risk-averse to a reasonable degree. Secondly, we want to minimize the possible bias in our results caused by differences in risk preferences across samples. 14 In the one-shot public good game (unconditional contribution stage), the expected monetary payoff for individual i is: n
X i = y − a i + m∑ a j − pg (aˆ − ai )
(1)
j =1
where y is the individual endowment, m indicates the marginal per capita return to the public n
good A ≡ ∑ a j , p is the probability of audit, and g is the penalty/reward rate. We set the j =1
parameters such that the following inequalities hold: m > 1 / n and m + pg < 1 . In the variant
without incentives we fix pg = 0 . In order to understand whether a possible effect of minimum contribution on cooperation should be imputed to an influence on preferences, on beliefs, or on both, and if such motivational channels are affected by the presence or absence of incentives, we need to understand: a) if individuals’ beliefs about others’ contributions are significantly different in the different treatments; b) if, given the others’ hypothetical contributions, individuals’ conditional behaviour significantly varies in the different treatments. In order to pursue the latter aim, in all the treatments, we elicit subjects’ “conditional contributions” by applying a variant of the so-called “strategy method” (Selten, 1967), as developed in the experimental design by Fischbacher et al. (2001). After the unconditional contribution stage, subjects are asked to report their conditional contributions. In particular, each subject has to fill in a conditional contribution table: for each possible level of average contribution in the group, and given the level of minimum obligation, she has to declare how much she wants to contribute to the public good. To give subjects the material incentives to take their conditional contribution decisions seriously, we adhere to the procedure designed by Fischbacher et al. (2001). Subjects are told that, after they have taken both decisions, a random mechanism would select which one of the two decisions becomes effective in determining their payoffs. In each group, one subject is randomly selected. For this subject the conditional contribution table determines her
14
Nevertheless we check the robustness of our results by controlling for differences in risk preferences (see Appendix 1).
7
actual contribution to the public good, whereas for the other group members the relevant decision is the unconditional contribution. This mechanism ensures that all entries in the conditional contribution table are potentially relevant in determining the payoffs of each subject. The procedure described above is equivalent to the following game: first, nature selects n-1 players who make their unconditional contribution decisions simultaneously given the payoff structure described above. The n-th player learns the average contribution of the other players and takes her contribution decision. Each player knows if she is the n-th player and, if she is not, she does not know who this player is. After all players have decided how much to contribute to the public good, the monitoring stage takes place: a player’s contribution may be randomly controlled (with probability p) and the player may get a monetary reward (sanction) if she has contributed more (less) than the minimum contribution required by the obligation. Finally, in order to have a proxy of people’s beliefs about the others’ contributions, in each treatment we ask each subject what she expects the others in their group have contributed on average in the unconditional contribution decision. In order to give an incentive to take this decision seriously, those who actually make the right prediction gain an additional monetary payment.
2.2. Treatments, parameters and procedures To investigate our research questions we initially implemented five different experimental treatments for the minimum contribution: two treatments without incentives and three treatments in the presence of the same probabilistic incentive structure. The first two treatments are: a baseline public good game without a material incentive to contribute ‘(PG condition’), and a treatment with a required minimum contribution equal to 80% of an individual’s total endowment (‘H condition without incentives’). This second treatment just functions as a baseline voluntary contribution mechanism with a suggested contribution that we can consider as a third party cheap talk. The treatments with monitoring structure are the following. A ‘0 condition’, where no minimum contribution is required and subjects get a reward if they are monitored and their contributions to the public good are higher than zero. A low minimum contribution condition (‘L condition’) where subjects are required to contribute at least a fraction of 20% of their initial endowment, and a high minimum contribution condition (‘H condition’), where the minimum contribution required corresponds to 80% of an individual’s total endowment. In both these last treatments individuals’ contributions can be monitored. If they contribute less (more) than the required contribution they get a penalty (reward). As we are interested in the effects of obligations per se, we keep the level of
8
marginal incentives (i.e. the probability of being audited and the penalty/reward rate) fixed across all treatments. In the instructions we stress that the obligation fixes a minimum contribution required from each individual, but that the feasible contribution for each participant varies between 0 and her overall endowment. We also explain in detail the consequences of each choice on individual payoffs. To further investigate the role of incentives and be sure that the effects we find depend on their presence and not on their level, we introduce a further treatment in which we keep the high obligation structure with incentives, but we modify the marginal payoff from contributions to the public good by further reducing them (‘H condition low incentives’).15 A comparison between the two high obligation conditions with different incentive levels and the baseline condition without obligation provides us with information about the effect of varying marginal incentives on levels of, and motivations for, cooperation. The parameters of the game are set as follows. The initial endowment is y = 20 , the number of subjects per group is n = 6 , the marginal per capita return to the public good is m = 0.3 , the probability of control is p = 1 / 12 16 ( and p = 1 / 100 in the ‘H condition low incentives’), the sanction/reward rate is equal to g = 1.2 (this ensures that: m > 1 / n and m + pg < 1 ), the minimum contributions fixed by obligation are aˆ = 4 in the ‘L condition’, and aˆ = 16 in the ‘H condition’, respectively. The experiment was conducted in a computerized laboratory where subjects anonymously interacted with each other.17 No subject was ever informed about the identity of other group members. We did not show information about other individuals’ contributions in the same group. At the end of the game subjects are just provided with information on their own payoff. This should rule out emotional elements related to stigma and shame in the explanation of the results. We conducted five sessions, one for each treatment. In each session participants were divided into 6 groups of size 6 for a total number of 216 subjects. Subjects were undergraduate students of different faculties. Each subject participated in one session only and nobody had previously participated in other public good experiments. The experiment was conducted in the experimental laboratory of the University of Siena (Italy) in different sessions form December 2005 to April
15 16
In particular we reduce the probability of monitoring for individuals’ contributions to a level closer to zero. This probability results as the outcome of such a procedure: given a group of 6 players, first the group is selected with
probability 1/2, and then, in the positive case, one of the six individuals in the group is selected. Notice that the anonymity of audit is guaranteed. 17 To conduct the experiment, we used the experimental software ‘z-Tree’ developed by Fischbacher (2007).
9
2008. Each session lasted about one hour and the average earnings for each subject were 14 Euros (about 20 US dollars).
2.3. Behavioural predictions If we assume common knowledge of rationality, risk neutrality and selfishness of all players, we expect that in every treatment the unconditional contribution of each subject will be equal to zero, and that conditional contribution entries will all be zero for each subject. For example, let us consider in our setting the optimal choice of a risk-neutral and fully self-interested individual. Her optimal contribution, ai* , is the value of ai which maximizes (1). The first order condition of the maximization problem yields: ∂X i = −1 + m + pg < 0 ∂a i
(2)
Hence the dominant strategy for a (risk-neutral) self-interested individual is always full free-riding: a i* = 0 . This result depends crucially on the assumption that m + pg < 1 , meaning that the
monetary incentives are not sufficiently high to make the expected return from one unit of contribution higher than one unit kept for herself. Notice that the level of minimum contribution obligation aˆ does not affect the optimal choice of a self-interested individual. This is straightforward since minimum contributions do not affect marginal monetary payoffs. In order to satisfy this condition, our setting presents both a probabilistic penalty for those who contribute less than the minimum contribution and a probabilistic reward for those who contribute more. Notice that if we had instead applied only a probabilistic penalty (or only a probabilistic reward) for the individuals who contribute less (more) than aˆ , we would have obtained two distinct first-order conditions for the maximization problem, one for the interval ai ≤ aˆ and the other for the interval ai > aˆ . But in this case, different levels of aˆ would have implied different marginal monetary payoffs, which we want instead to keep fixed in order to isolate the effect of different minimum contributions.18 If individuals were all merely self-interested, minimum recommended contributions would not have any effect for two reasons: first, because the optimal contribution for a self-interested individual is always the null contribution; second, because at the margin the requested minimum contribution 18
It is worth noting that there are cases in the real world in which penalties are given to those breaking the law and rewards are given to those who follow the law. For instance, in Italy, penalties (in the form of a reduction in points on the driving licence) are implemented for those who violate the driving code, while rewards (in the form of more points added to the driving license) are given to those who for two consequent years do not violate the driving code. This case is very similar to ours, since street safety could easily be thought of as a public good.
10
cannot affect monetary incentives. Nevertheless, as long as individual reasons for behaviour depart from the traditional assumption of self-interest,19 some individuals may make positive contributions (as usually observed in experimental public good games), and minimum recommended contributions may entail some effect on individual behaviour. Since the structure of our game rules out any possible effect of minimum contribution rules on marginal incentives, any effect needs to be explained on the basis of their behavioural effects. We can advance some conjectures. First, as long as some individuals are conditional co-operators, i.e. they are willing to cooperate (despite monetary incentives to free-ride) if the other members of their group cooperate to a sufficient extent, minimum contributions may coordinate individuals’ beliefs to common focal points, thus affecting cooperative behaviour. Second, minimum contributions, being perceived as obligations, may have direct psychological effects on preferences (and thus on behaviour) as long as they affect individual personal norms of contribution. If obligations affect beliefs, we expect to observe significant differences in stated beliefs about others’ contributions across treatments. If they affect preferences, we expect to find significant differences in the conditional contribution schedules. In particular, if people make different contributions for the same hypothetical average contributions of other group members, it means that preferences for cooperation are directly shaped by the minimum contribution rules. There is a further aspect that it is worth stressing. Question 1 regards the relation between incentives and obligations, in particular investigates the role of the presence/absence of incentives in making the obligations effective. Formal rules (especially legal rules) are normally defined and perceived as obligations backed by incentives. In the case that minimum contribution rules significantly affect behaviours because they are perceived as obligations the question to ask is whether a suggested contribution is enough to exert a behavioural effect, or if it is necessary to have an incentive structure (though non-binding) to give salience to the requested contribution. In other words is it enough to suggest a behaviour to people to see them coordinating around a certain focal point, or is it necessary to have an incentive structure in order to observe minimum contribution rules significantly affecting beliefs and or preferences? In other words, does the presence of nonbinding incentives contribute to make the obligation a focal point thus complementing its effects? The answers to these questions are inherently dependent on empirical evidence. It is worth noting that empirical evidence on this point helps to shed a light not only on the role of obligations but also in general on the role of incentives and their fundamental role as a coordination device. If the
19
A huge amount of empirical and experimental literature shows that in social dilemmas many individuals are characterized by social preferences, i.e. having other-regarding or process-regarding preferences (for a survey on social preferences see Camerer and Fehr, 2002; Fehr and Schmidt, 2002).
11
presence of incentives turns out to be a crucial to sustain the effects of obligations, we may infer that an important function of incentives goes beyond their influence on material payoffs. In this case we may conclude that incentives not only shape payoffs but they also complement obligations; nonbinding incentives in particular, far from being redundant, would exert a crucial role to make formal rules work.
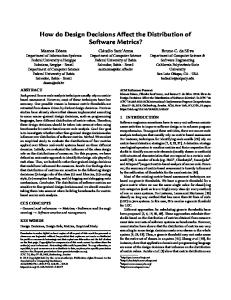
3. Results 3.1. Question 1: Do obligations per se affect behaviour? What is the function of nonbinding incentives? The first step of our analysis aims to clarify whether obligations per se exert any effect on behaviour and how obligations and non-binding incentives interact. In particular we try to understand whether the response to a recommended minimum contribution to the public good in the case there is not any incentive structure differs from the response in the case there is a non-binding enforcement structure. This comparison helps us to understand both the effect of the presence of a minimum contribution obligation and the role of non-binding incentives. To investigate this aspect, we initially focus on two treatments: the ‘PG Condition’ and ‘H condition without incentives’. The first treatment is the baseline treatment: the one-shot linear public good game without requested minimum contribution and incentives coupled with the elicitation of conditional contributions and beliefs. The second treatment introduces a high requested minimum contribution (16 tokens) without penalty and reward structure. In figure 1 (first two bars) we report the average unconditional contributions in the two treatments with no incentives (‘PG Condition’ and ‘H Condition without incentives)’. In the treatment with a requested minimum contribution we observe an increase in the average unconditional contributions to the public good. The unconditional contributions increase by the 41% in the treatment with minimum contribution (from 8.02 in the ‘PG condition’ to 11.33 in the ‘H condition without incentives’). To test the statistical significance of the differences in the contributions in the two treatments we run a Mann-Whitney rank-sum test.20 The results of the test (z=-1.746; p=0.08)21 show that the difference in the average contributions in the two treatments is significant at the 8% level. This shows that suggested obligations affect average contributions to the public good despite in a weakly statistically significant way. To understand if introducing a non-binding incentive structure the behavioural response of subjects significantly changes, we compare the average unconditional contribution in the ‘0 condition’ treatment and in the ‘H condition’ treatment with the 20 21
The unit of observation in the statistical test is the average group contribution. We report both the values of the test (z) and the p-values (p).
12
symmetric incentives scheme. In both the treatments we have the same marginal payoff schedule and different levels of minimum required contributions (0 tokens in the ‘0 condition’ and 16 tokens in the ‘H condition’). The second two bars in figure 10 report the average unconditional contributions in this case. In this case we observe a much stronger effect of the obligations on unconditional contributions. Average unconditional contributions are almost the double in the presence of obligations backed by a symmetric non-binding incentive structure (They raise by the 81% in the ‘H condition’ with respect to the ‘0 condition’). A Mann-Whitney rank-sum test is applied in order to test the statistical significance of the differences in contribution levels between the two treatments. The results of the test (z=-2.887; p=0.004) confirm that the mean contributions under the ‘H condition’ are higher at any conventional level than mean contributions in the ‘0 condition’.
average contribution
FIGURE 1 UNCONDITIONAL CONTRIBUTIONS (Comparison of treatments with and without incentives) 20 19 18 17 16 15 14 13 12 11 10 9 8 7 6 5 4 3 2 1 0 PG Condition
H Condition No incentives
0 Condition
H Condition
These results are revealing. Recommended contributions exert a positive, despite weekly statistically significant, effect on individual contributions to the public good. Nonetheless, if we add a non-binding incentive structure, the recommended contributions strongly affect individuals’ average contributions to the public good. This suggests that our non-binding enforcement structure (despite not affecting the marginal payoffs of contributions to the public good) gives salience to the requested minimum contributions. In other words the strength of obligations in affecting behaviours is much stronger when they are backed by incentives. This evidence can be summarized as follows:
13
Result 1. Recommended contributions obligations affect the average levels of cooperation in a one-
shot public good game. The effect of recommended contributions is much stronger if they are backed by a non-binding incentive structure. Obligations affect cooperative behaviour and nonbinding incentive are complement to obligations.
This result clarifies the concept of obligations and explains why non-binding incentives are a crucial determinant of behaviour. The effects of obligation are much stronger when they are supported by incentives that give salience to them. By observing the distribution of unconditional contributions (figure 2) this pattern emerges even more clearly.
FIGURE 2 UNCONDITIONAL CONTRIBUTIONS (Comulative distributions) 1 0.9 0.8 0.7 0.6
0 condition
0.5 PG condition
0.4 0.3
H condition no incentives
0.2
H condition
0.1 0 0
1
2
3
4
5
6
7
8
9 10 11 12 13 14 15 16 17 18 19 20
The cumulative distributions of unconditional contributions show that in the presence of an obligation without incentives (H condition without incentives) the individuals contributions tend to be more concentrated on higher levels with respect to the baseline condition. Nonetheless by introducing non-binding incentives in the presence of the same obligation (H condition), the contributions tend to shift to levels higher than the minimum contribution obligation (more than the 70% of contributions is equal or higher than the minimum contribution obligation which is fixed at 16 tokens). It is worth remarking that here we can theoretically rule out the fact that the role of incentives depends on their effect on material payoffs because we set the parameters at such a level that in any case contributing zero to the public good is the dominant strategy for individuals just focusing on 14
material payoffs. By comparing the unconditional contributions in the ‘0 condition’ and the ‘PG condition’ we can better observe how incentives work. These two treatments differ because in the ‘0 condition’ we kept the probabilistic reward system while in the ‘PG condition’ there is no incentive to give to the public good, while in both of them there isn’t any minimum contribution obligation. We don’t observe any difference between the unconditional contributions in the two treatments, neither in their means (see figure 1) nor in the shape of the cumulative distributions (see figure 2). This confirms the intuition that incentives affect behaviour but not for their effect on the material payoffs and that this effect comes into play only as a complement of the obligations when these are present.
At this point of the analysis it is natural to ask if it is just the presence of non-binding incentives that gives salience to the minimum contribution obligation thus strengthening its effects on individuals contributions, or the level of incentives plays a role in driving subjects’ behaviour. This question is relevant both to understand how non-binding incentives work, and also to corroborate that the increase in the average contributions that we impute to the obligations is not indeed driven by incentives.
3.1.2 Effects of different levels of non-binding incentives.
Hereafter we try to understand whether the strength of incentives may play a role in influencing behaviours. We are not interested in the investigation of the effects of binding incentives: a binding incentives scheme would actually change the game’s payoff structure and make full contribution a dominant strategy for all players. In the experimental treatments described in the previous section, when an incentive structure is present, the expected sanction (reward) for those contributing less (more) than the minimum required contribution is: pg (aˆ − ai ) , with the probability of control
parameter and the sanction/reward rate fixed at p = 1 / 12 and g = 1.2 respectively. The question now is whether a different level of non-binding incentives would have been effective in making the obligation salient. In particular, we are interested in understanding if a much weaker incentive scheme would give the same results. To investigate this question we run a further experimental treatment ‘H condition low incentives’ where we set the expected sanction (reward) parameters as follows: p = 1 / 100 and g = 1.2 . In this second case, the control probability is almost 1/10 of the probability in the ‘H condition’ and the per-unit reward (sanction) is 0.012 tokens (the monetary equivalent is 1/3 of a eurocent). In figure 3 we report the average unconditional contributions for the baseline public good game treatment (‘PG condition’) and the two treatments with high obligation and incentives differing in 15
the strength of the incentive structure (‘H Condition’ and ‘H condition low incentives’). The average levels in the two last treatments are very close to each other (15.1 and 14.8 in ‘H Condition’ and ‘H condition low incentives’ respectively) and different from the ‘PG condition’. By applying a Mann-Whitney rank-sum to test the statistical significance of the differences in contribution levels between these treatments, we confirm that the average contribution in the ‘H condition low incentives’ treatment is significantly different from the average in the baseline ‘PG condition’ treatment at the one percent level (Mann Whitney results: z=-2.423; p=0.015). Moreover we cannot reject the hypothesis that the average unconditional contributions in the two high obligation treatments are the same at any conventional level (Mann Whitney results: z=-0.484; p=0.6285). FIGURE 3 UNCONDITIONAL CONTRIBUTIONS (Different levels of incentives) 20 18 16 a v e r a g e c o n t r ib u t io n
14 12 10 8 6 4 2 0 PG Condition
H Condition Low inceintiv es
H Condition
This evidence suggests that even extremely week incentives are able to give salience to the suggested contribution. In other words, an obligation is effective in strongly increasing individuals’ cooperation even if only backed by a very weak incentive structure. This evidence can be summarized as follows: Result 2:. Non-binding incentives have a crucial function in making rules effective: in the presence
of non-binding incentives the effect of obligations on individual contributions increases, thus confirming that a major role of incentives is to make an obligation salient. Even extremely week incentives are effective in giving salience to obligations.
16
3.2. Question 2: Clarifying the effects of obligations. How different levels of obligation affect behaviour To better understand how obligations affect unconditional contributions, we now analyze the effect of different levels of obligations for a given structure of incentives. In figure 4 we report average unconditional contributions in three treatments (‘0 Condition’, ‘L Condition’, ‘H Condition) characterised by three different levels of minimum contribution obligations (respectively 0, 4 and 16 tokens) and the same marginal incentive structure.22 Notice that in the treatment where the obligation is 4 tokens and in the treatment where no minimum contribution is required, we observe similar levels of average contribution to the public good (9.36 and 8.30 tokens respectively). On the other hand, the average contribution in the treatment where the obligation is 16 tokens is remarkably higher (15.1 tokens) than in the two other treatments. A Mann-Whitney rank-sum test is applied in order to test the statistical significance of the differences in contribution levels between treatments. Results are reported in Table 1. Mean contributions under the ‘H condition’ are higher at significant statistical levels than mean contributions in both other treatments, while we do not find a significant difference between average contributions under the ‘0 condition’ and under the ‘L condition’. These results confirm the findings obtained by Galbiati and Vertova (2008)23 in a repeated public good game: for given marginal incentives, obligations can affect the average propensity to cooperate to the public good. In particular, when the minimum contribution required is sufficiently high (‘H condition’), the level of cooperation is significantly higher than in the presence of low or null obligation. Instead, when the minimum contribution required by obligation is low (‘L condition’), there is no significant difference with respect to the no-obligation case. A straightforward interpretation of this last result is that, with low obligation, conditional co-operators find confirmation (on average) of their preferences and beliefs when no obligation exists.24 Figure 5 reports the frequencies of contributions in the three samples. The distribution of individual contributions under the ‘L condition’ is not very different from the distribution of individual contributions under the ‘0 condition’, even though in this last case the distribution is more concentrated around an intermediate value (around 8 tokens) and it is almost never below the level 22
In the figures of this and the following section, as we confront only treatments with obligations, we identify the treatment with the level of minimum contribution obligation. Hence ‘MC=0’ identifies the ‘0 condition’ treatment, ‘MC=4’ and ‘MC=16’ identify the ‘L condition’ and the ‘H condition’ treatments respectively. 23 In Galbiati and Vertova(2008) we focus on the effect of obligations in a repeated public good game. Unlike this paper we do not analyze the determinants of the effects of obligations but their dynamic effects on cooperation. 24 Indeed in one-shot public good games with no obligations, average contributions tend to be around 40-50% of the overall endowment because of the behaviour of conditional co-operators. See among others Fischbacher et al. (2001).
17
of 4 tokens fixed as obligation. The distribution of contributions under the ‘H condition’ is very different, being more right-shifted, with individual contributions concentrated around the level of 16-18 tokens. This evidence can be summarized as follows: Result 3. Obligations affect the levels of average contributions to a one-shot public good. In
particular, average contributions are significantly higher when the minimum contribution required by obligation is sufficiently higher than the average contributions in the ‘no obligation’ case.
average contribution
FIGURE 4 UNCONDITIONAL CONTRIBUTIONS (Different levels of obligation) 20 19 18 17 16 15 14 13 12 11 10 9 8 7 6 5 4 3 2 1 0 MC=0
MC=4
MC=16
TABLE 1 MANN-WHITNEY TEST ON UNCONDITIONAL CONTRIBUTIONS Treatment Conditions
L condition
H condition
0 condition
z=-0.321; p=0.7483
z=-2.887; p=0.004
L condition
z=-2.402; p=0.016
18
FIGURE 5 UNCONDITIONAL CONTRIBUTIONS (frequency of contributions in the sample) L condition (Minimum Contribution=4)
10
10
9
9
8
8
frequency of individuals
frequency of individuals
0 condition (Minimum Contribution=0)
7 6 5 4 3
7 6 5 4 3
2
2
1
1
0
0 0
1
2
3
4
5
6
7
8
9
10 11 12 13 14 15 16 17 18 19 20
0
1
2
3
4
5
contribution level
6
7
8
9
10 11 12 13 14 15 16 17 18 19 20
contribution level
H condition (Minimum Contribution=16) 10 9
frequency of individuals
8 7 6 5 4 3 2 1 0 0
1
2
3
4
5
6
7
8
9
10 11 12 13 14 15 16 17 18 19 20
contribution level
The evidence reported above shows that higher obligations pull subjects’ contributions. The next step in our analysis is to understand how obligations work. Our conjecture is that obligations act as focal points on conditional co-operators’ beliefs about others’ behaviour, thus anchoring their contributions. Nonetheless we cannot exclude the possibility that higher obligations also trigger individuals’ motivation to contribute by directly affecting their preferences. The following analysis aims at better understanding the motivational channels through which obligations come into play.
3.3. Question 3: Channels through which obligations affect behaviour 3.3.1 Beliefs Our next step is to study how obligations affect beliefs about others’ contributions. Figure 6 shows, for the three treatments with obligation (‘0 condition’, ‘L condition’, ‘H condition’), the average beliefs about average unconditional contributions in the group. It should be noted that the average 19
beliefs under the ‘0 condition’ and the ‘L condition’ are similar (respectively 9.44 and 8.69 tokens), whereas under the ‘H condition’ they are definitely higher (14.67).
average contribution
FIGURE 6 BELIEFS ABOUT OTHERS’ UNCONDITIONAL CONTRIBUTION 20 19 18 17 16 15 14 13 12 11 10 9 8 7 6 5 4 3 2 1 0 MC=0
MC=4
MC=16
The results of the Mann-Whitney test 25, reported in Table 2, show that the previous descriptive comparison has statistical significance: obligations affect expectations about others’ contributions. In particular, when the minimum contribution obligation is sufficiently high, individuals expect other group members will contribute more. TABLE 2 MANN-WHITNEY TEST ON BELIEFS Treatment Conditions
L condition
H condition
0 condition
z=0.485; p=0.679
z=-2.882; p=0.004
L condition
z=-2.732; p=0.016
This shows that obligations anchor beliefs: beliefs are coordinated towards higher (or lower) levels of expected co-operation when the minimum level of contribution required by obligation is higher (lower). Therefore, when the level of minimum contribution is sufficiently high, conditional cooperators, i.e. those people who want to cooperate when they expect others to contribute to a sufficient extent, will cooperate more to the public good because of the effects of obligations on their beliefs. Result 4 summarizes the evidence on beliefs.
25
The unit of observation in the statistical test is the average group contribution.
20
Result 4. Obligations affect average beliefs about others’ unconditional contributions. In
particular, average beliefs are significantly higher under the condition that the minimum contribution required by obligation is sufficiently high.
3.3.2 Conditional contributions analysis We now analyze the patterns of conditional contributions under the different conditions. The idea here is that conditional contributions schedules catch the full range of individual strategies controlling for beliefs about others’ contributions by means of the strategy method (Fischbacher, Gaechter and Fehr, 2001). Significant differences in conditional contributions schedules across treatments suggest that obligations affect contribution by affecting a set of motivations different to beliefs about other’s contributions. On average, across the 21 choices (where each choice corresponds to each hypothetical average contribution in the group from 0 to 20), conditional contributions are different in the three treatments (see figure 7). In particular, average conditional contributions correspond to 7.81 tokens in the ‘0 condition’, 10.31 tokens in the ‘L condition’ and 12.62 in the ‘H condition’.
average contribution
FIGURE 7 CONDITIONAL CONTRIBUTIONS (average in the sample across 21 choices) 20 19 18 17 16 15 14 13 12 11 10 9 8 7 6 5 4 3 2 1 0 MC=0
MC=4
MC=16
A Mann-Whitney test 26 is applied in order to measure the significance of the differences in average conditional contributions between each pair of treatments. Table 3 reports the corresponding results: for all comparisons (between ‘0’ and ‘L’, ‘L’ and ‘H’, and ‘0’ and ‘H’ respectively), average
26
The unit of observation in the statistical test is the average group contribution.
21
conditional contributions are significantly higher when the minimum contribution required by obligation is higher.
TABLE 3 MANN-WHITNEY TEST ON CONDITIONAL CONTRIBUTIONS Treatment Conditions
L condition
H condition
0 condition
z=-2.242; p=0.025
z=-2.882; p=0.004
L condition
z=-2.242; p=0.025
Figure 8 reports the patterns of conditional contributions under the three different conditions. The curves corresponding to the ‘H condition’ and the ‘0 condition’ differ noticeably over the entire interval between 0 and 20. In particular, the conditional contribution schedule corresponding to the ‘H condition’ is clearly above the one corresponding to the ‘0 condition’. The ‘L condition’ curve differs from the other two curves: with respect to the ‘0 condition’ curve the difference is particularly marked in correspondence to high levels of other people’s hypothetical average contributions, whereas with respect to the ‘H condition’, the difference is more relevant for low levels of others’ hypothetical average contributions. The differences among the conditional contributions schedules highlight that, even if we control for beliefs about others’ contributions by means of the strategy method, average cooperation turns out to be triggered by the level of minimum contribution required by obligation. This means that on average the preference structure is shaped by the obligation imposed in the treatment. In particular, a stronger obligation entails a stronger preference for cooperation.27 To summarize this analysis, our main result is the following: Result 5. Conditional contribution schedules are significantly different across treatments
characterized by different obligation levels. This suggests that obligations directly affect people’s preferences for cooperation.
27
Notice that there is a high degree of consistency between unconditional contributions and the hypothetical contributions
22
FIGURE 8 CONDITIONAL CONTRIBUTIONS SCHEDULES 20
average conditional contribution
18 16 14 12
bisector MC=0
10
MC=4 8
MC=16
6 4 2 0 0
1
2
3
4
5
6
7
8
9 10 11 12 13 14 15 16 17 18 19 20
hypothetical average contribution in the group
3.3.3 Further investigation: Conditional co-operators In order to better interpret the previous results, it is worth analyzing the behaviour of conditional co-operators. To this end, for each treatment with obligation we extract from the overall sample the sub-sample of conditional co-operators, i.e. those individuals whose contributions increase progressively. In particular, following Fischbacher et al. (2001), we select as ‘conditional cooperators’ all the subjects having a positive and highly significant (p-value<0.001) Spearman rank correlation coefficient (between their own and others’ contributions). These sub-samples are composed of 17, 29 and 23 conditional co-operators for the ‘0 condition’, ‘L condition’ and ‘H condition’ treatment respectively. Figure 9 shows how average unconditional contributions for theses sub-samples are very similar to the ones emerging from the overall samples (compare to figure 4). Using the Mann-Whitney test28 to compare unconditional contributions, we find similar results to the overall sample: there is a significant difference in average unconditional contributions between the ‘0 condition’ and the ‘H condition’ and between the ‘L condition’ and the ‘H condition’, whereas there is not a significant difference between the ‘0 condition’ and the ‘L condition’ (table 4).
28
Since the subjects have been selected from all the groups, in this case the unit of observation in the statistical test is the average individual contribution. For this reason, the level of significance of the coefficients is different with respect to the overall sample case.
23
average contribution
FIGURE 9 UNCONDITIONAL CONTRIBUTIONS (CONDITIONAL COOPERATORS ONLY- average in the sample) 20 19 18 17 16 15 14 13 12 11 10 9 8 7 6 5 4 3 2 1 0 MC=0
MC=4
MC=16
TABLE 4 MANN-WHITNEY TEST ON UNCONDITIONAL CONTRIBUTIONS (CONDITIONAL COOPERATORS ONLY) Treatment Conditions
L condition
H condition
0 condition
z=-0.263; p=0.7483
z=-4.068; p=0.000
L condition
z=-4.727; p=0.000
Figure 10 and Table 5 show how average beliefs for these sub-samples of individuals are very similar with respect to the overall samples. Figure 11 reports the conditional contribution schedules for the sub-samples of conditional co-operators in the three treatments (whereas in Figure 12 we report average conditional contributions across the 21 choices). As one can see, they correspond to three parallel, increasing and monotonic curves. The results of the Mann-Whitney test29 (Table 6) show that these differences are statistically significant. This last result is particularly interesting: obligations shape the preference structure of conditional co-operators. Conditional co-operators are willing to cooperate more when a higher minimum contribution is required by obligation. In other terms, obligations can affect the mechanism which is at the basis of cooperation in social dilemmas, i.e. reciprocation among those individuals that are inclined to cooperate as long as others cooperate to a sufficient extent as well. Indeed, given a certain level of average cooperation of the others, a higher minimum contribution required by obligation entails, on average, higher contributions from conditional co-operators.
29
The unit of observation in the statistical test is the average individual contribution.
24
average contribution
FIGURE 10 BELIEFS ABOUT OTHERS’ UNCONDITIONAL CONTRIBUTION (CONDITIONAL COOPERATORS ONLY) 20 19 18 17 16 15 14 13 12 11 10 9 8 7 6 5 4 3 2 1 0 MC=0
MC=4
MC=16
TABLE 5 MANN-WHITNEY TEST ON BELIEFS (CONDITIONAL COOPERATORS ONLY) Treatment Conditions
L condition
H condition
0 condition
z=0.526; p=0.599
z=-3.705; p=0.000
L condition
z=-4.830; p=0.000
FIGURE 11 CONDITIONAL CONTRIBUTIONS SCHEDULES (CONDITIONAL COOPERATORS ONLY) 20
average conditional contribution
18 16 14 12
bisector MC=0
10
MC=4 8
MC=16
6 4 2 0 0
1
2
3
4
5
6
7
8
9 10 11 12 13 14 15 16 17 18 19 20
hypothetical average contribution in the group
25
TABLE 6 MANN-WHITNEY TEST ON CONDITIONAL CONTRIBUTIONS (CONDITIONAL COOPERATORS ONLY) Treatment Conditions
L condition
H condition
0 condition
z=-1.878; p=0.060
z=-3.297; p=0.001
L condition
z=-2.147; p=0.032
average contribution
FIGURE 12 CONDITIONAL CONTRIBUTIONS (CONDITIONAL COOPERATORS ONLY) (average in the sample across 21 choices) 20 19 18 17 16 15 14 13 12 11 10 9 8 7 6 5 4 3 2 1 0 MC=0
MC=4
MC=16
3.3.4 Why do obligations exert just a small effect when they are not backed by nonbinding incentives? An analysis of their effects on beliefs and unconditional contributions in the presence and in the absence of non-binding incentives In the analysis of Question 1, we found that recommended contributions affect individuals’ in a sizeable but weakly statistically significant way if they are not backed by non-binding incentives. To better understand how obligations work in the presence and in the absence of non-binding incentives, we now show the results on differences in beliefs and conditional cooperation in treatments ‘PG condition’ and ‘H condition without incentives’. Figure 13 (first two bars) reports the average beliefs about average unconditional contributions in the two treatments. Notice that the two treatments present small differences in average reported beliefs about other contributions between the ‘PG condition’ and ‘H condition without incentives’ (the level is 8.94 and 11.6 respectively). The result of a Mann-Whitney rank-sum test (with groups as units of observation) shows that this difference is significant just at the 10% level (z= -1.647; p=0.0997). This indicates 26
that suggested contributions alone weekly affect individual beliefs about others’ contributions. Hence, we may infer that a reason why non-binding incentives reinforce the effects of obligations on cooperation is because in their presence obligations are more effective in affecting beliefs about others’ contributions to the public good. This is apparent by comparing these results with those obtained in the previous section comparing the ‘0 condition’ treatment with the ‘H condition’. For the sake of comparison, the second two bars in figure 13 report the average beliefs about others’ contributions in this case (already reported in figure 6). The difference between the two treatments here appears substantially higher (and this is confirmed by the Mann-Whitney tests reported in Table 2). This evidence can be summarized as follows: Result 6: Obligations alone only weekly affect beliefs about others’ contributions. When they are
backed by a non-binding incentives structure, obligations significantly affect average beliefs about others’ unconditional contributions. This suggests that obligations are effective in creating focal points in cooperation in social dilemmas if they are backed by incentives. Obligations and incentives are complements in affecting individuals’ beliefs
FIGURE 13 BELIEFS ABOUT OTHERS’ UNCONDITIONAL CONTRIBUTION (average in the sample) 20 19 18 17 16 15
average stated belief
14 13 12 11 10 9 8 7 6 5 4 3 2 1 0 PG Condition
H Condition No incentives
0 Condition
H Condition
Despite being weakly effective in anchoring individual beliefs about others’ contributions, suggested contributions obligations alone could still be effective in influencing other individual motives of behaviour. To investigate this possibility we focus now on unconditional contributions in the ‘PG condition’ and ‘H condition without incentives’ treatments. Figure 14 reports the patterns of conditional contributions under these two conditions. The two curves referring to ‘PG condition’ and ‘H condition without incentives’ treatments are both increasingly monotonic and are 27
converging in correspondence to high levels of others’ contributions. These differences among the conditional contributions schedules highlight that, if we control for beliefs about others’ contributions by means of the strategy method, average cooperation turns out to be higher if we introduce a minimum contribution obligation in a benchmark public good game. Nonetheless these differences tend to disappear in the case that subjects observed high contributions by other participants. The results of the Mann-Whitney test30 show that these differences are not statistically significant at the conventional levels (z= -1.278; p=0.2012). Suggested contributions are not effective in shaping individual motivations to cooperate differently from beliefs, especially if we fix beliefs about others’ contributions to a high level. A comparison with conditional contribution schedules in the ‘0 condition’ and ‘H condition’ is revealing. In figure 14 we report again conditional contribution schedules about this treatments already reported in figure 8. The difference between the two schedules is remarkably greater than the difference between the schedules of ‘PG condition’ and ‘H condition without incentives,’ especially for high hypothetical contributions by other subjects in the game. We may summarize this evidence in the following:
Result 7. Conditional contribution schedules are not significantly different in the case we compare
a baseline public good game with a treatment with an obligation without incentives. Nonetheless by adding a non-binding incentive structure we observe a great difference between conditional contribution schedules in the presence and in the absence of an obligation. This suggests that nonbinding incentives complement obligations in affecting people’s preferences for cooperation. FIGURE 14 CONDITIONAL CONTRIBUTIONS SCHEDULES IN THE PRESENCE AND ABSENCE OF INCENITIVES 20 18
average conditional contribution
16 14 PG Condition
12
H Condition No incentives H Condition
10 8
bisectrice
6
0 Condition
4 2 0 0
1
2
3
4
5
6
7
8
9 10 11 12 13 14 15 16 17 18 19 20
hypothetical average contribution in the group
30
The unit of observation in the statistical test is the average individual contribution.
28
It is worth noting that the conditional contribution schedules in the ‘PG condition’ and ‘0 condition’ overlap. This confirms that individual motivations to cooperate differently from beliefs are not influenced by the presence of non-binding incentives per se. It is instead the coupled presence of recommended contributions and non-binding incentives that drives individual motivations, as in this case recommended contributions are perceived as obligations.
Moreover, a comparison between the ‘PG condition’ and ‘0 condition’ provides us with some further insight into the behavioural effect of incentives. Note that the game played in the ‘0 condition’ is a basic linear public good game with a non-binding incentive to contribute. In recent years a burgeoning literature in behavioural economics has focused on the crowding-out and crowding-in effects of incentives in similar situations.31 In our case we observe neither crowding-in nor crowding-out of contributions in the absence of obligation. A plausible reason is that here incentives are exogenously fixed by a third party with respect to others’ behaviour, and hence they do not provide any information about others’ motivations. This suggests that incentives activate or crowd-out social preferences when they are endogenous with respect to group behaviour. In this last case they are able to convey relevant information about others’ behaviour and intentions.32
4. Comments and concluding remarks Understanding how formal rules affect human behaviour is a fundamental task for economic theory and for policy makers. Economic literature has largely studied the role of incentives in shaping people’s choices. Incentives can modify the payoffs for individuals’ actions, thus inducing desired behaviours. Nonetheless, incentives are often very low and deviations from behaviours recommended by formal rules are characterized either by low probabilities of monitoring or small sanctions for undesired behaviours. Despite such a widespread presence of weak incentives, people often abide by the rules. Explaining why people comply with rules in the presence of weak incentives is a major puzzle in economics. Other disciplines such as legal theory and social psychology suggest that obligations, that is to say the normative contents of rules, play a crucial role in driving individuals’ behaviour. 31
See Bowles (2008), Fehr and Falk (2002) and Frey and Jegen (2001) for insightful reviews. This evidence is consistent with the results of Tyran and Feld (2006) showing that exogenous mild sanctions do not anchor contributions in public good games while endogenously voted mild sanctions affect contributions significantly.
32
In a coordination game setting Galbiati, Schlag and Van der Weele (2008) show that when incentives are set by a third party according to the observed behaviour of a group they are able to anchor individuals’ beliefs about others’ action by providing information about other actions.
29
Yet, we still know very little on how obligations affect behaviour and how they interact with the incentives part of a rule. In this paper, by running a series of modified public good games we have contributed to clarify these aspects, thus providing a more complete view of how formal rules work. We have found that obligations have a sizeable effect on cooperative behaviour even in absence of incentives. When non-binding incentives are introduced, requested contributions strongly sustain cooperation. This suggests that the content of the rule is perceived as an obligation when it is backed by a system of incentives whose main role in this case is not to modify the payoffs for material actions but to give salience to the content of the rule. Moreover, we have found that variations in obligations affect behaviour even when incentives are held constant. Furthermore, through a strategy based on the elicitation of beliefs and conditional contributions to the public good, we have found that the effect of obligations on behaviour depends not only on their impact on people’s beliefs about others’ contributions, but also on their direct effect on individuals’ preferences for cooperation. These results33 add to the literature concerning the effects of institutions (i.e. the formal rules of the game) on human behaviour from several points of view. They complement the literature on the behavioural effects of incentives both by showing that obligations also entail some behavioural effects on individual choices, and by highlighting the fact that incentives may affect behaviour not only by changing payoffs and/or activating social preferences but also by giving salience to obligations. Furthermore, our research has been able to highlight the channels through which formal rules influence individual willingness to cooperate. This aspect of the research is particularly important. Recent contributions have analyzed how changes in rules (e.g. in the structure of incentives) affect individual behaviour in an unexpected way (e.g. Gneezy and Rustichini, 2000a); nonetheless, very little is known about the channels of transmission by which rules exert their effects on behaviour. Our investigation shows that rules can affect both beliefs about others’ behaviour and people’s preferences for cooperation. These findings support the idea that formal rules and laws have an expressive power: they affect behaviour not only by shaping the material payoffs, but also by directly influencing people’s motives for behaviour (Cooter, 2000) and by acting as focal points (McAdams, 2000).
33
Note that our results are in line with those of Falk, Fehr and Zehnder (2006) on the behavioural effects of minimum wages.
30
References Andreoni, J., Erard, B. and Feinstein, J. 1998. “Tax compliance”. Journal of Economic Literature, 36(2), 818-860. Bar-Gill, O., Fershtman, C. 2004. “Law and Preferences”. Journal of Law Economics and Organization. 20: 331-352. Benabou, R., Tirole, J. 2006. “Incentives and prosocial behaviour”. American Economic Review, 96(5), 1652-1678 Benabou, R., Tirole J., 2003. “Intrinsic and extrinsic motivation”. Review of Economic Studies, 70(3): 489-520. Bohnet, I., Frey, B., Huck, S. 2001. “More order with less law: on contract enforcement, trust and crowding”. American Political Sciences Review. Bowles, S., 2008. “Policies designed for self-interested citizens may undermine ‘the moral sentiments’: evidence from economic experiments”. Science, 320:5883. Bowles, S., Hwang, S. forthcoming. “Social Preferences and Public Economics: Mechanism design when social preferences depend on incentives”. Journal of Public Economics, 92(8), 1811-20. Camerer, C.F., Fehr, E., 2002. “Measuring social norms and preferences using experimental games: a guide for social scientists”, forthcoming in Heinrich J., Boyd, R., Bowles, S., Camerer, C., Fehr, E., Gintis, H., (Eds), Foundation of human sociality. Experimental and ethnographic evidence from 15 small-scale societies, Oxford University Press. Cooter, R. 2000. “Do good laws make good citizens? An economic analysis of internalized norms”. Virginia Law Review, 86: 1577-1601. Falk, A., Fehr, E., Fischbacher, U. (2005) “Driving Forces Behind Informal Sanctions”. Econometrica, 7 (6), 2017-2030. Falk, A., Fehr, E., Zehnder, C., 2006. “The behavioural effects of minimum wages. Quarterly Journal of Economics, 121(4) Falk, A., Kosfeld, M., 2006. “Distrust – The hidden cost of control”. American Economic Review. 96 (5), 1611 - 1630 Fehr, E., Falk, A., 2002. “Psychological foundations of incentives”. European Economic Review, 46: 687-724. Fehr, E., Schmidt, K., 2002. “Theories of fairness and reciprocity: evidence and economic applications”, in Dewatripont, M., Hansen, L. and S. Turnowsky eds., Advances in economics and econometrics, Cambridge University Press. Fischbacher, U., Gaechter, S., Fehr, E., 2001. “Are people conditionally cooperative? Evidence from a public goods experiment”. Economics Letters, 71: 397–404. 31
Fischbacher, U., 2007. “z-Tree: Zurich Toolbox for Ready-made Economic experiments”, Experimental Economics 10(2), 171-178. Frey, B.S., Jegen, R. 2001. Motivation crowding theory: A survey of empirical evidence. Journal of Economic Surveys 15, 589–611 Galbiati, R., Vertova, P., 2008. “Obligations and Cooperative Behaviour in Public good games”, Games and Economic Behavior. Forthcoming, Galbiati, R., Schlag, K., Van der Weel, J. 2008 “Can sanctions create sceptics? An experimental investigation”. mimeo Gneezy, U., Rustichini, A., 2000. “Pay enough or don’t pay at all”, Quarterly Journal of Economics, 115: 791–810. Gneezy, U., Rustichini, A., 2000a. “A fine is a price”. Journal of Legal Studies, 29:1-17 Holt, C.A., Laury, S., 2001. “Risk aversion and incentives effects”. American Economic Review 92: 1644-1655. Huck, S. 1998. “Trust, treason, and trials: An example of how the evolution of preferences can be driven by legal institutions” Journal of Law, Economics, & Organization. 14: 44-60. Kahan, D.M., 1997. Social influence, social meaning and deterrence. Virginia Law Review 3, 34995. Mailath, G.J, Morris, S., Postlewaite, A. 2001. Laws and Authority. Mimeo McAdams, R.H. 2000. “A focal point theory of expressive law”. Virginia Law Review, 86, 16491729, Raz, J., 1980. The concept of a legal system. Oxford University Press, Oxford. Slemrod, J. 1992. Why people pay taxes. Tax compliance and Enforcement. University of Michigan Press, Ann Arbor. Selten, R., 1967. “Die Strategiemethode zur Erforschung des eingeschra¨nkt rationalen Verhaltens im Rahmen eines Oligopolexperimentes”, In: Sauermann, H. (Ed.), Beitrage zur experimentellen Wirtschaftsforschung. J.C.B. Mohr (Paul Siebeck), Tubingen, pp. 136–168. Tversky, A., Kahneman, D.(1974). „Judgment under uncertainty: Heuristics and biases.“ Science, 185, 1124-1130 Tyler, T. 1990. Why people obey the law. Yale, New Haven. Tyran, J.R., Feld, L. 2006. “Achieving compliance when legal sanctions are non-deterrent”. Scandinavian Journal of Economics, 108(1), 135-156.
32
Appendix 1: Controlling for differences in risk preferences In order to control for the possible effect of risk preferences, at the end of the public good experiment we run a lottery to single out subjects’ risk preferences. This lottery is similar to that implemented by Holt and Laury (2001). The experimental test is based on five choices between the paired lotteries reported in Table A1. TABLE A1 PAIRED LOTTERY CHOICES Option A 1/10 100 tokens; 9/10 80 tokens 3/10 100 tokens; 7/10 80 tokens 5/10 100 tokens; 5/10 80 tokens 7/10 100 tokens; 3/10 80 tokens 9/10 100 tokens; 1/10 80 tokens
Option B 1/10 170 tokens; 9/10 10 tokens 3/10 170 tokens; 7/10 10 tokens 5/10 170 tokens; 5/10 10 tokens 7/10 170 tokens; 3/10 10 tokens 9/10 170 tokens; 1/10 10 tokens
Payoff Differences (A-B) 56 28 0 -28 -56
In each paired lottery, subjects choose between an alternative A and an alternative B. Once all subjects have taken their choice, a pair of lotteries is randomly chosen and the computer assigns to each subject the option (A or B) she has chosen. Finally the lottery is run in order to determine each subject’s payoff. Following the method proposed by Holt and Laury (2001), we classify individual risk preferences according to the sequence of choices taken in the lottery (see Table A2). TABLE A2 RISK PREFERENCES ASSOCIATED TO LOTTERY CHOICES Sequence of Choices A-A-A-A-A A-A-A-A-B A-A-A-B-B or A-A-B-B-B A-B-B-B-B B-B-B-B-B Other Sequences
Risk type highly risk averse risk averse risk neutral risk lover highly risk lover inconsistent coiches
In table A3 we report the frequencies of subjects by classes of risk preference in the three treatments with different levels of obligation. TABLE A3 FREQUENCIES OF SUBJECTS BY CLASS OF RISK PREFERENCES
Classes of risk preferences
0 condition (MC=0)
L condition (MC=4)
H condition (MC=16)
Highly risk averse
6
1
2
Risk averse
5
3
6
Risk neutral
14
23
16
Risk lover
1
2
0
Highly risk lover
1
1
1
Inconsistent choices
9
6
11
33
It is worth noting that the frequencies are similar across the different samples. Furthermore, we notice that the number of risk-lover or highly risk-lover individuals is very small. In order to test whether or not differences in risk preferences are relevant in explaining differences in contributions, we have subdivided our sample into three groups: the first group is composed of risk-neutral individuals, the second composed of risk-adverse individuals and the third one is composed of highly risk-adverse individuals34. Moreover we compute for each subject an index given by the difference between her unconditional contribution and the minimum contribution required in her treatment. Then we apply a Mann-Whitney rank-sum test35 of the difference in this index between each pair of groups. The test between risk neutral and highly risk-adverse individuals yields z = -1.295, which is not statistically significant at conventional levels. The same test applied to the difference in this index between risk-neutral and risk-adverse individuals yields z = -0.627, which is certainly not statistically significant. Finally, the difference between highly risk-adverse and risk-adverse individuals is also found not to be statistically significant (z = -0.539). Hence, differences in subjects’ risk preferences across the different samples do not affect our results for two reasons. First, the distribution of subjects by class of risk preference is very similar in the different sessions. Second, there is no significant difference in individual behaviours with respect to the minimum contribution between highly risk-adverse, risk-adverse and risk-neutral individuals. This last result can be explained by the fact that the probability of being audited in each round, and the penalty rate, are very low.
34
We have not considered risk-lover or highly risk-lover individuals, who represent a negligible fraction of subjects in the sample, nor individuals whose choices are inconsistent. 35
The unit of observation in the statistical test is the individual.
34
Appendix 2: Instructions The following instructions were originally written in Italian. We document the instructions used in the treatment ‘H condition’ (both for the public good game and the lottery).
2A - The public good game Instructions Welcome in the Lab and thanks for participating in this experiment. You are now taking part to an economic experiment in which, depending on your decisions, you can earn a considerable amount of money. From now on, it is prohibited to communicate with the other participants during the experiment. If you violate this rule you will be excluded from the experiment and from all payments. Hereafter we describe the experiment in detail. Please, read the following instructions carefully. It is in your and our best interest that you fully understand the instructions, so please feel free to ask any question.
How will your income be paid? During the experiment your entire earnings will be calculated in tokens. At the end of the experiment the total amount of tokens you have earned will be converted to Euros at the following rate: 3 tokens = 1 Euro Each participant receives a lump sum payment of 3 Euros for participating. At the end of the experiment your earnings from the experiment and the 3 Euros for participating will be immediately paid to you in cash.
How long is the experiment? How many people do take part to it? The experiment is divided into three steps. In all three steps participants are divided into groups of six people. Therefore you will be in a group with 5 other participants. The composition of the groups will not change during the experiment. Therefore in each step your group will consist of the same participants (whose identity you do not know).
First step In this step you have to decide the amount of your contribution to a common project for your group. As all your group members, you will receive an endowment of 20 tokens. Your task is to decide how to use your endowment. In particular, you have to decide how many of the 20 tokens you want to contribute to the project (notice that you have to choose a natural number between 0 and 20). The remaining tokens (20 - your contribution) are kept for yourself.
35
What is the aim of the project? The project returns to the group a common product. The common product is an amount of tokens higher than the total sum of the contributions to the project made by the members of your group. The common product is divided equally among all the group members. Each group member obtains an individual product. In particular, the sum of the individual contributions to the project will be multiplied by 1.8 before being divided equally among the six group members. The individual product can be represented by this simple expression: individual product =
G × 1,8 6
where: G = sum of the individual contributions of all group members to the project; 6 = number of group members. An example. Suppose that the sum of the contributions to the project from all the group members is 60 tokens. The project returns a total amount of:
60 × 1.8 = 108 tokens This amount of tokens will be equally redistributed among the group members. Hence, each member of the group earns from the project:
60 × 1.8 = 60 × 0,3 = 18 tokens. 6 Therefore, your contribution to the project also raises the income of the other group members. On the other hand, you earn an income from each token contributed by the other members. For each token contributed by any other member you will earn 0.3 tokens. Remember that your feasible contribution is any integer number between 0 and 20.
The minimum contribution A minimum contribution to the project equal to 4 tokens is required to each individual.
The input screen The following input screen will appear:
36
You have 1 minute to make this choice. In the top right corner you can see how many more seconds remain for you to decide about your contribution. Your decision must be made before the time displayed is 0 seconds. In the middle of the screen, it appears the minimum contribution. Below it, you can see your endowment and then the input field where you have to write a number between 0 and 20. On the right down corner there is the button OK to confirm your choice. Let’s sum up the procedure. You have to decide how much to contribute to the project by writing a number between 0 and 20 in the input field. By deciding how much to contribute, you also decide how much you keep for yourself, that is to say: (20 – your contribution). After having written your contribution, you have to click on the OK button. Once you have done this, your decision can no longer be revised.
Second step In the second step you have to declare your conditional contributions, i.e. you have to decide how much of your 20 tokens you would contribute to the common project given the information that your group members contribute in average certain amounts of tokens and given that a minimum contribution of 4 tokens is required. Technically, you have to fill the table of conditional contributions declaring how much you would like to contribute for any hypothetical average contribution of your group members from 0 to 20. You have 3 minutes of time to fill the table. The input screen will appear as follows:
37
On the left of each square you can see the hypothetical average contribution of your group members (from 0 on the top left to 20 on the down right). Given that, you have to write in the corresponding square how much you would like to contribute to the common project. You have to fill all squares. You have 3 minutes to do it. After having took all decisions, please click on the button OK. What is the actual contribution to the common project? Once all players have taken the first and the second choice, in each group one player will be randomly selected. For this player the actual contribution to the project will be selected on the basis of the conditional contribution schedule: in particular her actual contribution will be the conditional contribution in correspondence to the average unconditional contributions actually made by the other 5 players in the first step. Instead, for the other 5 players, the relevant contributions to the common project are their unconditional ones made in the first step. ATTENTION: The probability to be selected (in which case the actual contribution for you is your conditional contribution) is 1/6. Each member of the group receives an identification number from 1 to 6. Then the computer will randomly choose an integer between 1 and 6: the player corresponding to the extracted number will be selected and her actual contribution will be the conditional one. Instead for all other players the unconditional contributions are the relevant ones. An example Suppose that your identification number is extracted. This means that your relevant contribution is the conditional one taken in the second step. Instead, for the other five members of the group the relevant choice is the unconditional one taken in the first step. Suppose that these five players have contributed respectively 0, 2, 4, 9 and 5 tokens to the common project. Their average unconditional contribution is therefore 4 tokens.
38
If in your conditional contribution table you have declared to be willing to contribute 3 tokens in case the others in the group would contribute 4 tokens, your actual contribution to the common project will be 3 tokens and the total contributions to the project will be equal to 0+2+4+9+5+3=23 tokens such that each member of the group gets 23 x 0,3=6,9 tokens from the common project. If instead you have declared to be willing to contribute 10 tokens in case the others would contribute in average 4 tokens, your actual contribution to the common project is 10 tokens and the total contribution to the project will be 0+2+4+9+5+10= 30 tokens. Hence each member of the group gets 9 tokens from the common project.
AT THE END OF THESE TWO STEPS, THERE WILL BE A MONITORING STAGE
The monitoring stage After the two contribution stages, there is the possibility that the actual contribution of one group member will be monitored. The choice will be random. The computer will randomly select an even or odd number. The extraction of an even number implies that there will be a check of the contributions; on the other hand if the result of the extraction is an odd number the contributions will not be checked. If the contributions within the group will be checked, the computer will randomly choose an integer between 1 and 6, corresponding to the identification number of the subject that will be checked. Notice that for each member of the group the probability of being checked in a certain period will be the probability of the extraction of an even number multiplied by the probability of being extracted in a group of six members, that is to say:
p=
1 1 1 × = ≅ 8,33% 2 6 12
What are the effects if your contribution is checked? If the contribution of the member is equal to the minimum contribution required, the check will not have any effect on her earnings. If the contribution of the member is lower than the minimum contribution required, an amount of 1,2 tokens will be subtracted from her endowment for each token of difference between the minimum contribution and her actual contribution. If instead the contribution of the member is higher than the minimum contribution required, an amount of 1,2 tokens will be added to her endowment for each token of difference between the minimum contribution and her actual contribution. Notice that the tokens subtracted from the checked subjects who contribute less than the minimum contribution will not be added to the common project and the tokens received by the audited subject whose contribution is higher than the minimum one will not be subtracted from the common project. An example Suppose that the minimum contribution is fixed to 3 tokens
39
- Suppose that the subject contributes 1 token. In case her contribution is checked, 2,4 more tokens will be subtracted from her endowment, that is to say:
1,2 × (minimum contribution – actual contribution of the subject) = 1,2 × (3 − 1) = 2,4 . - Suppose now that the subject contributes 5 token. In case her contribution is audited, she will receive 2,4 more tokens, that is to say:
1,2 × (actual contribution of the subject–minimum contribution) = 1,2 × (5 − 3) = 2,4 . How will your income be calculated? After all group members have made their unconditional and conditional contributions and after a possible control, your income is calculated by summing three components: 1. The tokens you have kept for yourselves, that is to say: Endowment – your actual contribution 2. The individual product from the common project: Total group contributions ×
1,8 6
3. The effect of the monitoring: a. 0, if you have not been checked or if you have been checked but you have contributed exactly 10 tokens (the minimum contribution). b. if you have been checked and you have contributed less than the minimum contribution required, your income will be reduced by: (minimum contribution – your actual contribution) × 1,2 c. if you have been checked and you have contributed more than the minimum contribution, your income will be increased by: ( your actual contribution – minimum contribution) × 1,2 The income can be expressed by the following expression:
s = D−c+
G × 1,8 + (c − m ) × 1,2 6
where: s = income; D = initial endowment; c = your contribution to the project; G =total group contribution to the project; m = minimum required contribution.
40
BEFORE KNOWING YOUR GAIN FROM THE EXPERIMENT, THERE IS A THIRD STEP.
Third step In this third step you can obtain a further gain from the experiment. You have to guess what is the average unconditional contributions of your group members (i.e. the mean of the first step contributions). You have to fill this screen:
You have to write in the square a number between 0 and 20 and then click OK. You have 1 minute to do it. If the average unconditional contributions of your group members (approximated to the nearest integer) is equal to your guess, your total gain will be increased of 3 tokens. The income screen After all the three steps are completed, the following screen (‘income screen’) will appear:
41
On the income screen, you will see your previous choices and you will know the sum of the contributions of the members of your group to the common project (including your contribution), your gain from the common project, whether or not the group has been monitored, whether or not you have been checked, the effect of the possible check, whether or not your guess about others’ average unconditional contribution has been correct and, finally, your overall income. You have 45 seconds to see the income screen. If you have finished with it before the time is expired, please press the OK button.
2B - The lottery Instructions You are now taking part to a last experiment in which, depending on your decisions, you can earn an additional sum of money. We ask you not to talk with others until the end of the experiment. Hereafter the experiment is described in detail. If you do not have perfectly understood the rules of the experiment, do not hesitate to ask for further explanations to the experimenters.
What is the income from the experiment?
42
In the experiment your income is calculated in tokens. At the end of the experiment, your income in tokens will be converted to euros at the rate of: 100 tokens = € 1 The income will be paid to you in cash together with the show up fee of € 3 and the income gained in the previous experiment. In this experiment you are not part of any group. Your decisions do not influence others’ income and others’ decisions do not influence your income.
What do you have to decide in the experiment? Hereafter you will see a screen with a sequence of 5 choices you have to take. For each choice you have to indicate if you prefer a lottery A or a lottery B. Let’s give an example of the possible choice: Lottery A CHOICE 1
Lottery B or
70% 50 tokens 30% 200 tokens
50% 90 tokens 50% 100 tokens
Lottery A gives a gain of 50 tokens with a probability of 70% and a gain of 200 tokens with a probability of 30%. Lottery B gives a gain of 90 tokens with a probability of 50% and a gain of 100 tokens with a probability of 50%. You have to indicate if you prefer the lottery A or the lottery B. You must take 5 choices, where each choice is between a lottery A and a lottery B.
How your earnings are calculated? Once you have taken the five choices (and so indicated five lotteries, one for each pair A-B), the computer will randomly extract one of the five lotteries you have chosen. At this point, given the chosen lottery, the computer will extract your gain accordingly to the probability indicated by this lottery. Example. Suppose the computer extracts the following lottery (one of those you have chosen): 60% 100 tokens 40% 180 tokens At this point the computer will extract your gain from the experiment: with a probability of 60% it will extract a gain of 100 tokens, whereas with a probability of 40% a gain of 180 tokens. The equivalent in euros of your gain will be paid to you in cash at the end of the experiment together with the show up fee (€ 3) and your income from the previous experiment.
43