Improving robustness of a likelihood-based beamformer in a real environment for automatic speech recognition �� �
Luca Brayda , Christian Wellekens , Maurizio Omologo
�
Institut Eurecom, 2229 Route des Cretes, 06904 Sophia Antipolis, France �
�
brayda,wellekens � @eurecom.fr
ITC-irst,Via Sommarive 18, 38050 Povo (TN), Italy �
omologo � @itc.it
Abstract Performance of distant-talking speech recognizers in real noisy environments can be increased using a microphone array. In this work we propose an N-best extension of the Limabeam algorithm, which is a likelihood-based adaptive filter-and-sum beamformer. We show that this algorithm can be used to optimize the noisy acoustic features using in parallel the N-best hypothesized transcriptions generated at a first recognition step. The parallel and independent optimizations increase the likelihood of minimal word error rate hypotheses and the resulting N-best hypotheses list is automatically re-ranked. Results show improvements over delay-and-sum beamforming and Unsupervised Limabeam on a real database with considerable amount of noise and limited reverberation.
2. The Limabeam algorithm The Limabeam algorithm uses an adaptive filter-and-sum beamformer. Such a beamformer can be represented as follows: ��� �
�
�
�������
� � � ���� � � �
(1)
where � � � � is the discrete time domain signal received at the � -th microphone, � � � is the FIR filter for the � -th chan� of the beamformer, � denotes convolution nel, ��� � is the output and is the time index. The whole set of FIR coefficients of all microphones can be represented by a super-vector � . For each frame, recognition features can be derived and expressed in function of � :
1. Introduction
����� �� "!$#&% �('*),+.- FFT �0/1� ��2 - 354
Recognizing speech in real environments is as much difficult as the amount of noise increases and the speaker is far from the microphone. Recent studies [1] showed that speech quality in terms of signal to noise ratio (SNR) can be increased using microphone arrays. By exploiting the spatial correlation among multi-channel signals, one can steer the array toward the speaker (beamforming). This can be done by simply exploiting inter-channel destructive interference of noise with a delayand-sum technique (D&S) [2], where inter-sensor delays are estimated and applied to each channel signal. Alternatively, perchannel filters (filter-and-sum) can be implemented: these filters can be fixed or adapted on a per-channel or per-frame basis, depending on the chosen criterion. [3, 4]. In this work we address the problem that increasing the SNR does not imply increasing recognition performance to the same extent [5]. Seltzer [6, 7] proposes to apply an adaptive filter-and-sum beamformer based on a Maximum Likelihood criterion (Limabeam) rather than on the SNR. In this method filters are blindly adapted using clean speech models which best align noisy speech features. Then the recognizer uses the sum of the filtered signals to generate a final transcription. In a recent work [8] we have shown that considering in parallel N-best hypotheses instead of the best one, prior to optimization, can increase recognition performance close to that of a supervised algorithm. This was done by synthetically adding real noise to a clean speech database. In this work we test such approach in a real environment and we show that performance of Limabeam can be further improved.
where /6� �� is the observed vector, - FFT �0/1� ��2 - 3 is the vector of individual power spectrum components, + is the Mel filter matrix and ����� �� is the vector of the Log Filter Bank Energies (LFBE). Cepstral coefficients are derived via a DCT rotation: ��78� ��
DCT �0� � � ��2 9
(2)
(3)
Limabeam aims at deriving a set of M FIR filters, which maximize the likelihood of ����� �� given an estimated state sequence of a hypothesized transcription. This is expressed by: �
:
<;>=?%A@B;DC �0����� �� - H EGF
(4)
where H is the hypothesized transcription, F �0�6� �� - H is the likelihood of the: observed features given the transcription considered and � is the FIR parameter super-vector derived. The optimization is done via non-linear Conjugate Gradient. The state sequence can be estimated either using the array beamformed output (Unsupervised Limabeam) or, alternatively, assuming that the correct transcription is available (Oracle Limabeam). More details can be found in [5]. The Unsupervised Limabeam works well in noisy environments, even with a single channel. However, we found that preliminary experiments revealed two facts: first, the Oracle Limabeam performance on a single channel was close to the simple D&S on eight channels; second, there was still a margin of improvement between the Unsupervised and the Oracle Limabeam version applied to the multi-channel signals.
0.8 0.7
LLH after N-best opt. LLH before N-best opt. chosen ML hypothesis
N-best
...
REC
3aP` a`
aP` a` 1
FE
FIR FIR FIR FIR
2-best 1-best
Delay (CSP) FIR FIR FIR FIR
1-best optimizer
REC
ALIGN
2
OPT
FIR FIR FIR FIR
cP3dPc dc FE bPbPbPcPb dPc dc 1
FIR FIR FIR FIR
2
REC ALIGN OPT
0.5 0.4 0.3
FIR FIR FIR FIR FIR FIR FIR FIR
FE
3fPe fe
fPe fe 1
2
REC ALIGN OPT
0.2
new 2-best new 1-best
N-best optimizer
... ... ... ... ... ... ... ... ...
0.6
FE
new N-best
LLH after before
PSfrag replacements
The Limabeam algorithm increases the likelihood of the first hypothesized transcription after a first recognition step. We propose to apply N-best such optimizations independently and in parallel: this approach is based on the fact that the N-best hypotheses list, prior to optimization, is ranked by likelihood and not necessarily by Word Error Rate (WER), which should be our optimal criterion. By applying the LimabeamPSfrag algorithm on replacements each hypothesis, the ranking order of the N-best list changes. We show at experimental level that the new hypothesis chosen (the new maximally likely) in this new list has, on average, a lower WER than the first chosen in the old list (see Figure 1)
[P[PZZ [P[PZZ [[ZZ [ZP]\P[PZ]P\ [Z]\ ]\P]P\ ]P\]P\ ]\]\ __^^PP_P_P^^ __^^ _^PYPX _P^YPX _^YX YXPYXPYPXYPX YXYX UUPTTPUPTUPT UUTT UTPWVPUPTWPV UTWV WVPWPV WPVWPV WVWV QQOOPPQPQPOO QQOO QOPSPR QPOSPR QOSR SRPSRPSPRSPR SRSR
2-best optimizer
3. N-best approach to optimization
...
LLH rescoring recognized sentence
0.1 0
Figure 2: Limabeam.
1-best 2-best 3-best 4-best 5-best 6-best 7-best 8-best 9-best 10-best
Figure 1: Example of normalized Log-LikeliHood (LLH) of 10 best hypotheses of a single phrase. Before optimization, transcriptions are ranked by likelihood. After, all likelihoods are increased and the 4th hypothesis, which has a lower WER than the 1st, is now the new maximally likely. Note that here “N-best” results from a preliminary reduction to a list that does not include repetitions of the same word sequence, which could be caused by different number and location of silences/background noise units. The system is described in the following. For each of the N-best hypotheses we derive a set of FIR filters: : ;DC �0����� �� - H IA ��I <;>=?%A@BEG F
(5)
where H I is the n-th hypothesized transcription at first recognition step, F �0�A� �� - H I is the likelihood of the observed features given the n-best transcription considered. Note that Equation (5) is equivalent to Unsupervised Limabeam when n is 1. After all the N-best FIR vectors are optimized in parallel, new features are calculated and recognition is performed. The transcription which gives the ML is then chosen: : J : <;>=?%1@B;>C K �0� 7 � ��IL - H : I8 I F :
(6)
where H I : is the transcription generated at second step recognition: and J is the index of the most likely transcription, which is HNI M . Note that the optimization is done in the LFBE domain, while recognition is done in the Cepstral domain as in [7]. We re-score likelihoods in the Cepstral domain as well. The system we propose is depicted in Figure 2. The signal coming from a microphone array is processed via conventional D&S, then Feature Extraction (FE) and a first recognition step is performed (REC). The HMM recognizer generates N-best hypotheses. For each hypothesis and in parallel, the Limabeam
Block diagram of the N-best Unsupervised
algorithm is applied: first a Viterbi alignment is performed (switch to 1: ALIGN) and fixed, then FIR coefficients are adaptively optimized via Conjugate Gradient (switch to 2: OPT). After convergence, the N-best features are recognized (switch to 3: REC) and another set of new transcriptions is produced. Finally, the last block compares the new N-best Log-LikeliHoods (LLH-rescoring) choosing the highest and the recognized sentence is produced. Our experiments show that with a N-best approach the Oracle Limabeam proposed in [7] is no more an upper bound to Limabeam performance: a Baum-Welch alignment should produce a more accurate frame-state match, with consequently a possibly better optimization. In order to obtain a new upper bound we introduced knowledge of the correct transcription in the LLH rescoring block: instead of Equation (6), we choose the transcription which has the minimum distance from the correct one. The blind N-best approach is thus coupled with an a-posteriori evaluation of the best hypothesis: this can represent a measure of the efficiency of the likelihood criterion.
4. Environmental setup Experiments were conducted using the HTK HMM-based recognizer [9] trained on the clean TI-digits corpus. Word models are represented by 18 state left-to-right HMMs. Output distributions are defined by 1 Gaussian pdf. The training set consists of 8440 utterances, pronounced by 110 speakers (55 men and 55 women). The test-set consists of 1001 phrases, recorded in the room described in Figure 3. The room (located in the ITC-irst laboratory) measures 5 x 4 meters and it has a relatively short reverberation time (143 ms), which allows us to combat more the effects of additive noise rather than convolutional distortions. Clean speech was played by a high quality speaker (Tannoy 600A Nearfield
DOOR NIST MARK III/IRST 64 mics
5m
useful signal energy. Cepstral Mean Normalization (CMN) is applied. While recognition is performed in the cepstral domain, the optimization process is done in the LFBE domain using 16 coefficients for the features and single-Gaussian output distributions [7] for the models, but without CMN. No modifications were applied to the original Limabeam, to ensure compliance with Seltzer’s work.
5. Results and Discussion
SIMULATED SPEAKER
4m
Figure 3: Data acquisition room: clean speech is played by the central speaker, noise is continuously played by 8 speakers around the central one. SNR measured at source-level is 0dB.
The specific environment chosen let us achieve high performance with D&S beamforming only, which performs best when the noise field is diffuse. This is evident by observing single microphone (in Table 1) and D&S (first line of Table 2) performance: microphones closest to the central speaker have mic Acc. mic Acc.
1 50.76% 33 62.52%
9 57.26% 41 64.21%
17 63.91% 49 62.76%
25 61.46% 57 52.69%
Table 1: Recognition performance for each chosen channel of the MarkIII. The best results are observed where the sensor is closer to the central speaker. Results in digit accuracies.
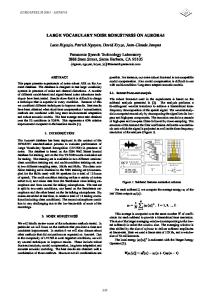
Figure 4: Spectrogram of a phrase recorded with a single microphone of MarkIII: the microphone captures noise from the 8 distributed speakers together with clean speech from the speaker in front of the array
Monitor). Noise was simultaneously played by 8 sources and the average SNR is 0dB. Note that the SNR is measured at source-level: the true SNR varies depending on speakers and microphones location. Signals were recorded by the NIST MarkIII/IRST [10], placed at 1.3 meters from the Tannoy speaker. This device is a linear 64-microphones array, with 2 cm sensor spacing. For our task we chose to use 8 microphones, 16 cm spaced from each other: this configuration represents a trade-off among the high performance which depend on an increasing number of sensors, spatial aliasing requirements and the need of a reasonable complexity and time response of the system (for filters optimization). The MarkIII samples audio data at 44.1 kHz: in this environment we observed that performance do not significantly depend on the sampling frequency, thus for efficiency reasons data were sub-sampled at 16 kHz with a three stage polyphase filter. The FIR filters to be optimized are 10 taps long. The feature extraction involves 12 Mel Frequency Cepstral Coefficients (MFCC) and the log-Energy together with their first and second derivatives, for a total of 39 coefficients. Features were calculated every 10 ms, using a 25 ms sliding Hamming window. The frequency range spanned by the Mel-Scale filterbank was limited to 100-7500 Hz to avoid frequency regions with no
Method D&S U.L. O.L. N-best L. (40). a-post (40)
Sup X X
Un X X X
Acc 80.74% 83.16% 83.49% 83.83% 85.13%
RI 12.5% 14.2% 16% 22.8%
Table 2: Performance of different beamformers: D&S, Unsupervised Limabeam (U.L.), N-best Limabeam (N-best L.),Oracle Limabeam (O.L.) and a-posteriori N-best Limabeam (a-post). The optimization considers up to 40 hypotheses in parallel. We specify for each method if it is unsupervised (Un) or supervised (Sup), the digit accuracy (Acc.) and the relative improvement (RI) with respect to D&S. Note that the a-posteriori N-best is an upper-bound for the N-best Limabeam, because it optimizes FIRs in an unsupervised manner, but chooses in a supervised manner the hypothesis which maximizes the accuracy instead of likelihood. better performance. The absence of symmetry in accuracy with respect to the center of the array (microphone 33) comes from a non-symmetric diffusion of additive and convolutional noise captured by each sensor. When applying D&S, delays are estimated via Cross-power Spectrum Phase transform (CSP) [11, 12]: its high performance (80.74%) is achieved thanks to the efficient destructive interference. Figure 5 shows the behavior of the N-best Limabeam in function of the N-best list length. The starting point of its curve corresponds to Unsupervised Limabeam, i.e. when only one hypothesis is considered. The more hypotheses are considered, the more the accuracy increases. Apparently surprising is the fact that the N-best Limabeam behaves better than the Oracle Limabeam: as stated in Section 2, an alignment which would consider all the paths may increase Oracle performance.
PSfrag replacements
this work.
85.2 85
7. References
Oracle Limabeam N-Best Limabeam a-posteriori N-Best
84.8 84.6
[1] M. Brandstein and D. Ward, Microphone arrays - signal processing techniques and applications, New York: Springer-Verlag, 2001.
84.4 84.2
[2] Johnson D and D. Dudgeon, Array signal processing, Prentice Hall, 1993.
84 83.8
[3] L. Griffith and C. Jim, “An alternative approach to linearly constrained adaptive beamforming,” in IEEE Trans. on Antennas and Propagation, 1982, vol. AP-30, pp. 27–34.
83.6 83.4 83.2 83
0
5
10
15
20
25
30
35
40
Figure 5: Accuracies of Oracle, N-best and a-posteriori N-best Limabeam in function of the number of hypotheses in the N-best list. The curve seems to have an asymptote beyond the 34th-best hypothesis, where it reaches its maximum (83.86%). This is because minimal WER hypotheses are placed down in the N-best list and indicates that considering as much transcriptions as possible is the key to achieve the best results. At higher SNRs, this asymptote should be reached faster, i.e. by considering less hypotheses. The non-monotonic behavior, also visible in experiments reported in [8], is due to a possible inconsistency between the maximum likelihood and the minimum WER criteria, because we know that choosing the maximally likely transcription in the LLH rescoring block (see Figure 2) does not imply a minimum WER choice. This is not the case when observing the behavior of the a-posteriori N-best Limabeam, where the curve is strictly monotonic. This happens because considering more hypotheses necessarily increases the probability of picking up the right one when a WER-based criterion is adopted. Of course we generally never now the correct phrase. Absolute and relative improvements are reported in Table 2: the use of Limabeam is clearly justified and in this environment the Unsupervised is close to the Oracle. As we can see in Figure 5, a N-best approach goes beyond the Oracle, providing a 16% relative over D&S when 40 hypotheses are considered in parallel. With this setup the a-posteriori N-best Limabeam has a 22.8% RI, hinting that these performance are at the reach of an algorithm which uses a criterion possibly different from the likelihood in the rescoring block. One way to do that could be weighting more the hypotheses whose likelihood increases more (during optimization). This solution is currently under study. Furthermore, the environment considered in this work is affected by a diffuse noise field, in which an adaptive beamformer should generally gain less on D&S than in other environments, where noises are more directive. This encourages us in exploring new kinds of noise and in testing performance in reverberant environments, i.e. getting closer to the conditions of a typical meeting room.
6. Acknowledgments Data collection was partially supported by the research project IST EU FP6 HIWIRE. L. Brayda would like to thank the MESR (Minist`ere de l’Enseignement Sup´erieur et de la Recherche France) and Istituto Trentino di Cultura for having supported
[4] O. Frost, “An algorithm for linearly constrained adaptive array processing,” in Proceedings of the IEEE, 1972, vol. 60, pp. 926–935. [5] Seltzer M., Microphone array processing for robust speech recognition, Ph.D. thesis, Carnegie Mellon University, Pittsburgh, PA, USA, 2003. [6] Seltzer M. and Raj B., “Speech recognizer-based filter optimization for microphone array processing,” in IEEE Signal Processing Letters, March 2003, vol. 10, no, 3, pp. 69–71. [7] Seltzer M., Raj B., and Stern R. M., “Likelihoodmaximizing beamforming for robust hands-free speech recognition,” in IEEE Trans. on Speech and Audio Procesing, September 2004, vol. 12, no, 5, pp. 489–498. [8] Brayda L., Wellekens C., and Omologo M., “N-best parallel maximum likelihood beamformers for robust speech recognition,” in submitted to Proceedings of EUSIPCO, Florence, Italy, 2006. [9] Young S. et al, The HTK Book Version 3.0., Cambridge University, 2000. [10] Brayda L., Bertotti C., Cristoforetti L., Omologo M., and Svaizer P., “Modifications on NIST MarkIII array to improve coherence properties among input signals,” in AES, 118th Audio Engineering Society Convention, Barcelona, Spain, 2005. [11] M. Omologo and P. Svaizer, “Acoustic event localization using a cross-power spectrum phase based technique,” in Proc. IEEE Int. Conf. Acoust., Speech, Signal Processing, 1994. [12] C.H. Knapp and G.C. Carter, “The generalized correlation method for estimation of time delay,” in IEEE Transactions on Acoustics, Speech and Signal Processing, 1976, vol. 24, no, 4, pp. 320–327.