INFLUENCE OF SEAL AND LINER HYDRAULIC PROPERTIES ON THE SEEPAGE RATE FROM ANIMAL WASTE HOLDING PONDS AND LAGOONS J. S. Tyner and J. Lee
ABSTRACT. Animal waste holding ponds and lagoons are often lined with soil and may leak leachate into the underlying media. Calculating the flux of leachate through a pond liner is typically predicted by applying Darcy’s law across the liner while assuming saturated conditions. The formation of a thin sealing layer atop holding pond liners is common due to the abundance of fines and organic material within animal waste. Research has shown that these seals are credited with reducing the flux from holding ponds by one or more orders of magnitude due to the very low hydraulic conductivity of the sealing layer. Because even compacted clay liners are likely to have hydraulic conductivities much larger than the overlying seal, a unit gradient forms within the liner such that it desaturates to the point that its unsaturated hydraulic conductivity is equal to the flux, a process similar to that of water infiltrating into a crusted soil. In this study, a two−layer (liner and seal) unsaturated model is presented for describing the flux of animal waste from holding ponds. The two−layer model predicts that flux is not a function of liner thickness, and is only a weak function of liner hydraulic conductivity. Instead, flux through the liner is primarily a function of seal hydraulic conductivity, seal thickness, and depth of waste. The van Genuchten−Mualem hydraulic parameters (a and n) of the liner are found to correlate well with flux, but the saturated hydraulic conductivity of the liner is found to be a poor predictor of flux. Keywords. Animal waste, Holding pond, Hydraulic conductivity, Lagoon, Leachate, Liner, Seal.
G
iven the large quantities of nutrients, pathogens, and hormones stored within soil−lined animal waste holding ponds, it is important to safeguard the underlying media and groundwater systems from excessive leachate. Many states regulate animal waste lagoons and storage ponds by setting limits on either the maximum infiltration rate or the maximum saturated hydraulic conductivity of the media lining the pond (Parker et al., 1999). Determining if a pond liner meets either of these criteria is often based on a laboratory measurement of the saturated hydraulic conductivity (K) of a pond liner using water as the pseudo−leachate solution. A measured K value in conjunction with a simple analytic model, described fully in a subsequent section, allows prediction of the pond leakage rate. Infiltrating manure creates a physical and/or biological seal atop the natural liner (Chang et al., 1974). These seals can greatly reduce the flux from the liner by multiple orders of magnitude. DeTar (1979) found that animal waste flux increased as the dilution of waste increased, and concluded that waste concentration has more influence over flux than does K measured with water. Culley and Phillips (1982)
Article was submitted for review in January 2004; approved for publication by the Structures & Environment Division of ASAE in June 2004. The authors are John S. Tyner, ASAE Member Engineer, Assistant Professor, and Jaehoon Lee, Assistant Professor, Department of Biosystems Engineering and Environmental Science, University of Tennessee, Knoxville, Tennessee. Corresponding author: John S. Tyner, Department of Biosystems Engineering and Environmental Science, 2506 E. J. Chapman Dr., Knoxville, TN 37996; phone: 865−974−7266; fax: 865−974−4514; e−mail:
[email protected].
conducted laboratory−scale infiltration experiments on a clay, a loam, and a sand and found that the sand sealed most rapidly. All the soil types had similar fluxes after five days of infiltration. The research suggested that sealing was due to physical processes and that soil texture may have little impact on groundwater contamination beneath ponds under saturated conditions. Rowsell et al. (1985) also found that sealing was primarily due to physical means and concurred with Miller et al. (1985) that ponds will effectively self−seal even in sandy soils. Contrary to Culley and Phillips (1982), Rowsell et al. (1985) concluded that the seals develop more slowly in coarser soils. Barrington et al. (1987a) conducted a laboratory−scale study comparing infiltration rates through sand, loam, and clay, and found that the coefficient of determination (r2) between K and manure infiltration was only 0.10. Barrington et al. (1987b) concluded that the primary sealing mechanism is physical, but that biological sealing may be important, particularly with swine manure since this waste creates a weaker physical seal. Barrington et al. (1990) compared the flux of liquid manure through geotextiles with equivalent pore sizes of 20, 30, and 40 µm, and found that the 20 µm fabric had a higher flux. They proposed that the larger−pored fabric developed a more compact and less permeable manure mat. Barrington and Madramootoo (1989) conducted a study to independently measure the K of the seal and the underlying soil using soil columns with piezometers placed at locations just above and below the manure−seal interface. Additional piezometers were placed at multiple depths beneath the seal. They found that sand columns often had negative pressure just beneath the seal, and the underlying soil was always unsaturated. Maulé et al. (2000) conducted a similar study
Transactions of the ASAE Vol. 47(5): 1739−1745
E 2004 American Society of Agricultural Engineers ISSN 0001−2351
1739
using seven soils with sand percentages ranging from 20% to 70%. After adding manure to the columns, the soil beneath the seal desaturated. They also found that removal of the sealing layer increased the flux to the pre−sealed values. These studies demonstrated the effect of a seal with very low K overlying media with a much larger K; the underlying media desaturates, so the saturated hydraulic conductivity of the underlying media may not correlate well to the actual flux through the columns. Both of the previously described studies allowed the exfiltrate to drip from the bottom of the columns, which induced a near−saturated lower boundary condition. If a unit−gradient lower boundary condition had been imposed on the columns, which would better replicate field conditions, even more pronounced desaturation of the columns would be expected. Miller et al. (1985) installed a neutron access tube beneath a holding pond constructed within coarse sand deposits. Volumetric water content (θ) was measured to a depth of 1.6 m prior to filling the pond with manure, and periodically thereafter. At a depth of 0.1 m below the pond bottom, θ reduced from 0.46 before filling to 0.22 after five months had elapsed. At depths from 0.25 to 1.6 m, the water content profile had stabilized at θ ≅ 0.09 . The constant θ with depth was indicative of a unit gradient, implying that the flux was equal to the unsaturated hydraulic conductivity of the sand. These authors roughly estimated that the unsaturated hydraulic conductivity, K(ψ), of the sand was less than 10−7 cm s−1, assuming a saturated K of 4 × 10⁻² cm s−1. Because the literature clearly demonstrates that holding ponds exhibit two layers, a very low conductivity seal overlying the primary lining media, we propose an alternative two−layer semi−analytic model to describe the infiltration of animal waste into holding pond liners. In doing so, we will explore the dependence of infiltration rate on various seal and soil hydrologic parameters.
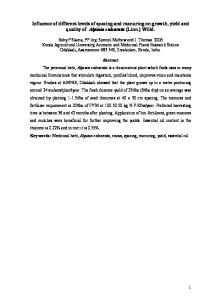
THEORY ONE−LAYER ANALYTIC SOLUTION Appendix 10D of the Agricultural Waste Management Field Handbook (USDA, 1997) provides guidance for the design of new animal waste holding ponds and for the calculation of flux from a pond. The upper boundary condition (h1) of the liner is set equal to the depth of animal waste (LW) plus the thickness of the liner (LL ) (fig. 1). The lower boundary condition (h2) of the liner is set equal to zero, which inherently assumes saturated conditions within and directly beneath the liner. Using these boundary conditions in conjunction with Darcy’s law, equation 1 describes the one−dimensional vertical flux through the liner, asserting that the flux (q) is linearly related to the saturated hydraulic conductivity of the liner (KL ). When designing for the maximum flux
when the pond is full, LW >> LL , so q is also approximately linearly related to LL . Therefore, equation 1 predicts that reducing flux should be achievable, with near−equal efficacy, by decreasing KL , decreasing LW, or increasing LL : q = KL
h1 = LW + LL h2 = 0
LL
waste liner
Figure 1. Holding pond modeled as a steady−state one−layer system.
1740
(1)
Appendix 10D also suggests that it is reasonable to assume that the conductivity of the liner, and hence flux, will decrease by an order of magnitude due to sealing of the liner by animal waste. However, the presence of a low−conductivity sealing layer atop a liner is inconsistent with the lower boundary condition (h2) assumed during the derivation of equation 1. Specifically, a low−conductivity seal atop a liner results in the partial desaturation of the liner. Only if the water table exists directly beneath the liner would the boundary conditions applied to derive equation 1 be appropriate. Applying a one−layer model to predict flux may lead to a conservative estimate that is a practical solution for the difficult task of predicting flux, but it does not necessarily reflect which variables are responsible for controlling flux. TWO−LAYER ANALYTIC SOLUTION Alternatively, a liner and seal can be modeled as a two−layer system (fig. 2). The infiltration of animal waste through a seal with small saturated hydraulic conductivity (KS ) into a liner with a relatively large saturated hydraulic conductivity (KL ) is similar to the infiltration of water into a crusted soil (Culley and Phillips, 1989). Hillel and Gardner (1968) provide an analytic solution for the equation describing infiltration of ponded water into a crusted soil. Following their derivation, the flux through the seal and the liner at steady state must be equal, and can be described by: dh dh q = K s = K L (ψ ) dz S dz L
(2)
where ψ is the matric potential. If KS < KL and the water table is well below the liner, then a unit gradient is approached dh within the liner, = 1, since gravity is the only driving dz L force at steady state. This results in an unsaturated liner where:
dh q = K S = K L (ψ) dz S
(3)
If the tension within the liner (ψ) is not sufficient to appreciably desaturate the overlying seal, then Darcy’s law can be applied across the seal to obtain:
LW h = LW + LS + LL
LW
LW + LL LL
h = LL + y h =y
LS LL
ÓÓÓÓÓÓ ÓÓÓÓÓÓ
Waste Seal, KS Liner, KL(y)
Figure 2. Holding pond modeled as a steady−state two−layer system (ψ is the matric potential and KL (ψ) is the unsaturated hydraulic conductivity of the liner).
TRANSACTIONS OF THE ASAE
Soil Type Clay loam Silty clay loam Silty clay Loam Sandy clay loam Silt loam Sandy clay Clay Sandy loam Silt
Sand (%) 29.8 7.6 6.1 40.0 54.3 16.6 47.5 14.9 63.4 5.8
q = Ks
Table 1. Properties and model parameters for soils used in this study. Clay (%) MBD (g cm−3) KL (cm s−1) α (cm−1) −5 32.6 1.66 3.30 × 10 0.0130 33.2 1.62 3.44 × 10⁻⁵ 0.0086 −5 46.3 1.52 4.81 × 10 0.0123 −5 19.7 1.71 5.13 × 10 0.0157 27.4 1.75 5.31 × 10⁻⁵ 0.0279 18.5 1.66 6.86 × 10⁻⁵ 0.0070 41.0 1.66 7.86 × 10⁻⁵ 0.0259 55.2 1.43 1.11 × 10⁻⁴ 0.0168 −4 11.1 1.79 1.42 × 10 0.0462 9.5 1.63 1.57 × 10⁻⁴ 0.0075
LW + LS + ψ LS
(4)
Equating equations 3 and 4, along with the substitution of the van Genuchten−Mualem (van Genuchten, 1980) description for KL (ψ) for the right hand term of equation 3, leads to: ( L + LS + ψ ) q = KS W LS (n −1) 1+ (αψ)( n ) 1 − (αψ)
[
= KL
]
1 − 1 n
1 1 − (n ) 2 2 n 1+ (αψ )
[
2
(5)
]
where α and n are fitting parameters related to the water retention and unsaturated hydraulic conductivity functions of the liner. This solution, like equation 1, assumes vertical, non−preferential flow. Applying equation 5 to calculate flux from holding ponds requires a priori knowledge of KS , KL , LS , LW, α, and n. The value of ψ is calculated from the two rightmost terms using an iterative approach, and then the central term is computed to determine the flux. This solution predicts no relationship between flux and LL ; note that LL is absent from equation 5. Additionally, application of this solution reveals that the dependence of flux on KL , α, and n is relatively small over a wide range of conditions.
METHODS The two−layer semi−analytic solution was conducted by solving equation 5 for q with custom code written for Matlab version 6.5. To generalize the myriad of results possible from six input variables, the output was normalized where possible. Flux (q) was normalized to q* (unitless), where K ( L + LS ) q* = S W , which is equivalent to the normalization q LS of Darcy’s law applied over the seal only, assuming zero water potential at the base of the seal. Any deviation of q* from unity represents the effects that the liner and modified boundary condition (h2) have on the flux. Saturated hydraulic conductivities were normalized to K* (unitless), where K* = KL / KS . This normalization is useful since q* is dependent on K*, not the specific values of KL and KS . The soil parameters presented in table 1 were used to describe the simulated soils modeled within this study. Typical maximum bulk density (MBD) was estimated from soil texture following the method of Wagner et al. (1994). Typical values for KL , α, and n were estimated from soil texture and MBD using the computer code ROSETTA, a pedotransfer−function based model (Schaap et al., 2001).
Vol. 47(5): 1739−1745
n (−) 1.35 1.46 1.36 1.35 1.21 1.54 1.19 1.29 1.28 1.57
RESULTS The impact of seal properties (KS and LS ) on q* was explored by solving equation 5 with LS = 4 cm and LW = 275 cm for four soil types (silt loam, silty clay loam, clay, and sandy clay). Soil hydraulic properties for each soil type are described in table 1. The lines within figure 3 represent the estimates calculated with equation 5 for each soil type. For clarity, only four of the ten soils from table 1 are plotted in figure 3. The squares, circles, and triangles on each line correspond to the locations where KS is 10−7 , 10−8 , or 10−9 cm s−1 , respectively. When K* is less than approximately 102 , there is minimal variation in q*. With a large K* of 105 , q* has a value of 0.375 for the most responsive soil (silt loam). Although this reduction is significant, it does not approach the linear dependence of q on KL predicted by equation 1. Since LS and LW are fixed, we can conclude from equation 5 that ψ does not vary greatly until K* becomes quite large. Figure 4 shows the variation in q* as a function of LS for the clay soil type from table 1. Again, when K* is less than 102 to 103, there is little change in q* for any of the lengths investigated (1, 4, and 10 cm). As the thickness of the seal increases, so does the sensitivity of q* to K*. The response is most pronounced with the 10 cm seal, where q* approaches 0.49 at a K* of 105. Next, the effect of varying liner properties (α, n, and KL ) was explored. Since α, n, and KL are correlated based on soil type, it is not justifiable to simply vary each term independently to determine their contribution to q*. Rather, the soil hydraulic properties from table 1 were used to calculate q* for each of the ten soil types in table 1. For each case, LS and LW were set to 4 cm and 275 cm, respectively. KS was set at 10−7, 10−8, or 10−9 cm s−1. The results of calculations as a function of α are presented in figure 5. A best−fit line with −1
c the form q* = b + 2 , where b and c are fitting α parameters, was found to closely predict q* based on α, with r2 ranging from 0.80 to 0.91. As α drops below 0.02 cm−1, q* drops notably. This effect can be explained by recognizing that α is related to the inverse of the air entry pressure. A small α requires a large ψ to meet the conditions specified by equation 3, and therefore increases the gradient within the seal (eq. 4). As in figure 4, results from a small KS resulted in a smaller q*. The variability of q* caused by changes in n is shown in figure 6. A linear function was fit through the data corresponding to each value of KS , resulting in r2 values ranging from 0.84 to 0.93. The lowest value of q* is 0.36, which occurs with KS = 10−9cm s−1.
1741
1.0
0.8
0.6
q*
Sandy Clay Clay Silty Clay Loam Silt Loam KS = 10−7 cm s−1
0.4
KS = 10−8 cm s−1 KS = 10−9 cm s−1 0.2
0.0 101
102
103
104
105
K* Figure 3. Normalized flux (q*) versus normalized conductivity (K*) predictions from four sets of soil properties in table 1. Squares, circles, and triangles on each line correspond to the locations where KS is 10−7, 10−8, or 10−9 cm s−1, respectively. 1.0
0.8 LS = 10 cm LS = 4 cm LS = 1 cm
q*
0.6
0.4
0.2
0.0 101
102
103
104
105
K* Figure 4. Normalized flux (q*) as a function of normalized conductivity (K*) for a clay liner with LS of 1, 4, or 10 cm.
1.0
q*
0.8
0.6 −7
−1
2
−8
−1
2
−9
−1
KS = 10 cm s ; R = 0.80 KS = 10 cm s ; R = 0.91 0.4
0.00
KS = 10 cm s ; R2 = 0.89
0.01
0.02
0.03
0.04
0.05
a Figure 5. Normalized flux (q*) as a function of the van Genuchten α parameter for a variety of soil types. Dashed lines represent the 95% confidence intervals for the top and bottom curve. To improve clarity, confidence intervals for the KS = 10−8 cm s−1 case are not plotted.
1742
TRANSACTIONS OF THE ASAE
1.0
q*
0.8
0.6
KS = 10−7 cm s−1; R2 = 0.84 KS = 10−8 cm s−1; R2 = 0.93
0.4
−9
−1
2
KS = 10 cm s ; R = 0.88 1.1
1.2
1.3
1.4
1.5
1.6
n Figure 6. Normalized flux (q*) as a function of the van Genuchten n parameter for a variety of soil types. Dashed lines represent the 95% confidence intervals.
1.0
q*
0.8
0.6
KS = 10−7; R2 = 0.31 KS = 10−8; R2 = 0.15
0.4
KS = 10−9; R2 = 0.09 4.0x10⁻⁵
8.0x10⁻⁵
1.2x10⁻⁴
1.6x10⁻⁴
−1
KL [cm s ] Figure 7. Normalized conductivity (q*) as a function of KL for a variety of soil types. Dashed lines represent the 95% confidence intervals. To improve clarity, confidence intervals for the KS = 10−8 cm s−1 case are not plotted.
The relationship between KL and q* for the three values of KS is presented in figure 7. Again, a linear function is fit through the data. Values for r2 are much lower than were those for α or n, and range from 0.09 to 0.31. The relatively weak dependence of q* on KL predicted by equation 5 is in striking contrast to the linear relationship between KL and q predicted by equation 1. A summary of the relationships between α, n, and KS is presented in table 2.
Using the soil parameters from the silty clay loam (table 1) and LW = 275 cm, a three−dimensional surface plot of q* as a function of K* and LS is presented in figure 8. Although the values for LS and K* vary from 0 to 10 cm and 102 to 105, respectively, q* varies by a maximum of only 43%. The lack of sensitivity of q* to K* demonstrates that modifying the saturated hydraulic conductivity of a liner is not an efficient method of reducing flux if a low−conductivity seal is assumed to exist, which is a reasonable assumption given the literature on the subject.
Table 2. Coefficient of determination (r2) between normalized flux and van Genuchten−Mualem parameters for the ten soils in table 1. Ks = 10−7 cm s−1 Ks = 10−8 cm s−1 Ks = 10−9 cm s−1 Parameter α
Relationship
q* = b +
n KL
2 α c
−1
q* = bn + c q* = bKL + c
Vol. 47(5): 1739−1745
b 1.00
−0.62 −1190
r2
c 1.34 ×
10−5
1.74 1.00
b
0.80
1.10
0.84 0.31
−0.96 −1200
r2
c 3.42 ×
10−5
2.05 0.85
b
0.91
1.29
0.93 0.15
−1.01 −986
r2
c 6.82 ×
10−5
1.95 0.66
0.89
0.88 0.09
1743
1.0
0.9
q*
0.8
0.7
0.6
0.5 10 3
K*
10 4 10 5
10
8
6
4
2
0
L S [cm]
Figure 8. Normalized flux (q*) as a function of normalized conductivity (K*) and LS .
DISCUSSION AND CONCLUSIONS
REFERENCES
Current guidance for designing holding pond liners provides a conservative approach to estimate leachate flux. However, the concurrent assumptions that flux is almost linearly related to liner thickness and that a seal will reduce flux by an order of magnitude are incompatible. The presence of a seal significantly alters the lower boundary condition such that flux is not related to liner thickness and is only marginally dependent on KL . The two−layer model presented in this study is of limited use to provide deterministic predictions of flux, primarily due to its strong dependence on KS , and therefore cannot supplant the guidance from Appendix 10D of the Agricultural Waste Management Field Handbook. The merit of the two−layer model is that it describes which parameters are responsible for controlling the flux from an established holding pond, namely KS , LS , and LW. The van Genuchten parameters α and n predicted 80% to 93% of the variation in q*, and KL predicted 9% to 31% of the variation in q*. Relying on the presence of a seal to limit flux may not be warranted since it is not present initially, and may sustain damage if the liquid manure is mixed and/or pumped down. That said, it might be reasonable to select liner materials based not only on KL (to limit flux during worst−case conditions), but also on the ability of the liner material to resist cracking or erosion, since these events can produce non−Darcian flow, making seal formation difficult. The risks of excessive flux prior to seal formation and after seal disturbance must be balanced against the risk of a low−KL liner to crack or erode. Future laboratory and field research that can identify the dependence of KS and LS to factors such as KL , liner clay content, and waste type is necessary to deterministically employ a two−layer model.
Barrington, S. F., and C. A. Madramootoo. 1989. Investigating seal formation from manure infiltration into soils. Trans. ASAE 32(3): 851−856. Barrington, S. F., P. J. Jutras, and R. S. Broughton. 1987a. The sealing of soils by manure: I. Preliminary investigations. Canadian Agric. Eng. 29(2): 99−103. Barrington, S. F., P. J. Jutras, and R. S. Broughton. 1987b. The sealing of soils by manure: II. Sealing mechanisms. Canadian Agric. Eng. 29(2): 105−108. Barrington, S. F., S. O. Prasher, and R. J. Raimondo. 1990. Geotextiles as sealing liners for earthen manure reservoirs: part 1, geotextile porosity. J. Agric. Eng. Res. 46(1): 93−103. Chang, A. C., W. R. Olmstead, J. B. Johansos, and G. Yamashita. 1974. Sealing mechanism of wastewater ponds. J. Water Pollution Control Federation 46(7): 1715−1721. Culley, J. L. B., and P. A. Phillips. 1982. Sealing of soils by liquid cattle manure. Canadian Agric. Eng. 24(2): 87−89. Culley, J. L. B., and P. A. Phillips. 1989. Retention and loss of nitrogen and solids from unlined earthen manure storages. Trans. ASAE 32(2): 677−683. DeTar, W. R. 1979. Infiltration of liquid dairy manure. Trans. ASAE 22(3): 521−528. Hillel, D., and W. R. Gardner. 1968. Steady infiltration into crust−topped profiles. Soil Science 108(2): 137−142. Maulé, C. P., T. A. Fonstad, S. K. Vanapalli, and G. Majumdar. 2000. Hydraulic conductivity reduction due to ponded hog manure. Canadian Agric. Eng. 42(4): 157−163. Miller, M. H., J. B. Robinson, and R. W. Gillham. 1985. Self−sealing of earthen liquid manure storage ponds: 1. A case study. J. Environ. Quality 14(4): 533−538. Parker, D. B., D. D. Schulte, D. E. Eisenhauer. 1999. Seepage from earthen animal waste ponds and lagoons − An overview of research results and state regulations. Trans. ASAE 42(2): 485−493. Rowsell, J. G., M. H. Miller, and P. H. Groenevely. 1985. Self−sealing of earthen liquid manure storage ponds: II. Rate and mechanism of sealing. J. Environ. Qual. 14(4): 539−543.
1744
TRANSACTIONS OF THE ASAE
Schaap, M. G., F. J. Leij, and M. T. van Genuchten. 2001. ROSETTA: A computer program for estimating soil hydraulic parameters with hierarchical pedotransfer functions. J. Hydrology 251(3−4): 163−176. USDA. 1997. Agricultural Waste Management Field Handbook, Chapter 10, Appendix 10D: Geotechnical design and construction guidelines. Washington, D.C.: GPO.
Vol. 47(5): 1739−1745
Wagner, L. E., N. M. Ambe, and D. Ding. 1994. Estimating a proctor density curve from intrinsic soil properties. Trans. ASAE 37(4): 1121−1125. van Genuchten, M. T. 1980. A closed−form equation for predicting the hydraulic conductivity of unsaturated soils. SSSA J. 44(5): 892−898.
1745
1746
TRANSACTIONS OF THE ASAE