INTEGRATIVE USE OF SAR AND OPTICAL DATA FOR FOREST MAPPING IN THE CONGO BASIN Manuela Hirschmugl1, Roland Perko1, Claudia Hörmann2, Ursula Schmitt1, Mathias Schardt1 1. Joanneum Research, Austria,
[email protected] 2. Technical University of Graz, Austria KEY WORDS: Forest monitoring, Forest mapping, REDD, SAR and optical data integration
ABSTRACT This study presents an innovative processing chain and various test results for using both SAR (PALSAR) and optical (such as AVNIR, LANDSAT) data in an integrative way for forest mapping in the Congo Basin. Three activities are described in this context: (i) geometric adjustment of SAR and optical data by automatic image matching; (ii) analysis of various pre-processing steps for SAR data and (iii) a method for efficiently classify SAR data based on an existing optical classification. In part one, the robust and fully automatic matching procedure based on the mutual information maximization principle has proven to be useful to ensure geometrical congruence between optical and SAR data sets. Results show that the RMSE is reduced from over 80 m to less than 10 m without manual interaction. The second analysis covers the wide variety of SAR pre-processing methods and options. From over hundred different options, the best processing steps are selected by using crosscorrelation analysis and in addition considering the typical MMU needed for forest monitoring in the tropics. The third development concerns the so-called classification-based trainer. This method allows filling classification gaps caused by clouds or sensor failures in optical data by using SAR data without much manual effort. A first benchmarking test involving AVNIR and PALSAR shows a slight overestimation of 0.8 % of non-forest area for the resulting classification compared to the classification on optical data only. Considering the difference in data quality and properties between optical and SAR data, this is a very promising result.
INTRODUCTION This study presents an innovative processing chain and various test results for using both SAR (PALSAR) and optical (such as AVNIR, LANDSAT) data in an integrative way for forest mapping in the Congo Basin. The main reason for including SAR data in the processing chain is that even with several optical sensors available, there are often still gaps in the coverage of interpretable data for application in tropical areas, as cloud cover is usually high. SAR, as an active sensor capable of allweather and day-and-night image acquisition, is thus a valuable source of information to fill these gaps. In the current study, L-band SAR data from ALOS PALSAR sensor has been used. Three activities are described in this context: (i) geometric adjustment of SAR and optical data by automatic image matching; (ii) analysis of various pre-processing steps for SAR data and (iii) a method for efficiently classify SAR data based on an existing optical classification. The developments and tests have been performed in the Congo basin in tropical Africa, namely in Cameroon and in the Republic of Congo.
STATE OF THE ART In terms of geometric adjustment between SAR and optical data standard similarity measures like absolute difference, squared difference, normalized cross-correlation, Birchfield-Tomasi dissimilarity
measure or rank and census transform are not suitable as they rely on a linear dependency of the data. Since there exists no linear dependency of an optical and a SAR image in terms of their pixel values, a more sophisticated measure has to be used, namely the mutual-information (MI) maximization principle (Pluim, 2003). In remote sensing MI can outperform other measures as e.g. shown in (Inglada, 2004; Perko, 2011) and is therefore exploited in this work. In the context of efficient pre-processing of SAR data, a wide variety of literature is available. For speckle reduction both multi-looking and data filtering methods are used. Relatively often both methods are combined. For multi-looking mostly output resolutions of 20m to 50m were used in the studies (Lönnqvist, 2007; Almeida-Filho, 2009; Rakwatin, 2009; Santoro, 2009; Sim, 2009; Thiel, 2009). Concerning data filtering, there is no tendency to use a special filter, but in most cases a speckle-specific filter with a window size between 3x3 and 7x7 was used (Lönnqvist, 2007; Rahman, 2008; Almeida-Filho, 2009; Dutra, 2009). The most common filters for SAR data are the Lee filter (Lee, 1980); the Refined Lee filter (Lee, 1981); the Frost filter (Frost, 1982); the Modified/Enhanced Frost filter (Lopes, 1990); the Kuan filter (Kuan, 1987); the GammaMAP filter (Lopes, 1990) and the Multiresolution filter (Aiazzi, 1998). Radiometric correction is almost always performed by converting data into the normalized radar cross section (σ0) (Almeida-Filho, 2009; Rakwatin, 2009; Sim, 2009; Thiel, 2009). Concerning the polarizations used in the studies different possibilities were tested. (Almeida-Filho, 2009; Dutra, 2009; Sim, 2009) analyse the use of only HH polarization, only HV polarization and a combination of HH and HV. Generally, the combination of HH and HV achieved higher accuracies than employing only one band. (Lönnqvist, 2007) compare the use of four different bands (HH, HV, VV, HH+VV and HH-VV) with using only HH and HV. The results showed no major difference: the former obtained an accuracy of 80.0%, the latter of 79.4%. Several studies show that the highest degree of information can be obtained from the combination of HH and HV.
DATA The following data sets were used: LANDSAT, ALOS PALSAR and ALOS AVNIR. The scenes, parameters and acquisition dates are summarized in Table 1. The test area is located in the border region of Cameroon, the Republic of Congo and the Central African Republic. Based on the literature review and also own signature analysis, Fine Beam Dual Polarization (FBD: HH, HV) data was used, as it shows the best compromise between coverage and classification accuracy. Table 1. Overview of used data sets. Sensor
Polarization
Off-nadir angle
Acquisition date
ALOS PALSAR
FBD
34.3
21.05.2008
ALOS AVNIR
-
-
10.04.2008
LANDSAT ETM+
-
-
13.02.2008
METHODS In order to use both optical and SAR data in an integrative way, the data sets have first to be geometrically congruent to avoid errors in the output. Due to the different sensor geometry, such congruence is not easily achieved. Typically, tie points are visually selected in the two images, which is a difficult and time-consuming task, especially in areas with large homogeneous forest cover as it is the case in the Congo basin. In order to reduce this manual effort, an automatic, robust and reliable image matching method is needed to find corresponding points. A multi-modal matching technique 2 (Style: Footer)
was developed, which relates different visible spectra, but also e.g. NIR and thermal imaging, to SAR data. Appropriate pre-processing of the data is necessary on the one hand, and SAR specific imaging effects have to be taken into account on the other. The developed fully automatic image matching procedure (Perko, 2011) using the mutual information method leads to improved geometric congruence between optical and SAR data, which in result allows easier and more accurate gap filling with SAR data. The specific matching strategy proposed for this project starts with a pre-processing step that downscales the higher resolution SAR data to the resolution of the available optical data. In the case of ALOS PALSAR and LANDSAT images it is sufficient to apply an average filter (i.e. an appropriate multi-looking) that reduces speckle information in the SAR data and simultaneously avoids aliasing artefacts. Next, the histograms of the filtered images are compressed using a quantile processing. A lower and upper threshold representing a given quantile of the data distribution (e.g. 1% and 99%) are calculated and used to compress the histogram to a given number of values. This technique helps the following up matching procedure as the joint histograms are then better populated and thus a larger number of correct matches are found. A compression to 64 bins yields best results. The areal matching paradigm is based on mutual-information (MI) maximization. The main idea is that the joint entropy of two image patches is minimized, when the patches are correctly aligned. Therefore, a maximization of the MI measure corresponds to a maximization of clusters in the joint entropy and to a minimization of the joint entropy’s dispersion. To get normalized similarity measurements the entropy correlation coefficient (ECC) is used, which maps the normalized mutualinformation to the domain [0,1], ( , )=2−
2 ( , ) ( )+ ( )
,
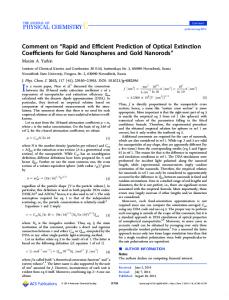
with H(X) and H(Y) being the individual entropies and H(X,Y) the joint entropy of image patches X and Y. In contradiction to e.g. the normalized cross-correlation (NCC) method, which is just invariant to linear mappings between the values of the images to be matched, the MI method can also handle non-linear dependencies. Since the values of optical and SAR images have non-linear dependencies the MI method is able to find correct matches even in cases where NCC fails. In our tests best results are achieved with 151x151 pixel windows for MI calculation (such large windows can be successfully employed since the input images are ortho-rectified). A subpixel measurement is achieved by fitting a polynomial using the 3x3 neighborhood of the entropy’s correlation peak and analytical calculation of its maxima. Since, a rigid transformation between the two datasets is assumed, it is sufficient to match points on a regular grid (dense image matching would be an overkill for this application). The shift vectors between an ALOS PALSAR scene and a LANDSAT scene are shown in Figure 1. Using these vectors, a rigid transformation (a translation in the shown case) is estimated by solving an over-determined equation system in the least-squares sense. The parameters of the estimated transformation are then used to register the SAR data to the reference optical data.
3 (Style: Footer)
Figure 1. Input data for the matching: (left) LANDSAT scene and (right) ALOS PALSAR scene. The automatically extracted shift vectors are superimposed on the PALSAR data. The second step after geometric congruence is achieved is the pre-processing of the SAR data. Several pre-processing steps have been tested and compared. These steps include: (i) the use of decibel versus digital number; (ii) the use of different multi-looking resolutions and (iii) the use of different speckle filters and filter sizes. For testing the usability of the various pre-processing methods, six land cover classes were defined: water, settlement, agricultural land, non-vegetated soil, forest and swamp. These land cover classes are very similar to the IPCC (Intergovernmental Panel on Climate Change) land cover classes as needed in the frame of REDD (water, settlement, agricultural land, forest, wetland and other land). Other land is a class too diverse to be used for the assessment of quality of the pre-processing steps and was therefore replaced by bare, non-vegetated soil, which is clearly visible in the reference data and cannot be clearly put to any other class, as it could be part of the agricultural land as well as part of the settlement class. The quality of the results is validated by using a predefined set of training areas and a cross-validation procedure using Maximum Likelihood classification. The cross-validation procedure subdivides the overall training data-set into "n" (user-defined) subsets. Then the classifier is trained with n-1 subsets and is then validated with the remaining subset. This procedure is performed until each subset has served once as validation set. The result of the cross-validation is an error matrix for each iteration and one for the average performance of the classifier. This average performance also serves as an indicator for the suitability of the pre-processing methods, given that all other parameters (classifier, training data, number of subsets, etc.) remain unchanged. During the cross-validation both the overall accuracy (i.e. the sum of correctly classified pixels of the 6 classes, divided by the total number of pixels) and the mean accuracy (i.e. the sum of the accuracies (given in percentage) of correctly classified pixels of the 6 classes is averaged) were calculated. When considering the results of overall accuracy and mean accuracy it has been found that the high proportion of forest in this area has a great influence on the overall accuracy and that other classes with less extension are poorly represented in the evaluation. Therefore, the mean accuracy was used for the detailed analyses of pre-processing methods. It has to be noted, that the cross-validation values do not reliably represent overall classification accuracy, but they are only used as a relative measure of comparing different pre-processing methods and steps. In a final step, a fully automated tool for classifying the pre-processed PALSAR data is presented. With the use of a so-called classification-based trainer, the optical image is used to train the SAR image for filling the gaps. The method proposed consists of the following steps: (0) Detect and mask out clouds and cloud shadows (not described here, e. g. Hirschmugl, 2008). (1) Resample the classification result gathered from the optical images and the SAR data to the same resolution, 4 (Style: Footer)
preferably to the higher resolution (smaller pixel size). (2) Erode the all valid (not gap) areas by a sufficiently large number of pixels. The number of pixels depends on (i) the quality of the cloud/cloud shadow masks; (ii) the atmospheric disturbance around the clouds and (iii) the geometric resolution of the image. In the test case, we used 10 pixels (with a GSD of 10 m), i.e. a 100 m buffer around the gaps. This step would not be necessary if the gaps are sensor specific and the surrounding areas are not affected in any way. (3) Multiply the valid mask with the classification result of the optical image. (4) Erode each class by a small number of pixels. This step is necessary to avoid having mixed pixels used for training. Using more pixels in the erosion process results in less mixed pixels, however, there is a limit, especially if there is a class consisting of small and/or elongated shapes such as settlements and roads in the tropical forest environment. Using too many pixels would reduce the amount of pixels available for training to an under-representative level or even to zero. Thus we used only 1 pixel in the test case. (5) Select and train the classifier for SAR images using the output of step 4. (6) Classify the SAR image.
RESULTS First matching tests were performed between PALSAR and LANDSAT data. The LANDSAT multispectral image was geocoded with a GSD of 30 meters and defines the reference geometry. The matching strategy uses only one image band, where the fourth LANDSAT band was taken. The PALSAR image was ortho-rectified as well and then appropriately down-sampled to achieve a GSD of 30 meters. Then points on a regular grid with a step size of 100 pixels in both image dimensions were matched yielding about 400 tie-points. Those tie-points were then used to calculate the shift between the two images, before and after parameter adjustment. Table 2 gives the according RMS and mean values in East and North respectively. It can be seen that the initial RMS error of about 85 m and 97 m drops to 10 m and 9 m. The final accuracy corresponds to one third of a LANDSAT pixel, therefore being well in the sub-pixel domain. In Figure 2 a detailed view of a region containing a river is visualized before and after the proposed registration. It is clearly visible that the geometric correspondence is significantly increased in a fully automatic manner. It is also important to note, that even though the images are radiometrically very different, about 82% of the tentatively matched points are compatible with the estimated translation. This is a very good result, especially since forested regions in the PALSAR data visually correspond more or less to pure noise.
Table 2. Statistics of the registration accuracy of PALSAR to LANDSAT given in meters for East and North coordinates before and after adjustment. Initial (419 points) [m] RMS
85.1
97.0
Mean
-79.5
-96.4
Adjusted (344 points) [m] RMS
9.8
9.2
Mean
0.0
0.0
5 (Style: Footer)
Figure 2. LANDSAT vs. PALSAR: left before registration; right: after registration From the comprehensive testing of pre-processing steps involving altogether more than hundred different options as combinations from three different resolutions, each in decibel (DB) and digital numbers (DN), tested for seven different filters and three different window sizes. The optimal unit in terms of DB vs. DN was found to be DN, although not by a large margin. In terms of multi-looking resolution and speckle filter, the best result (92.41% cross-validation mean accuracy) was achieved for 45 m and a multi-resolution speckle filter (see Table 3). However, considering the MMU needed for many REDD applications, an image with higher resolution would be needed. For 15m, the multiresolution speckle filter yields the highest accuracy. Frost 7x7 yields the highest accuracy for 30m classification. However, as this filter is not robust for higher resolutions, the multi-resolution filter is to be preferred. Table 3. Results of pre-processing evalution for FBD data. Test-No.
Cross-validation (mean accuracy in %)
Pre-processing option 15m
30m
45m
1
Frost (3x3)
63.37
80.21
86.74
2
Frost (5x5)
66.95
87.27
73.76
3
Frost (7x7)
66.68
88.87
92.22
4
Modified Frost (3x3)
63.05
73.51
71.45
5
Modified Frost (5x5)
66.36
83.62
85.22
6
Modified Frost (7x7)
80.55
84.48
76.00
7
Multiresolution
85.94
86.11
92.41
8
GammaMAP (3x3)
60.34
57.44
68.23
9
GammaMAP (5x5)
58.15
63.72
73.55
10
GammaMAP (7x7)
59.60
61.74
77.44
11
Kuan (3x3)
65.06
63.91
69.35
12
Kuan (5x5)
60.61
59.78
64.85
13
Kuan (7x7)
60.12
48.77
66.12
14
Lee (3x3)
52.53
61.43
65.43
15
Lee (5x5)
58.87
63.30
68.21
16
Lee (7x7)
64.13
65.87
67.63
17
Refined Lee
52.50
59.52
63.57
18
unfiltered
51.25
60.44
62.74
6 (Style: Footer)
For the application of the classification-based trainer, the FBD PALSAR data has been preprocessed as explained above with multi-resolution filter resampled to 30 m in DN. In order to avoid resampling effects, an even number was chosen for the pixel spacing (30 m compared to 10 m AVNIR). The image depicted in Figure 3 (b) is an RGB composite of the following polarizations: R = HH, G = HV, B = HH-HV. The result of the gap filling is shown in Figure 3 (e): purple = forest; blue = non-forest. The main features are well represented, while small forest and non-forest patches as visible in the AVNIR classification (Figure 3 (c)) cannot be clearly mapped with PALSAR data. The reasons are twofold: First, it is partly due to the lower resolution compared to AVNIR and second, this can partly be explained by the spectral confusion between agricultural land and forest.
(a) AVNIR scene
(b) PALSAR scene (RGB: R = HH, G = HV, B = HH-HV)
(c) Classification result AVNIR
(d) Classification result AVNIR with artificial gap
(e) Gap filled with PALSAR classification result
Figure 3. Exemplary results with artificial gap. 7 (Style: Footer)
In addition to the visual check, also the area statistics for the artificial gap have been calculated to get an estimate on the magnitude of difference. Compared to the original 35.7% non-forest in the area of the artificial gap, the PALSAR result showed 36.5%, which is a slight over-estimation.
DISCUSSION AND CONCLUSIONS This study investigates several aspects for the optimal inclusion of SAR data in a currently opticaldata dominated REDD processing chain. In terms of geometric pre-processing, the proposed method is able to adjust PALSAR data to LANDSAT reference data in a fully automated manner. Several important advantages of the proposed method should be mentioned: first, corresponding points are also found in relatively homogeneous, forested regions, where other matching techniques often fail. Second, the number of incorrect matches is rather low (see arrows pointing to a complete different direction in Figure 1) and third, the method can also correctly handle the invalid regions of the LANDSAT ETM+ image (stripes caused be the SLC failure). With regard to different polarizations of PALSAR data, the best compromise between coverage and classification accuracy was achieved using FBD data. In terms of filtering, it was found that the overall best result was achieved using DN, a multiresolution filter and a resolution of 45m. However, with respect to a usual MMU in REDD projects of 0.5 - 1 ha, a resolution of 45 m is not sufficient. Therefore, depending on the MMU, the multiresolution filter with pixel size of around 15 to 30 m can be recommended. Finally, the integration of SAR and optical data was done using a so-called classification-based trainer. Compared to the original 35.7% non-forest in the area of the artificial gap, the PALSAR result showed 36.5%, which is a slight over-estimation. Such differences can be tricky, if changes should be mapped. Thus it is advised to use a segment-based approach for the change detection. The method presented here is flexible enough to be applied also on segments instead of pixels. In conclusion, the method proved to be suitable to fill gaps in optical data with a classification result in a fully-automated way. Further improvements and tests of the classification-based trainer are foreseen: (i) the introduction of quality measures for the data to be used for training and (ii) tests on different data sets and with more land cover classes.
ACKNOWLEDGEMENTS The research leading to these results has received funding from European Union’s Seventh Framework Programme under grant agreement n°262775 (REDDAf project). Furthermore, part of these work has received funding from European Space Agency under the project ‘GMES Service Elements for Forest Monitoring – Extensions for REDD’.
REFERENCES Aiazzi, B., Alparone, L. and Baronti, S., 1998. Multiresolution local-statistics speckle filtering based on a ratio Laplacian pyramid. IEEE Transactions on Geoscience and Remote Sensing, 36, pp. 1466 -1476. Almeida-Filho, R., Shimbukuro, Y.E., Rosenqvist, A. and Sanchez, G.A., 2009. Using dual-polarized ALOS PALSAR data for detecting new fronts of deforestation in the Brazilian Amazon. International Journal of Remote Sensing, 30, pp. 3735-3743. Dutra, L.V., Scofield, G.B., Neta, S.R.A., Negri, R.G., Da Costa Freitas, C. and Andrade, D., 2009. Land Cover Classification in Amazon using ALOS PALSAR Full Polarimetric Data. Anais XIV Simpósio Brasileiro de Sensoriamento Remoto, Brazil. 8 (Style: Footer)
Frost, V. S., Stiles, J. A.,Shanmugan, K. S., and Holtzman, J. C., 1982. A model for radar images and its application to adaptive digital filtering of multiplicative noise. IEEE Trans. Pattern Anal. Machine Intell., vol. PAMI-4, pp. 157–166, 1982. Hirschmugl, M., Maier, A., Haas, S., Siwe, R., Schardt, M., and Amougou, J.A. 2008. REDD Pilot Project in Cameroon - Monitoring Forest Cover Change with EO Data. Proceedings of AARSE 2008 International Remote Sensing Conference. Inglada, J., and A. Giros, 2004. On the possibility of automatic multisensor image registration, IEEE Transactions on Geoscience and Remote Sensing, vol 42(19), pp. 2104 – 2120. Kuan, D. T., Sawchuk, A. A., Strand, T. C. and Chavel, P., 1987. Adaptive restoration of images with speckle. IEEE Trans. Acoust., Speech, Signal Processing, vol. ASSP-35, pp. 373–383. Lee, J. S., 1980. Digital image enhancement and noise filtering by use of local statistics. IEEE Trans. Pattern Anal. Machine Intell., vol. PAMI-2, pp. 165–168. Lee, J. S., 1981. Refined filtering of image noise using local statistics. Comput. Graph. Image Process., vol. 15, pp. 380–389. Lönnqvist, A., Raust, Y., Ahola, H., Molinier, M. and Häme, T., 2007. Evaluation of classification methods with polarimetric ALOS/PALSAR data. Proceedings of the FORESTSAT conference Montpellier, France. Lopes A., Nezry, E., Touzi, R. and Laur, H., 1990. MAP speckle filtering in SAR images. IEEE International Geoscience and Remote Sensing Symposium, Washington, DC, pp. 1683–1686. Perko, R., Raggam, H., Gutjahr, K. and Schardt, M., 2011. Using worldwide available TerraSAR-X data to calibrate the geo-location accuracy of optical sensors. IEEE International Geoscience and Remote Sensing Symposium, pp. 2551-2554. Pluim, J.P.W., Maintz, J.B.A., Viergever, M.A., 2003. Mutual Information Based Registration of Medical Images: A Survey. IEEE Transactions on Medical Imaging, pp. 986-1004. Rahman, M.M. and Sumantyo, J.T.S., 2008. ALOS PALSAR data for tropical forest interpretation and mapping. Proceedings of Congress of the International Society for Photogrammetry and Remote Sensing. Rakwatin, P., Longepe, N., Isoguchi, O. and Shimada, M., 2009. Potential of ALOS PALSAR 50m mosaic product for land cover classification in tropical rain forest. Proceedings of the Asian Conference on Remote Sensing (ACRS). Santoro, M., Fransson, J., Eriksson, L., Magnusson, M., Ulander, L. and Olsson, H., 2009. Signatures of ALOS PALSAR L-Band Backscatter in Swedish Forest. IEEE Transactions on Geoscience and Remote Sensing, 47, pp. 4001-4018. Sim, C.K., Abdullah, K., Matjafri, M.Z. and Lim, H.S., 2009. Land Cover Mapping Using ALOS PALSAR Data over Penang Island, Malaysia. http://www.gisdevelopment.net/application/nrm/overview/mma09_cksim.htm (accessed 20 August 2012) Thiel, Ch., Thiel, C. and Schmullius, C., 2009. Operational large-area Forest Monitoring in Siberia using ALOS PALSAR summer intensities and winter coherence. IEEE Transactions on Geoscience and Remote Sensing, 47, pp. 3993-4000.
9 (Style: Footer)