Lidar Measurements of Atmospheric Dynamics over High Mountainous Terrain Zahary Y. Peshev, Atanaska D. Deleva, Tanja N. Dreischuh, and Dimitar V. Stoyanov Institute of Electronics, Bulgarian Academy of Sciences, 72 Tsarigradsko Chaussee Blvd., 1784 Sofia, Bulgaria Abstract. Results of lidar observations on the dynamics of atmospheric layers over the ridge and northeast slope of Vitosha Mountain situated close to Sofia, Bulgaria, are reported and compared with results for layers over surrounding plain and urban zones. Measurements are carried out at 1064 nm wavelength with a lidar range resolution of 15 m, by using one of the aerosol channels of a combined Raman-aerosol lidar based on a powerful Nd:YAG laser. Two cases of distinctly different weather conditions are studied. The mountainous area, situated from 6 km to 12 km away from the lidar station, is scanned reiteratively within 7º- 9º slope-angle range. Multiple series of lidar profiles are registered with average time of 2-5 s. Lidar signals are then range corrected and processed statistically. Normalized standard deviation is used as a characteristic of the atmospheric dynamics. The spatial-temporal evolution of atmospheric density fluctuations is shown on colormap plots. Intensive air dynamics over the mountain is revealed, exceeding considerably the one over the plain zone. Peculiarities of the dynamics in the investigated atmospheric domains are discussed. Results obtained show that Vitosha Mountain strongly affects variations of the atmospheric density and stability over large areas. Keywords: Lidar, Atmospheric dynamics, Mountainous terrain. PACS: 42.68.Wt; 42.68.Jg, 42.68.Bz
INTRODUCTION Mountains determine local climate characteristics such as atmospheric thermal budget, wind conditions, annual rainfalls, etc.[1,2]. They favor appearance of turbulent zones and strongly influence or provoke air circulations in the low atmosphere [1,3,4]. Investigations of the atmospheric dynamics over and close to mountainous areas at different time scales are important for monitoring climatic and ecological processes or changes. The significance of such observations increases if there are cities or agricultural regions situated in vicinity of the mountains, due to the strong impact of atmospheric processes on human activities and health. The atmospheric dynamics, including its orographic aspects, has been a subject of extensive lidar studies for many years, involving various approaches, experimental techniques, and theoretical models, focused on air turbulence, planetary boundary layer and cloud dynamics, formation and spreading of orographic waves, etc. [5-12]. Different characteristics of sounding laser beams and backscattered lidar signals have been studied, such as intensity fluctuations, phase changes, coherent effects, and statistical properties [13-20]. In this work, we report results of lidar measurements on the dynamics of atmospheric layers over the ridge and northeast slope of Vitosha Mountain, situated close to the city of Sofia, Bulgaria, as well as over the connecting plain and urban areas. Previously, the influence of Vitosha Mountain has been studied in the case of mountain waves passing over a fixed point, as measured by vertically oriented aerosol lidars [21,22]. Here are described scanning range-resolved lidar measurements accomplished over large area in order to follow more comprehensively the mountain-affected atmospheric behavior. Data processing is based on statistical treatment of intensity fluctuations of lidar signals. Results are presented and discussed, concerning atmospheric dynamics in two distinctly different cases of weather conditions.
CP1203, 7th International Conference of the Balkan Physical Union, edited by A. Angelopoulos and T. Fildisis © 2009 American Institute of Physics 978-0-7354-0740-4/09/$25.00
1108 Downloaded 14 Feb 2010 to 195.34.97.210. Redistribution subject to AIP license or copyright; see http://proceedings.aip.org/proceedings/cpcr.jsp
EXPERIMENTAL APPARATUS AND MEASUREMENT PROCEDURE Measurements are carried out at 1064 nm wavelength by using one of the aerosol channels of a 3-channel combined Raman-aerosol lidar developed at Laser Radars Lab of the Institute of Electronics, Bulgarian Academy of Sciences, Sofia, Bulgaria. The lidar-system transmitter is based on a powerful Q-switched Nd:YAG laser (output pulse power of up to 1J at 1064 nm, 15 ns FWHM pulse duration; 2 Hz repetition rate). The receiver’s optical part consists of a Cassegrain type telescope (35 cm aperture; 200 cm focal distance) and a 3-channel spectrum-analyzing module based on narrowband interference filters (1-3 nm FWHM). The electronic part of the lidar receiving system provides signal registration with a lidar range resolution of 15 m. It is formed by 3 compact photo-electronic modules, each comprising a photo-detector (photomultiplier or avalanche photodiode), 10 MHz 14-bit analog-todigital converter, high voltage power supply, and controlling electronics. Receiving modules are connected to a PC by high-speed USB ports. The acquisition system is equipped with specialized software for accumulation, storage, and processing of lidar data.
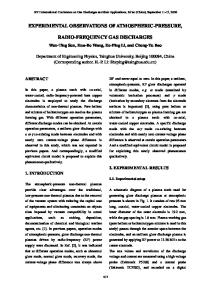
FIGURE 1. A picture-schematic of the experimental measurements. WS – the wavelength separator; A1/A2 – the aerosol channels (1064nm/532nm); R – the Raman channel (607 nm).
The experimental procedure and some measurement special features are briefly described below. Vitosha Mountain is situated south-westerly and close to the city of Sofia, Bulgaria. Figure 1 represents a picture-based schematic of the measurements with scanned mountain regions and beam traces for different slope angles. Measurements are performed at a fixed azimuth angle with slope angles changing by 0.5 º-steps from 7º to 9°. The distance from the lidar station to the mountain ridge is about 12 km, as measured at a slope angle of 8.2°. Distances to the mountain slope vary from about 9 km to 12 km for slope angles 7º-8.2°. The biggest altitude just over the ridge (at a slope angle of 9º) is 2250 m ASL corresponding to about 200 m above the ridge surface. Laser beam paths with lengths of up to about 6 km pass over urban zone and city outskirts (referred to as plain zone), whereas those in the range 6-12 km pass over mountain foot, slope, and ridge (referred to as mountain zone). The mentioned above slope angle interval is scanned reiteratively after every 20 profiles registered at a given angle. The accumulation time for single profile is fixed in the interval 2 - 5 s, depending on the conditions of measurement. When 1000 profiles are registered for each angle, the measurement is completed. The available software allows for evaluation and plotting range and height profiles of range-corrected lidar signals, aerosol backscattering coefficient, and estimation error.
RESULTS AND DISCUSSIONS Direct measurement of turbulent fields or air flows is a hard task requiring complicated data processing or specialized equipment [7,15,19]. We use an indirect approach for evaluating dynamical properties of the atmosphere over the mountain. It is based on statistical processing and analysis of lidar data. The normalized standard deviation (NSD) of range-corrected lidar signals is chosen as a criterion for characterizing atmospheric dynamics. This is because of the direct proportionality between the signal intensity variance 2 (hence, the standard deviation ) and the refractive index structure parameter Cn2, which is the quantitative measure of optical turbulence intensity [7,20]. Note that owing to the relative nature of the NSD, it is not necessary to determine range profiles of the aerosol
1109 Downloaded 14 Feb 2010 to 195.34.97.210. Redistribution subject to AIP license or copyright; see http://proceedings.aip.org/proceedings/cpcr.jsp
backscattering or extinction coefficients for each lidar signal profile, saving by this manner processing time and avoiding additional errors in calculations. Initially, collected raw data corresponding to pure-noise profile parts are statistically processed in order to calculate standard deviations and mean values of the pure noise. After noise subtraction, the pure lidar signal (i.e. the noise-free signal) is range corrected and statistically processed. Signal’s statistical parameters are determined, taking into account fluctuations of both the noise and laser output power. Finally, the pure signal standard deviation is normalized by the signal mean value for each point of range profiles. Below are presented results of our lidar measurements concerning the air dynamics and aerosol density distribution over Vitosha Mountain in two different meteorological cases. The first one is a case of predominantly sunny conditions in atmosphere with low aerosol loadings (data from 26 May 2009). The second one is a case of cloudy and rainy conditions in atmosphere rich of orographic formations – clouds and fog (data from 7 May 2009). Referring to the first case, colormap plots in space-time coordinates are presented in Figure 2, illustrating the temporal evolution of the NSD over the scanning range for 4 different slope angles of measurement. As one can see on the plots presented in Figure 2, yellow-red-colored domains of more intense fluctuations of the lidar signal are located from 6 km to 12 km, near exactly over the mountain zone, in contrast to the much less dynamic blue-green-colored domains over the plain zone. This peculiarity is more distinct at plots a) and b) corresponding to smaller slope angles ( 7.5° and 8°, respectively ) and laser beam pointed at the mountain slope. In cases c) and d) corresponding to bigger slope angles ( 8.5° and 9°, respectively ) and more elevated beam traces pointed over the mountain’s ridge, the contrast between the two zones is slightly less, indicating for a weak spreading of dynamic fields with increasing the height.
(a)
(b)
(c)
(d)
FIGURE 2. Evolution color-maps of the lidar signal NSD, corresponding to four different slope angles, for dynamical lidar measurements over Vitosha Mountain performed on 26 May, 2009.
Another feature of the results shown in Figure 2 is the relatively low value of the averaged standard deviation, determined as the mean value of all data presented at a given colormap (0.12, 0.15, 0.20, 0.23 in cases a) – d), respectively). Mean NSD values are plotted and discussed in the last section of the text.
1110 Downloaded 14 Feb 2010 to 195.34.97.210. Redistribution subject to AIP license or copyright; see http://proceedings.aip.org/proceedings/cpcr.jsp
-6
1,0 0,5 0,8
2
4
2
6
4
8
6
10
8
10
4
6
4
8
6
4
o
8.0
o
7.5
o
7.0
o
10
8
0,6 0,4 2
8.5 12
0,6 0,4 2
o
12
0,4 2
9.0
Normalized standard deviation
-1
0,5
Backscatter coeff. (x10 m sr )
1,0
-1
Range-profile multilayer plots of the time-averaged backscatter coefficients and NSD of range-corrected lidar signals are presented in Figure 3 – a) and b), respectively, for the five slope angles of measurements in the case of sunny weather.
6
8
9.0 2
4
2
6
4
2
8
6
4
10
8
12
10
6
8
8.5
o
8.0
o
12
10 7.5
2
3
4
5
6
7
8
o
9 7.0
2
3
4
5
6
o
7
8
o
9
Distance (km)
Distance (km)
(a)
0,4 0,2 0,0 0,6 0,3 0,0 0,4 0,2 0,0 0,3 0,2 0,1 0,0 0,4 1 0,2 0,0 1
(b)
FIGURE 3. Time-averaged range profiles of the backscatter coefficient – (a) and the NSD corresponding to range-corrected lidar signals – (b); Sofia, 26 May, 2009.
Characteristics of the atmospheric behavior discussed above are in good correlation with the wind conditions observed for the time of measurements on 26 May, 2009 : wind speed of 2 m/s (westerly, 270°), measured in the plain zone and 8 m/s (north-northwesterly, 340°), measured at the meteorological station situated on the mountain ridge. Results related to cloudy and rainy atmospheric conditions, as observed on 7 May 2009, are presented on Figure 4 and Figure 5. Note that plenty of orographic clouds were observed on that date over the ridge and slopes of Vitosha Mountain.
(a)
(b)
(c)
(d)
FIGURE 4.. Evolution color-maps of the lidar signal NSD corresponding to four different slope angles, for dynamical lidar measurements over Vitosha Mountain performed on 7 May, 2009.
1111 Downloaded 14 Feb 2010 to 195.34.97.210. Redistribution subject to AIP license or copyright; see http://proceedings.aip.org/proceedings/cpcr.jsp
4 2 0 41 2 0 41 2 0
Normalized standard deviation
-6
-1
-1
Backscatter coeff. (x10 m sr )
Color-maps illustrating one-hour evolution of the NSD are shown in Figure 4 for the same four slope angles as in Figure 2. Similarly, two zones can be distinguished on the plots: a highly dynamic red-yellow zone over the mountain region and a more static green-bluish one over the plain. However, there exist essential differences in the atmospheric dynamics in comparison to the previous case. First, the values of NSD over the mountain are considerably higher, tending to or close to unity. Correspondingly, dark-red domains can be seen on the plots (e.g. b) – d) cases of Figure 4). Second, the zone of increased dynamics is noticeably expanded covering the mountain’s foot and partially the plain (3 - 6 km range). Mean NSD values for the plots a) – d) are 0.26, 0.30, 0.38, 0.4, respectively, which are considerably bigger than the ones for Figure 2. More detailed data are presented in Figure 6. Range-profile multilayer plots of the time-averaged backscatter coefficients and corresponding normalized standard deviations of range-corrected data are presented in Figure 5 – a) and b), respectively, for the five slope angles of measurements in the case of rainy weather conditions. Saturated parts of the profiles on plot a) are wider due to presence of large orographic clouds. Comparing backscatter plots with NSD ones in Figure 3 and Figure 5 reveals a distinct feature of the atmospheric dynamical behavior, finding expression in the peak-to-valley correspondence. The latter is an indication that the aerosol dynamics is most intensive within or close to interface zones between aerosol fields having different densities. This observation is reasonable in view of the fact that the mentioned interface is a transient unstable zone connecting two well defined and relatively stable air masses with different densities and internal conditions.
o
9.0 2
3
4
5
6
7 8.5
2
3
4
5
6
7
o
8 8.0
1
2
4 2 0 41 2 0 1
3
4
5
6
7
8 7.5
2
3
4
5
6
7
8
3
4
5
6
7
8
o
9 7.0
2
o
o
9
1,0 0,5 0,0 1,0 0,5 0,0 1,0 0,5 0,0 1,0 0,5 0,0 1,0 0,5 0,0
9.0 2
3
4
5
6
o
7 o
8.5 2
3
4
5
6
7
8 8.0
2
3
4
5
6
7
8
o
9 o
7.5 1
2
3
4
5
6
7
8
9 7.0
2
3
Distance (km)
4
5
6
7
8
o
9
Distance (km)
(a)
(b) FIGURE 5. Time-averaged range profiles of the backscatter coefficient - a) and the NSD corresponding to range-corrected lidar signal – b); Sofia, 7 May 2009.
Similarly to the case of sunny weather, the results are consistent with the meteorological conditions observed for the time of measurements on 7 May 2009: averaged wind speed of 6 m/s (westerly, 270°), measured in the plain zone and 10 m/s (west-northwesterly, 290°), measured at the meteorological station situated on the mountain ridge. 0,8
0,8
Plain Mountain Mean NSD
0,6
Plain Mountain Mean NSD
7 May 2009 Rainy weather
Mean normalized SD
Mean normalized SD
26 May 2009 Sunny weather
0,4
0,2
0,6
0,4
0,2
0,0
0,0 7,0
7,5
8,0
8,5
7,0
9,0
Slope angle (deg)
7,5
8,0
8,5
9,0
Slope angle (deg)
(a)
(b)
FIGURE 6. Time-space-averaged normalized standard deviation of lidar signals over the plain zone (1-6 km), mountain zone (612 km), and the mean of both, as a function of lidar slope angle values, in the case of sunny weather (a) and rainy conditions (b).
In Figure 6, column plots of NSD values are shown, as averaged over the total time of measurements and over the partial distance ranges above the plain zone (1-6 km) and the mountain zone (6-12 km), respectively, in the case
1112 Downloaded 14 Feb 2010 to 195.34.97.210. Redistribution subject to AIP license or copyright; see http://proceedings.aip.org/proceedings/cpcr.jsp
of sunny weather (a) and rainy conditions (b), as a function of lidar slope angle values. Presented are also mean NSD values for the whole space and time ranges of measurement for a given slope angle. Comparing (a) and (b) cases of the Figure 6, the much stronger averaged dynamics in the case of rainy weather is clearly obvious.
CONCLUSIONS Based on obtained results of experimental lidar measurements concerning atmospheric dynamics over mountainous terrain, the following conclusions could be drawn. Air dynamics over the slope and ridge of Vitosha Mountain is distinctly more intensive in comparison with that over the adjacent plain area, in the two investigated cases of atmospheric conditions (sunny and rainy weather). Under rainy conditions, characterized by wide-spreading orographic water-aerosol fields, the atmospheric dynamics is much stronger than the one under sunny conditions poor of orographic formations, all over the observation areas. Most fluctuating are interface zones connecting air masses with different density and stability. Under sunny conditions, the zones of instabilities and stable ones are well defined and clearly separated, nearly coinciding with the mountainous and plain areas, respectively. In the case of cloudy and rainy conditions, however, the zone of instabilities and turbulences is considerably expanded, transferring the mountain-like atmospheric behavior deeply over the plain area. Summarizing, Vitosha Mountain strongly affects variations of the atmospheric density and stability over large surrounding areas. These influences are well observed and followed by the combined Raman-aerosol lidar system (operated in Laser Radars Lab at the Institute of Electronics, BAS, Sofia, Bulgaria) proving its ability to measure and analyze their range-resolved dynamical profile characteristics with very good spatial and temporal resolution at 1064 nm.
ACKNOWLEDGMENTS This work is supported by the EC FP6 EARLINET-ASOS Contract RICA-025991 and the Joint Project between the Bulgarian Academy of Sciences and National Academy of Sciences of Belarus.
REFERENCES 1. 2. 3. 4. 5. 6. 7. 8. 9. 10. 11. 12. 13. 14. 15. 16. 17. 18. 19. 20. 21. 22.
R. G. Barry, Mountain Weather and Climate, 2nd ed., New York: Routledge, 1992, pp. 67-126. R. B. Smith, Advances in Geophysics 21, Academic Press, 1979, pp. 87-230. J. C. R. Hunt, F. Tampier, W. S. Weng, and D. J. Carruther, J. Fluid Mech. 227, 667-688 (1991). D.M. Farmer and L. Armi, Proc. R. Soc. Lond. A 457, 2820-2830 (2001). M. L. Chanin and A. Hauchecorne, Indian J. Rad. Space Phys. 20, 1-11 (1991). V.Banakh and V.L. Mironov, LIDAR in Turbulent Atmosphere, Boston and London: Artech House, 1984. M. J. Curley, B. H. Peterson, J. C. Wang, S. S. Sarkisov, S. S. Sarkisov II, G. R. Edlin, R. A. Snow, and J. F. Rushing, Opt. Express 14, 8929-8946 (2006). A. Zilberman, E. Golbraikh, N. S. Kopeika , A. Virtser , I. Kupershmidt, and Yuri Shtemler, Atm. Res. 88, 66-77 (2008). S. F. J. DeWekker, D. G. Steyn, and S. Nyeki, Boundary-Layer Meteorology 113, 249-271 (2004). W. Viezee, R. T. H. Collis, and J. D. Lawrenee Jr., J. Appl. Meteor. 12, 140-148 (1973). F. M. Ralph, P. J. Neiman, and D. Levinson, Geophys. Res. Lett. 24, 663-666 (1997). E. H. Teets, Jr. C. Ashburn, J. Ehernberger, and R. Bogue, Proc. SPIE 6367, 63670O (2006). J. C. Leader, J. Opt. Soc. Am. 71, 542-588 (1981). G. Parry, Opt. Acta 28, 715-728 (1981). Y. Jiang, J. Ma, L. Tan, S. Yu, and W. Du, Opt. Express 16, 6963-6973 (2008) M. S. Belen’kii, Appl. Opt. 32, 5368-5372 (1993). B. V. Kaul, I. V. Samokhvalov, and S. N. Volkov, Appl. Opt. 43, 6620-6628 (2004). Yu. A. Kravtsov and A. I. Saichev, J. Opt. Soc. Am. A2, 2100-2105 (1985). A. Tunick, Opt. Express 15, 14115-14122 (2007). A. Tunick, Opt. Express 15, 3619-3628 (2007). I. N. Kolev, O. P. Parvanov, B. K. Kaprielov, and I. K. Ilev, C. R. Acad. Bulg. Sci. 39, 43-46 (1986). G. V. Kolarov and I. V. Grigorov, Proc. of 23rd Int. Laser Radar Conference, Nara, Japan, 24-28 July 2006, pp. 881-882
1113 Downloaded 14 Feb 2010 to 195.34.97.210. Redistribution subject to AIP license or copyright; see http://proceedings.aip.org/proceedings/cpcr.jsp