MAGNITUDE AND FREQUENCY OF FLOODING IN THE TAGUS BASIN (CENTRAL SPAIN) OVER THE LAST MILLENNIUM GERARDO BENITO 1, ANDRÉS DÍEZ-HERRERO 2 and MARÍA FERNÁNDEZ DE VILLALTA 3 1 CSIC-Centro de Ciencias Medioambientales, Serrano 115 bis, 28006 Madrid, Spain
E-mail:
[email protected] 2 Departamento de Ingeniería Geológica y Minera, Facultad de Ciencias del Medio Ambiente,
Universidad de Castilla-La Mancha, 45071 Toledo, Spain E-mail:
[email protected] 3 Departamento de Estratigrafía, Facultad de Ciencias Geológicas, Universidad Complutense de Madrid, 28040 Madrid E-mail:
[email protected]
Abstract. A relational database using Access, and an interface based on a Geographical Information System (GIS) with ArcView program, were created to allow spatial-temporal analysis of documentary flood data collected for the Tagus basin (Central Spain). High flood frequencies were registered in the periods: AD 1160–1210 (3%), 1540–1640 (11%; peak at 1590–1610), 1730–1760 (5%), 1780–1810 (4%), 1870–1900 (19%), 1930–1950 (17%) and 1960–1980 (12%). Flood magnitudes of those documentary events were estimated at four sites (Aranjuez, Toledo, Talavera and Alcántara) along the Tagus River using HEC-RAS Computer program, matching the calculated water surface profiles with historical references of flood stage. The largest floods took place during the periods AD 1168–1211 (Toledo and Talavera), AD 1658–1706 (Talavera), AD 1870–1900, and AD 1930– 1950 (Aranjuez, Toledo, Talavera and Alcántara). The temporal distribution of flood magnitude and frequency is discussed within the context of climatic variability experienced by the Iberian Peninsula. Although flood producing mechanisms of Atlantic and Mediterranean basins of the Iberian Peninsula are related to different, independent atmospheric patterns, there is a clear coincidence between most periods showing high flood frequencies. These periods of high flooding seem to correspond to the initial and final decades of periods with climate deterioration described at the continental scale. This suggests that climatic variability over the last millennium has induced a response in hydrological extremes (positive or negative), irrespective of the flood-producing mechanism.
1. Introduction In Spain, there are abundant documentary sources recording extreme meteorological phenomena, such as floods and droughts. These documentary records are included in public and ecclesiastic archives and local chronicles, although research on this subject is still at an early stage. Near complete data series go back as far as the 16th century, discontinuous information is available from the 14th century and scattered data from BC 181. In these documentary sources, special emphasis is placed on extreme events that led to damage to property and public constructions such as bridges, roads, etc. Although the level of perception of flooding by Climatic Change 58: 171–192, 2003. © 2003 Kluwer Academic Publishers. Printed in the Netherlands.
172
GERARDO BENITO ET AL.
the population may change with time due to the progressive expansion of human activity towards the river’s floodplain, most documentary floods can be described according to present standards as extraordinary events. Barriendos and Martín-Vide (1998) classified documentary floods as either extraordinary or catastrophic events, causing overbank flow with little or serious damage respectively. During the last decade, important advances in the reconstruction of documentary flood records in Europe have been achieved (Camuffo and Enzi, 1992; Barriendos, 1996–97; Brázdil, 1998; Pfister, 1999; Brázdil et al., 1999; Camuffo and Enzi, 1995; Sturm et al., 2001; Glaser, 2001). In these papers, the frequency distribution of extreme events within different regions of Europe have been compared and the climatic implications discussed. However, the reconstruction of flood magnitudes (discharge) of these documentary events has not yet been addressed. The combination of both flood frequency and magnitudes can provide valuable information to be used in flood risk analysis and for understanding flood sensitivity to past climatic change as a way of forecasting future flood responses on the regional scale. Given the sensitivity of floods to the climatic variability of the last millennium, global generalisations of the relationship between extreme events and shifts in atmospheric circulation patterns may underestimate the impact of climate change, since climatic and hydrological responses vary regionally (Knox, 1993). Although historical flood analysis does not yield information on the direction of climatic shift, flood frequency and distribution patterns can provide an indication that climatic change has occurred (Benito et al., 1996; Knox, 2000). Further, quantification of documentary flood peak discharges may shed some light on the severity of these changes and their real impact on hydrological response. This paper presents the results of a spatio-temporal analysis of documentary floods occurring in the Tagus Basin (Central Spain) during the last millennium in terms of frequency, seasonality, causality and magnitude. Analysis was also made of changes in the temporal distribution of flood magnitude and frequency within the context of climatic variability experienced by the Iberian Peninsula.
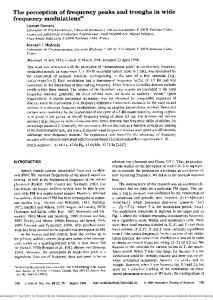
2. Hydrology and Flood Hydroclimatology of the Tagus River The Tagus river drains the central Spanish Plateau (Meseta) and flows east-west into the Atlantic Ocean at Lisbon (Figure 1). It is the longest river of the Iberian Peninsula (1,200 km) and the third largest in catchment area (81,947 km2 ). The Tagus basin is bordered by the Central Range (Gata-Gredos and Guadarrama Mountains) to the North, the Iberian Range to the East, and the Toledo Mountains to the South. The general climate of the Iberian Peninsula, which also applies to the Tagus river basin, is characterised by clear seasonal and monthly variability. Summers are hot and dry and winters are generally mild and relatively wet. This regime is
MAGNITUDE AND FREQUENCY OF FLOODING IN THE TAGUS BASIN
173
Figure 1. The Tagus River watershed and cities with most complete documentary flood datasets along the main course of the Tagus.
controlled by two main systems: the subtropical anticyclone of the Azores during summer, and westerly winds associated with cold fronts in winter. Mean discharge close to the river mouth at Lisbon is 500 m3 s−1 , where a major contribution is provided by the Central Range draining tributaries flowing into the mid-lower reach of the Tagus. General discharge characteristics are: (1) maximum discharge from February to March; (2) minimum discharge in August; (3) a peak in December; and (4) a drop in January. The Tagus river is subjected to extreme seasonal and annual variability including severe floods with peak discharges over 30 times the average discharge. The river’s flood regime is influenced by Atlantic fronts crossing the Iberian Peninsula mostly during winter. Winter flood producing events are mostly related to low pressure cells located southwest of Ireland pushing cold fronts into the western part of the Iberian Peninsula in a west-east and southwest-northeast direction. Blockage of these low pressure cells may give rise to weeks of continuous precipitation and to severe flooding. Eastern and northeastern tributaries have a mixed hydrological supply from melt and rain waters from the Iberian and Central Range, while southern tributaries (Toledo Mountains) are mainly fed by rain waters. Flood-producing events in the northern, northeastern and eastern tributaries are also related to Atlantic fronts crossing the Peninsula from November to May. Eastern tributaries show a second flood maximum during autumn related to cold pool cells developing mainly along
174
GERARDO BENITO ET AL.
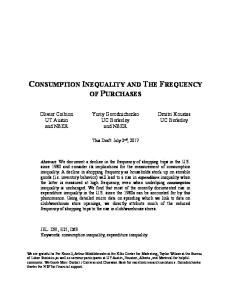
Figure 2. Main screen of the Palaeotagus Database built on Arc-View GIS. Menu windows show the main items and options associated with a consultation. A query result on the main screen shows sites with documentary flood information corresponding to the entire database. The dot size indicates the number of documented floods.
the Mediterranean coast producing intense precipitation. Southern tributaries also show a second peak during summer and early autumn associated with convective thunderstorms that cause catastrophic flash floods in small catchments.
3. Methodology and Data Sources When the basin under investigation is extensive, such as the Tagus Basin (81,947 km2 ), where flood events respond to different climatic patterns and meteorological situations, analysis should not only take into account temporal variability in the occurrence of floods, but also the spatial and seasonal variability of these flood events through time. The PALEOTAGUS database, created using the ArcView GIS program, was designed to compile, analyse and interpret palaeohydrological data generated in the Tagus drainage basin (Díez-Herrero et al., 1998; Benito et al., 1999; Fernández de Villalta et al., 2001). The database contains 355 records of documented historical flood events occurring in the Tagus basin from AD 849 to 1979 (Figure 2). Each record is compiled of information within 35 fields, including data that range from the spatial, temporal or causal characterisation of the flood event to the damage incurred or the document sources consulted (Figure 2). The information contained in PALEOTAGUS is derived both from historical documents (Proceedings of the City Council, diaries, chronicles, memoirs,
MAGNITUDE AND FREQUENCY OF FLOODING IN THE TAGUS BASIN
175
etc.) consulted directly after verifying that they contain original, unaltered and complete information, and indirect sources used at locations where the original documents are non accessible or destroyed. Most of the indirect information has been checked by cross-referencing between different sites. Direct information sources consulted include libraries and national, provincial and municipal archives. Further bibliographical sources consulted include scientific and technical reports, local history works and non-systematic recompilations such as those of Rico Sinobas (1850), Bentabol (1900), Masachs (1948, 1950), FontanaTarrats (1977), Gonzálvez (1977), López-Bustos (1981), Comisión Técnica de Inundaciones (1985), Font (1988), Canales (1989), as well as local documentary recompilations and press items from newspapers and technical reports from the Tagus Water Authority. The diversity of documentary sources provide a wide range of data series quality ranging from complete and continuous data sets to complete but discontinuous (at some periods) data series, together with scattered information for small streams. Those complete and discontinuous data series for a site were completed for the discontinuous periods using data from other sites and archives. In any case, even the most incomplete series, mainly corresponding to periods before the 14th century, provide us with valuable information on periods of concentrated floods, without the drawback of a lack of data reflecting a lack of extreme events. The 355 entries may be considered a random sample of sufficient size to permit the identification of clusters of flood events over the last millennium. Discharge estimation associated with documentary floods has only been undertaken for the Tagus River at some historical towns, for which the compilation of data is most complete, namely Aranjuez, Toledo, Talavera de la Reina and Alcántara (Figure 1). For these towns, the time span of documentary flood references is irregular and covers the period from AD 1557 for Aranjuez, from AD 1113 for Toledo, from AD 1203 for Talavera and from AD 1856 for Alcántara. Water stage data related to historical flooding include: (1) sites or landmarks reached by the flood (e.g., churches, bridges, etc.), (2) flooded areas (e.g., orchards, floodplain areas), (3) non-flooded areas or landmarks (e.g., Royal Palace surrounded by water), (4) relative importance of the event with respect to previous floods (e.g., the 1840 flood was 2 m higher than the flood occurring in 1820). This information can be interpreted in terms of the different flood stage indicators: (1) exact discharge level (equal to the flood stage), (2) minimum flood stage, (3) maximum flood stage, (4) discharge quoted as a range in the case of two recorded levels. During modern times, extraordinary floods involved inundation of the floodplain, and therefore, river discharge filled the channel to its maximum capacity (bankfull discharge). The documentary flood series were completed with annual-maximum flood series (instrumental readings) recorded in gauge stations. Discharge estimations associated with reported historical water levels were made using the U.S. Army Corps of Engineers River Analysis System computer program-HECRAS (Hydrologic Engineering Center, 1995). The computation pro-
176
GERARDO BENITO ET AL.
cedure involves the solution of the one-dimensional energy equation, derived from the Bernoulli equation, for steady gradually-varied flow. Documentary flood reconstruction is based on calculation of the step-backwater profile achieving best correlation with the historical reference of flow stage. Cross-sections 25 to 100 meters apart were established either on field survey or from detailed topographical maps (1:500 or 1:1000 in scale). Channel geometry was surveyed in the field in all cases. The accuracy of discharge estimates depends on the stability of cross-section geometry through time. For stable, bedrock-confined channels, such as in Alcantara and parts of the Toledo reaches, channel geometry at maximum stage is known or approximately estimated, since no major changes may be assumed for the last 1000 years. For this example, the step-back water calculations, together with historical references of flow stages, provide precise discharge estimates. In contrast, in alluvial reaches with a mobile bed, such as in Aranjuez and Talavera, channel geometry may change through time and, therefore, step-back water calculations carry a substantial level of uncertainty in the discharge estimates.
4. Results 4.1. FLOOD FREQUENCY VARIABILITY Simple statistical analysis methods, based on thematic and spatial searches using the PALEOTAGUS database management system (DBMS) of the GIS program, including the use of the data georeferencing application were carried out. These searches were focused on three main features: spatial distribution and causal analysis, temporal distribution of events (Figure 3); as well as on each possible boolean combination of these simple searches. The distribution of documentary flood events shows a greater proportion related to tributary streams (61%) than to the Tagus (39%). Most of the reported floods are produced in streams arising in the Guadarrama Mountains (45%), followed by Gata-Gredos Mountains (35%), the Iberian Range and surrounding area (11%) and Toledo Mountains (9%). Regarding the flood seasonal distribution, the highest number of floods were produced during the winter period (45%) followed by autumn (28%), spring (16%) and summer (11%). This percentage distribution is maintained in the different interannual periods established, with practically 50% of events concentrated in the winter, with the exception of the time period 1350–1650, where the highest number of events occurred in autumn (40%). This represents a considerable anomaly in the series. Also of interest is the concentration of winter events (56%) during the period 1100–1350 and lack of reported events in summer. This, however, may not be considered to be statistically representative due to the reduced number of events (9 records). The analysis of causes indicates that 90% of floods corresponding to
MAGNITUDE AND FREQUENCY OF FLOODING IN THE TAGUS BASIN
177
Figure 3. Temporal variability and seasonal distribution of the number of floods per decade recorded for the Tagus River Basin over the last 1000 years.
the Tagus river and its entire basin are associated with rainfall, followed by rain combined with snowmelt. An unexpected finding of this analysis is the 12% of events related to in situ precipitation in the Toledo Mountains. Decadal distribution of documentary floods (Figure 3) shows an increasing tendency and exponential pattern (parabolic or hyperbolic). This has been classically explained by an increase in the amount of available information on most recent flood events and by ever-growing anthropogenic pressures in potential flood areas due to development in the 20th century. However, polymodality may only be accounted for by the occurrence of periods of concentrated flood events, although we are aware of the lack of continuous documented records between 1257 and 1420. These series are also biassed by the number of sources available through time, which vary from one document per year between AD 712 and 1250, to more than 2800 documents per year for the period AD 1927–1936. A random criterion or graphical classification to individualise periods by separating those showing large variations from the mean was used (Table I). According to this criterion, seven major periods were differentiated which include 71% of the data and cover a total of 280 years of the 900 years of the study period. Similarly, the record shows five minor or secondary periods of dense recording of floods. This
178
GERARDO BENITO ET AL.
Table I High flood frequency periods for the Tagus drainage basin since AD 1100. Major period
Minor period
1160–1210 1420–1440 1480–1500 1540–1640 a 1650–1660 1680–1690 1700–1710 1730–1760 1780–1810 1870–1900 1930–1950 1960–1980
Number of years
No. reported floods
50
11
20 20
6 3
100
41
10 10 10
4 2 6
30 30 30 20 20
18 14 72 67 47
Percentage of total floods 3 1.5 0.8 11 1 0.5 1.5 5 4 19 17 12
a Period with a peak between 1590 and 1610.
secondary periods includes 21 records (5.3% of flood data), covering 70 years of record. In an attempt to objectively define the limits of these periods, simple statistical analysis methods described in the literature such as the moving average were applied to modulate large temporal variations (Barriendos and Martín-Vide, 1998). This tool projects values into the prognostic period, based on the mean of a variable calculated over a specific number of previous periods; in this paper the moving average was calculated using 3 data intervals (i.e., 3 decades). Using these results (numerical and graphical; Figure 4), it is possible to define intervals in which the prognostic value exceeds the mean for the data series (in this case, 3 events per decade). Five periods of concentrated events were identified (1200–1230; 1560– 1620; 1700–1720; 1740–1810; 1860–2000), which broadly coincided with the periods established graphically. 4.2. RECONSTRUCTING DOCUMENTARY FLOOD MAGNITUDES 4.2.1. Discharge Estimations at Aranjuez The Tagus river in Aranjuez drains a surface of 9,340 km2 , mostly fed by the Iberian Range headwaters. In Aranjuez, the Tagus’ alluvial channel meanders over a floodplain 800–1000 m in width. The quality of the documentary flood record for Aranjuez for the last 445 years is undoubtedly the best of the entire course of the
MAGNITUDE AND FREQUENCY OF FLOODING IN THE TAGUS BASIN
179
Figure 4. Distribution of the reported number of floods per decade and moving average analysis taking a three data interval.
Tagus. This is due to the royal palaces and gardens, constructed on the Tagus River floodplain, that have prompted the recording of any single flood causing inundation since 1557. The hydraulic model comprises a 13 km reach, along which 57 cross-sections were surveyed. Hydraulically, the Aranjuez reach is complex due to its wide floodplain and close junction with the Jarama river, as well as its numerous constructions and structures such as dams, bridges, dykes, dam mills, etc. Discharge estimates using a one-dimensional hydraulic model for a floodplain river reach, may carry uncertainties. Nevertheless, the use of relative discharge values provide a fairly precise estimation on flood magnitudes and on the severity of the flood periods. The documentary record for Aranjuez (1557–1911) comprises 62 floods. In written documents, reference is made to over 100 landmarks associated with flooding, namely, gardens, streets, houses, bridges, orchards, groves, fonts, fords, dykes, canals, mills and dams. If we consider flood frequency distribution for Aranjuez (Figure 5), four periods can be distinguished (Table II): 1563–1611, 1739–1750, 1860–1892 and 1917–1928. The most important period in terms of flood number and magnitude corresponds to 1860–1892 and includes a total of 15 flood events, six of which showed minimum peak discharges over 500 m3 s−1 . The largest of these occurred in 1878, showing a minimum peak discharge of 1000 m3 s−1 (Table II). The next period in terms of flood magnitude corresponds to 1563–1611
180
GERARDO BENITO ET AL.
Figure 5. Annual flood series of reported documentary floods (discharges estimated using HECRAS model) and systematic flood discharges (recorded in gauge stations) in four reaches of the Tagus River. Floods with unknown flood stage are drawn in short bars indicating the occurrence date but without discharge meaning.
with 7 flood events, four of minimum discharge over 400 m3 s−1 , and the largest (1611) over 950 m3 s−1 . A third historical flood period corresponds to 1739–1750 with six flood events, three of over 350 m3 s−1 , reaching a minimum discharge of 750 m3 s−1 in 1747. In the 20th century, and according to the gauge station record (1911–1985), numerous flood events occurred during the period 1917–1928, three over 450 m3 s−1 . At The Farmer’s Lodge (Royal Lodge for deer hunting), two water stage marks on a column located at ground level served to ascribe flood dates of December 20th 1916 (discharge reaching up to 762 m3 s−1 ) and March 27th 1924 (discharge estimate of 635 m3 s−1 ), the latter receding on April 2nd 1924.
Drainage area (km2 )
9,340
24,788
33,849
51,958
Reach
Aranjuez
Toledo
Talavera de la Reina
Alc´antara
Bedrock gorge 300 m-wide 140 m-deep
Sinuous braided pattern of 400–600 m channel width
Bedrock gorge
147
800 (discontinuous)
890
445
1856 (gauged since 1913)
1203 (gauged since 1911)
1113 (gauged since 1972)
1557 (gauged since 1911)
(year AD)
(years) Alluvial channel meanders over a floodplain 800–1000 m in width
event
record
floodplain
First flood
Length of flood
Type of channel and
5
11
32
62
Events
2
2 main reference sites
>35
>100
Landmarks
Number of available historical floods
1420–1485 1658–1706 1936–1955
1168–1211 1527–1606 1778–1788 1857–1876 1916–1951
1563–1611 1739–1750 1860–1892 1917–1928
Periods (years AD)
3 4 8
10 8 2 2 6
7 6 15 5
period
Number of floods in
2 events Q > 2500 2 events Q > 3300 3 events Q > 2300
4 events Q > 3600 7 events Q > 700 Q > 500 1 event Q > 3000 5 events Q > 1100
4 events Q > 400 3 events Q > 350 6 events Q > 500 3 events Q > 450
Flood discharge (Q in m3 s−1 )
1856 1876 1941 1947 1912 1979 1989
1674, 1681 1947 1203, 1780, 1856
1168, 1178, 1181 1531 1778 1876 1947
1611 1747 1878 20-12-1916 02-04-1924
(years AD)
Date
Q ≈ 10,500 Q ≈ 14,800 Q ≈ 13,700 Q ≈ 11,800 Q ≈ 3800 Q ≈ 8115 Q ≈ 7500
Q > 3300–3800 Q ≈ 3700 Q ≈ 3000–4000
Q ≈ 3600 Q ≈ 2000 Q ≈ 1100 Q ≈ 3200 Q ≈ 2900
Q > 950 Q > 750 Q > 1000 Q > 762 Q ≈ 635
Magnitude (m3 s−1 )
Date and magnitude of extreme flooding
Table II Main characteristics of the documentary data sets in the four studied sites, showing their geomorphological configuration, dataset extension and estimated flood discharges for selected events
MAGNITUDE AND FREQUENCY OF FLOODING IN THE TAGUS BASIN
181
182
GERARDO BENITO ET AL.
4.2.2. Discharge Estimations at Toledo The Toledo reach, 40 km downstream from Aranjuez, drains a catchment area of 24,788 km2 . Upstream from Toledo, the river Tagus flows through an alluvial floodplain, and narrows as it enters a bedrock gorge which surrounds the city. Some 250 m downstream from the bedrock entrance, there is a mill constructed in medieval times and a dam that diverts water towards the mill at times of low flow. At this point, a hydraulic jump occurs during flood events permitting critical flow to be selected as the boundary condition to be applied in the hydraulic model. It is known that the fluvial geometry of the upper stretch of this reach has changed through time. However, this type of setting with a hydraulic controlling section in the bedrock canyon, which we may assume remains more or less unchanged, determines that changes in the fluvial geometry of the upper reach do not substantially affect the peak discharge values yielded by hydraulic modelling. For this scenario, discharge estimates derived from the one-dimensional hydraulic model will be fairly precise. Toledo’s documentary flood record starts in AD 1113, with 32 flood events described in written documents before the gauge record commenced in 1972 (Figure 5). In these documents, flood stages refer to more than 35 landmarks such as gates, churches, orchards, bridges, mill dams, and in recent times, to the railroad station and to The Royal fire-gun factory. Note that the city of Toledo lies on a bedrock hill, where only a limited number of historical buildings or human activities would be affected by flooding. Thus, the level of perception of flooding is substantially lower than for Aranjuez and, therefore, only the largest floods will be documented. This may, to some extent, explain that even if the record period is longer than for Aranjuez, the number of flood events reported is notably lower. Two reaches of the Tagus were subjected to hydraulic modelling: one, 700 m in length, at the entrance to Toledo’s gorge, where 20 cross-sections were surveyed, and a 500 m-long reach at its exit providing 18 cross-sections. Largest historical floods in terms of peak discharge (Figure 5) were recorded for the periods 1168– 1211, 1527–1606, 1778–1788, 1857–1876 and 1916–1951. The most significant documentary flood period, both in terms of magnitude and frequency, is 1168–1211 with 10 events, four of which reached peak discharges of 3600 m3 s−1 . During the period 1527–1606, at least 8 flood events occurred, 7 of minimum peak discharge over 700 m3 s−1 , reaching 2000 m3 s−1 . At least two large flood events took place between 1778–1788 and 1857–1876, within a short time span, the largest one in 1876 was estimated in 3200 m3 s−1 . Scattered large flood events were also recorded in 1113, 1258, 1435, 1485. During the 20th century, largest floods concentrated in the period 1916–1951, with 6 large flood events, 5 of which were related to minimum peak discharges over 1100 m3 s−1 , the largest (1947; Figure 6) being ca. 2900 m3 s−1 . According to the gauge record (1972–1993), the largest flood produced in 1978 reached 552 m3 s−1 , a discharge value far below estimates for documentary floods.
MAGNITUDE AND FREQUENCY OF FLOODING IN THE TAGUS BASIN
183
Figure 6. (a) Upstream view of the Tagus river into the Huerta del Rey (King’s Garden) during flooding in March 6th, 1947 at Toledo. The peak discharge was reached at 10 hr and the picture was taken at 15.20 hr (by courtesy of Mariano Garc´ıa Bargueño). The water level at peak discharge was ca. 1.5 m above the railway station ground level (main building at the centre of the photograph). (b) Present day picture of the same view. The Palacio de Galiana is visible to the left of the clock tower. This flood landmark was once the site of an old Arab garden where Al-Mamun, taifa king of Toledo from AD 1043–1075, built his summer home.
184
GERARDO BENITO ET AL.
4.2.3. Discharge Estimations at Talavera The Talavera reach is ca. 70 km downstream of Toledo and, at this point, drains a surface area of 33,849 km2 . About 5 km upstream from this reach, the Tagus joined by one of its major tributaries, the Alberche river. In Talavera, the Tagus shows a sinuous braided pattern of 400–600 m channel width, with frequent transversal bars and islands stabilised by riparian vegetation, subjected to further high-stage sedimentation. The channel meanders along a 1.5 km-wide floodplain which is about 5–7 m above the Tagus river channel bottom. Peak discharge values estimated for this reach are to be interpreted with caution not only because the model uncertainties but also due to changes in channel geometry due to erosion and deposition in this river reach. The documentary flood record for Talavera goes back to 1203 and is scarce and incomplete. Eleven flood events were documented before the gauge station record (1911–1989). Most high water stages were referred to two landmarks: a Roman bridge and a church (Virgen del Prado) located on the floodplain, as well as to several roads cut by flooding. In Talavera, the level of perception is restricted to these specific landmarks and may explain the limited amount and quality of documentary flood data available. Flood events of highest frequency and magnitude in terms of peak discharge (Figure 5) were recorded in Talavera from 1658–1706. At least two of these four extraordinary events showed minimum peak discharges over 3000 m3 s−1 and the largest showed a minimum peak discharge of 3800 m3 s−1 (Table II). Probably the largest reported flood occurred in 1203, with an estimated discharge of 4000 m3 s−1 , during which some of the old parts of the city on the first stream terrace of the Tagus river were flooded. In the 20th century, the largest flood occurred in 1947 with an estimated peak discharge of 3700 m3 s−1 . 4.2.4. Discharge Estimations at Alcántara The Alcántara reach is located close to the Portuguese border, ca. 200 km downstream from Talavera, and has a catchment area of 51,958 km2 . In this reach, the Tagus river flows within a 140 m-deep, 300 m-wide gorge cut in Palaeozoic slates and schist rocks. The bedrock channel is incised 15 m in a strath terrace, which alternates on both sides of the river along the gorge. It may be assumed that bedrock channel geometry remained substantially unchanged during the documentary period and that flow at peak discharge along this gorge is basically one-dimensional. Thus, we may be confident that HEC-RAS hydraulic modelling data derived from this reach will provide good peak discharge estimates for known historical stages. The documentary record for Alcantara is short (from 1856) but extremely accurate. The seven documented floods are referred to the Alcantara Roman bridge, an impressive work of civil engineering built in AD 103 (Figure 7). Some 200 m in length and 7 m in width, the bridge bears two central arches with openings 28.8 m and 27.4 m high, supported by two lateral arcs with openings 21.9 m and 13.8 m in height. The largest floods during the last 200 years were recorded in 1876, 1941, 1947 and 1856, for which exact water stages are known yielding HEC-RAS model
MAGNITUDE AND FREQUENCY OF FLOODING IN THE TAGUS BASIN
185
Figure 7. Alcantara Roman Bridge, built in AD 103, with 200 m in length and central arcs openings of 28.8 and 27.4 m in height. (a) Photo taken in 1950 (previous to the Alcantara Dam construction). (b) Cross-section showing the flood stages (from historical landmarks and historical pictures), and the associated discharges estimated using HEC-RAS hydraulic model.
peak discharge estimates of 14,800, 13,700, 11,800 and 10,500 m3 s−1 respectively (Table II; Figures 5 and 7). The HEC-RAS model was calibrated for the 1989 and 1996 floods using discharge data recorded at the Alcantara dam and water stages recorded in photos and videos taken at different times. Further important flood events occurred in 1912 and 1989, with estimated peak discharges of 3800 and 7500 m3 s−1 . According to the Alcántara gauge station record (1913–1986), the
186
GERARDO BENITO ET AL.
largest flood occurred in 1979, with a peak discharge of 8115 m3 s−1 . The Vila Velha do Ródão (61,000 km2 ) gauge station (record 1901–1978) in Portugal, 70 km downstream from Alcántara, registered large floods in 1978, 1941, 1939–40, 1912 and 1947, although the largest stage was documented in December 1876 with an estimated discharge of 15,850 m3 s−1 (Daveau et al., 1978).
5. Documentary Floods of the Tagus Basin in the Iberian Peninsula Context In the Iberian Peninsula, flood producing mechanisms in Atlantic and Mediterranean basins are attributable to very different, independent atmospheric patterns. Indeed, one would expect either the historical flood frequency of the Tagus to resemble those of nearby Atlantic basins, but to differ from flood frequencies of Mediterranean basins. Comparison of historical flood frequencies corresponding to neighbouring regions will provide some clues on the degree of synchronism and/or regional differences on the hydroclimatic responses. During the last millennium, the earliest period showing an anomalous number of floods in the Tagus basin varies between 1160 and 1210 which may correspond to the late Medieval Warm Period (probably 900–1200, after Flohn, 1993). However, it is not evident to some authors that this period may be clearly defined in similar terms on the global and continental scale (Hughes and Diaz, 1994). The concentration of floods from 1150 and 1300 is also apparent for other Atlantic basins of the Iberian Peninsula (Benito et al., 1996), which were probably associated with unusually wet winters. Flooding of the Tagus River from 1160 to 1210 was frequent as well as exceptional, and water stage data indicate that these floods were the greatest of the available documentary record. Of particularly large magnitude were the floods of 1168 (also recorded for the rivers Duero and Guadalquivir; Benito et al., 1996), 1178, 1181 and 1207. These floods attained peak discharges in Toledo of 3600 m3 s−1 , exceeding the catastrophic floods of the Tagus in 1876 and 1947. In contrast to periods showing a high flood frequency, we should highlight the lack of information on extraordinary events occurring between 1250 and 1400, with the exception of the 1258 flood which affected most of the peninsular Atlantic basins (Duero, Tajo and Guadalquivir). However, the 2500 m3 s−1 discharge estimated in Toledo is lower than that recorded for the previous period. A climatic interpretation based on this lack of data would not be appropriate, given the potential discontinuity of data series prior to the 14th century. Copious winter precipitation, particularly during 1402–1403, 1434, 1485 and 1488 resulted in severe floods which affected most Atlantic basins (Duero, Tagus and Guadalquivir; Benito et al., 1996). From 1420 to 1485 there are records of at least three exceptional floods in Toledo and Talavera. Worthy of note is that occurring in 1485, which also surpassed 1000 m3 s−1 in Toledo. In general, the period 1400–1540 presents a high concentration of climatic anomalies, including opposite hydrological signs such as frequent droughts and years with particularly
MAGNITUDE AND FREQUENCY OF FLOODING IN THE TAGUS BASIN
187
wet winters, proof of the climatic deterioration already evident since the start of the 14th century (Pfister et al., 1996) that continued into the 15th and 16th Centuries. The next period showing greatest flood frequency 1540–1640, presents a flood magnitude and frequency maximum from 1590 to 1610. References in historical documents to the water stage or discharge attained by the floods for this period are scarce (data on the stages of at least 4 events are missing for Aranjuez and Toledo), although it would seem that these floods were not of the magnitude of those recorded at the end of the 12th- beginning of the 13th century. Minimum discharges estimated for floods for which there is an available record always exceed 400 m3 s−1 in Aranjuez, with a maximum of 950 m3 s−1 (AD 1611), and 700 m3 s−1 in Toledo, with a maximum of 1350 m3 s−1 (AD 1565). In NE Spain, Barriendos (1996–97) describes a period between 1580–1620 as an intense, prolonged phase with hydrologic extreme events doubling mean values, during which the great flood of 1617 that affected several basins of the Mediterranean coast was produced. This period also has its equivalent in other basins of the Mediterranean coast, where an anomalous number of exceptional floods took place over the last three decades of the 16th century and first three of the 17th century (1570–1630), with two maximum periods (1588–1596 and 1602–1620) and a peak in 1606 (Barriendos and Martín-Vide, 1998). In other major Iberian rivers such as the Guadalquivir (winter flood pattern), flood maxima appeared in the 1540s and 1590s (Brázdil et al., 1999; Sánchez Rodrigo et al., 1995): in February–March 1590 (also affecting Loja and Granada), February–March 1591, January 1593, January 1594, November–December 1595 and January 1597 (also affecting the river Duero in Castilla). Extensive flooding due to frontal systems was also reported in 1603– 1604 in the Duero, Tagus, Guadiana and Guadalquivir rivers and in 1626 in the Duero, Tagus and Guadalquivir (Benito et al., 1996). Although the onset and duration of the Little Ice Age is a subject of debate (Grove, 1988; Pfister and Brázdil, 1999), authors such as Flohn (1993) identify several periods of maximum intensity (1570–1620, 1680–1700, around 1750, and 1810–1850). The former period (1570– 1620) coincides with the detection of a maximum concentration of floods in the Tagus basin (1540–1640), particularly at Aranjuez (1563–1611). The minor periods 1650–1660, 1680–1690 and 1700–1710 are clearly defined for some northern tributaries and in the records of the river Tagus as it flows through Talavera, where exceptional floods are documented, at least two of which 1674 and 1681 are among those of greatest magnitude in the documentary record with discharges exceeding 3300 and 3800 m3 s−1 . In particular, the decade 1700–1709 recorded an anomalous frequency of extreme floods (at least 6 events), with no records in previous or subsequent decades. These minor periods are scarcely referred to in the literature. For the north east of Spain, Barriendos (1996–97, 1997) describes a brief ill-defined phase at the end of the 17th century and first decades of the 18th century, with an increase in the number of floods (AD 1660–1700) and drop in temperatures. For the Duero Basin, Alvarez Vázquez (1986) indicates that throughout the decade 1650–1659, at least 5 exceptionally rainy years are shown,
188
GERARDO BENITO ET AL.
two of which coincided with floods of the river Duero. One of the periods of most severe temperatures during the LIA was the Late Maunder Minimum (AD 1675– 1715), during which it is assumed that an increase in meridional circulation over Europe (Kington, 1994), caused a highly variable climatological situation, with strong contrasts in a relatively brief period of time (Pfister and Bareiss, 1994; Borisenkov, 1994). This climatic pattern may partly explain the high variability in decennial changes in the flood frequency of the Tagus river basin. The periods 1730–1760 and 1780–1810 are clearly represented, especially in the Aranjuez record, with 6 events registered between 1739–1747 and 3 events between 1775–1788. During this last period, floods causing damage were also recorded in Toledo (AD 1778) and Talavera (AD 1780). These periods generally coincide with those described for other Atlantic basins of the Iberian Peninsula, such as that of the Duero, where unusually wet years of the 18th century concentrate between 1730–1740 (3 years of exceptional rainfall coinciding with floods of the Duero River) and 1775–1800 (5 years of exceptional rainfall and two catastrophic floods in the Duero; Alvarez Vázquez, 1986). The December 1739 flood, affecting the rivers Duero, Tagus, Guadalquivir and Ebro, was estimated as one of the largest in the documentary record of the Duero, with a peak discharge of 19,000 m3 s−1 (Pardé, 1955). For the northeastern Peninsula, Barriendos (1996–97) describes the Maldà Phase (AD 1760–1800), with a maximum period 1772–1797 and peaks in 1790 and 1791. This phase was characterised by high climatic irregularity accompanied by both hydrologic extremes, catastrophic floods and droughts. In the Ebro Basin, and particularly in its Pyrenean tributaries, the frequency of large floods increased during the period 1770–1790, mainly during spring and autumn, probably triggered by melt waters (Benito et al., 1996). The period 1870–1900 shows a substantial increase in the frequency of extraordinary floods of the Tagus, with of these events (1856 and 1876) reaching peak discharges of magnitudes similar to the ones recorded during the 12–13th centuries. Contemporary with this period, Barriendos (1996–97) identifies a phase between 1840–1859, characteristically similar to the 1588–1610 phase, including a sharp increase in floods and decrease in periods of drought, representing the end of the Neoboreal episode in Mediterranean latitudes. This period is similarly registered in other Mediterranean catchments of Eastern and Southeast Spain (Barriendos and Martín-Vide, 1998) particularly in the middle decades of the 19th century (1830– 1870), with a maximum period from 1848 to 1868 and peaks between 1851–1857 and 1859–1860. There is no doubt that some of the major events of the 750-year flood record of the river Tagus may be ascribed to the first half of the 20th century. Particular emphasis should be placed on the period of flood concentration corresponding to the middle reach of the Tagus between 1916 and 1951, and to its upper reach from 1917 to 1928. Most exceptional floods affecting the entire basin were recorded in 1936, 1941 and 1947, without forgetting those of 1917, 1924 and 1928, which particularly affected the river’s headwater area.
MAGNITUDE AND FREQUENCY OF FLOODING IN THE TAGUS BASIN
189
6. Conclusions Documentary evidence illustrates the high sensitivity of flood magnitude and frequency to the climatic variability of the last millennium. Unusually high flood frequencies were registered in the periods: 1160–1210 (3%), 1540–1640 (11%; peak at 1590–1610), 1730–1760 (5%), 1780–1810 (4%), 1870–1900 (19%), 1930– 1950 (17%) and 1960–1980 (12%). Further minor flood concentration periods identified include the decade 1700–1709, during which at least six extreme floods were recorded. Among the reported floods of the Tagus, those of largest magnitude took place during 1160–1210 (Toledo and Talavera), 1658–1706 (Talavera), 1870–1900, and 1930–1950 (Aranjuez, Toledo, Talavera and Alcántara). The seasonal distribution of floods occurring over the last millennium is similar to the present, with a predominance of floods during the winter (45%), followed by autumn (28%), then by spring (16%) and summer (11%). Nevertheless, some temporal periods between 1350–1650 present a surge in autumn flooding in the Tagus Basin, with no equivalent identified in other documentary periods or during present times. It is possible that, for these periods, there is some relationship between the mechanisms responsible for intense, persistent precipitation in the Tagus Basin (especially at its headwaters) with those acting in other areas close to the Mediterranean. The different flood concentration patterns for the Tagus Basin would appear to coincide with those corresponding with other main Atlantic basins of the Iberian Peninsula (Alvarez Vázquez, 1986; Sánchez Rodrigo et al., 1995; Benito et al., 1996; Brázdil et al., 1999). Further, although the meteorological flood-producing conditions in the Iberian Peninsula watersheds draining into the Mediterranean (autumn and spring flooding) differ from those generating floods in Atlantic basins (mainly winter conditions), there is a clear coincidence between most periods showing high flood frequencies. For the time being, these documentary periods of flood concentration appear to correspond to the initial and final decades (i.e., at times of system transition and adjustment) of the main climatic periods identified on the global scale (the Medieval Warm Period and Little Ice Age). This suggests that the climatic variability of the last millennium has induced a response of hydrological extremes that is of similar magnitude and sign for each basin type, irrespective of the responsible weather mechanisms. Notwithstanding, sensitivity to climatic variation may differ according to the particular basin, given that there are defined periods for Atlantic basins that are not reflected in those of the Mediterranean. Documentary floods and palaeoflood records from many regions show extreme hydrological events to be more sensitive to climatic change than modal-range hydrological events (Knox, 2000). In the Tagus river basin, some of the largest floods over the last 750 years occurred during the first half of the 20th century. This, to some extent, could be considered a typical hydrological response of the system to the new warming period.
190
GERARDO BENITO ET AL.
Acknowledgements This research was supported by the Spanish Committee for Science and Technology (CICYT) grant HID99-0850 and REN-2001-1633, the FEDER Project 1FD97-2110-CO2-02, and by the European Commission (DG XII): research contract number EVG1-CT-1999-00010 (Systematic, Palaeoflood and Historical data for the improvEment of flood Risk Estimation, ‘SPHERE’ Project). We thank Mayte Rico, David Uribelarrea, M. Angeles Casas and Varyl Thorndycraft for helping in the cross-sections surveying. We are particularly grateful for the review comments of Mariano Barriendos on the original draft of the manuscript, and for the English corrections suggested by Varyl Thorndycraft. References Alvarez Vázquez, J. A.: 1986, ‘Drought and Rainy Periods in the Province of Zamora in the 17th, 18th and 19th centuries’, in López Vera, F. (ed.), Quaternary Climate in Western Mediterranean, Universidad Autónoma de Madrid, Madrid, pp. 221–233. Barriendos, M.: 1996–1997, ‘El Clima Histórico de Catalunya (siglos XIV–XIX). Fuentes, Métodos y Primeros Resultados’, Revista de Geografía 30–31, 69–96. Barriendos, M.: 1997, ‘Climatic Variations in the Iberian Peninsula During the Late Maunder Minimum (AD 1675–1715): An Analysis of Data from Rogation Ceremonies’, The Holocene 7, 105–111. Barriendos, M. and Martín-Vide, J.: 1998, ‘Secular Climatic Oscillations as Indicated by Catastrophic Floods in the Spanish Mediterranean Coastal Area (14th–19th Centuries)’, Clim. Change, 38, 473–491. Benito, G., Fernández de Villalta Compagni, M., Díez Herrero, A., and Laín Huerta, L.: 1999, ‘Base de Datos Paleotagus: Incorporación de la Información Paleohidrológica en un SIG para el Análisis de Riesgos Naturales’, in Laín Huerta, L. (ed.), Los Sistemas de Información Geográfica en los Riesgos Naturales y en el Medio Ambiente, ITGE (Ministerio de Medio Ambiente), Madrid, pp. 21–31. Benito, G., Machado, Ma . J., and Pérez-González, A.: 1996, ‘Climate Change and Flood Sensitivity in Spain’, in Branson J., Brown A. G., and Gregory K. J. (eds.), Global Continental Changes: the Context of Palaeohydrology, Geological Society, Special Publication 115, London, pp. 85–98. Bentabol, H.: 1900, Las Aguas de España y Portugal, Vda. e hijos de M. Tello, Madrid, 347 pp. Borisenkov, Y.: 1994 ‘Climatic and other Natural Extremes in the European Territory of Russia in the Late Maunder Minimum (1675–1715)’, in Frenzel, B. (ed.), Climatic Trends and Anomalies in Europe, 1675–1715, Gustav Fischer, Stuttgart, pp. 83–94. Brázdil, R.: 1998, ‘The History of Floods on the Rivers Elbe and Vltava in Bohemia’, Erfurter Geogr. Studien 7, 93–108. Camuffo, D. and Enzi, S.: 1992, ‘Reconstructing the Climate of Northern Italy from Archive Sources’, in Bradley, R. S. and Jones, P. D. (eds.), Climate Since A. D. 1500, Routledge, London, pp. 143–154. Camuffo, D. and Enzi, S.: 1995, ‘The Analysis of Two Bi-Millennial Series: Tiber and Po River Floods’, in Jones, P. D., Bradley, R. S., and Jouzel, J., (eds.), Climatic Variations and Forcing Mechanisms of the Last 2000 Years, Springer-Verlag, Berlin, pp. 433–450. Canales, G.: 1989, ‘Inundaciones de la Vega Baja del Segura (1875–1925)’, in Gil Olcina, A. and Morales Gil, A. (eds.), Avenidas Fluviales e Inundaciones en la Cuenca del Mediterráneo, Instituto Universitario de Geografía de la Universidad de Alicante, Alicante, pp. 415–433.
MAGNITUDE AND FREQUENCY OF FLOODING IN THE TAGUS BASIN
191
Comisión Técnica de Inundaciones: 1985, Estudio de Inundaciones Históricas: Mapa de Riesgos Potenciales, Comisión Nacional de Protección Civil, Madrid, 159 pp. Daveau, S., Almeida, G., Feio, M., Rebelo, F., Moreira da Silva, R. F., and de Souza Sobrino, A.: 1978, ‘Os Temporais de Fevereiro/Março de 1978’, Finisterra 26, 236–260. Díez-Herrero, A., Benito, G., and Laín-Huerta, L.: 1998, ‘Regional Palaeoflood Databases Applied to Flood Hazards and Palaeoclimate Analysis’, in Benito G., Baker V. R., and Gregory, K. J. (eds.), Palaeohydrology and Environmental Change, John Wiley & Sons Ltd., Chichester, pp. 335–347. Fernández de Villalta, M., Benito, G., and Díez-Herrero, A.: 2001, ‘Historical Flood Data Analysis using a GIS: The Palaeotagus Database’, in Glade, T. Albini P., and Francés, F. (eds.), The Use of Historical Data in Natural Hazard Assessments, Kluwer Book Series, Advances in Natural and Technological Hazards Research, Dordrecht, pp. 101–112. Flohn, H.: 1993, ‘Climatic Evolution During the Last Millennium: What Can We Learn from It?’, in Eddy J. A. and Oeschger, H. (eds.), Global Changes in the Perspective of the Past, John Wiley and Sons Ltd., Chichester, pp. 295–314. Font, I.: 1988, Historia del Clima en España. Cambios Climáticos y sus Causas, Instituto Nacional de Meteorología, Madrid, 297 pp. Fontana-Tarrats, J. M.: 1977, Entre el Cardo y la Rosa. Historia del Clima en las Mesetas, Madrid, 269 pp. Glaser, R.: 2001, Klimageschichte Mitteleuropas. 1000 Jahre Wetter, Klima, Katastrophen, Wiss. Buchgesellschaft, (Darmstadt), 227 pp. Glaser, R., Brázdil, R., Pfister, C., Dobrovlný, P., Barriendos, M., Bokwa, A., Camuffo, D., Kotyza, O., Limanówka, D., Rácz, L., and Sanchez Rodrigo, F.: 1999, ‘Seasonal Temperature and Precipitation Fluctuations in Selected Parts of Europe During the Sixteenth Century’, Clim. Change 43, 169–200. Gonzálvez, R.: 1977, ‘El Clima Toledano en los Siglos XVI y XVII’, Boletín de la Real Academia de la Historia 174, 305–332. Grove, J. M.: 1988, The Little Ice Age, Methuen, London, 498 pp. Hughes, K. M. and Diaz, H. F.: 1994, ‘Was There a ‘Medieval Warm Period, and if so, Where and When?’, in Hughes, M. K. and Diaz, H. F. (eds.), The Medieval Warm Period, Kluwer Academic Publishers, Dordrecht, The Netherlands, pp. 109–142. Hydrologic Engineering Center: 1995, HEC-RAS, River Analysis System, Hydraulics Reference Manual, CPD-69, U.S. Army Corps of Engineers, Davis. Kington, J.: 1994, ‘Synoptic Weather Mapping, 1675 to 1715’, in Frenzel, G. (ed.), Climatic Trends and Anomalies in Europe, 1675–1715, Gustav Fischer, Stuttgart, pp. 205–224. Knox, J. C.: 1993, ‘Large Increases in Flood Magnitude in Response to Modest Changes in Climate’, Nature 361, 430–432. Knox, J. C.: 2000, ‘Sensitivity of Modern and Holocene Floods to Climate Change’, Quat. Sci. Rev. 19, 439–457. López-Bustos, A.: 1981, ‘Tomando el Pulso a las Grandes Crecidas de los Ríos Peninsulares’, Revista Obras Públicas, Marzo 1981, 179–192. Masachs, V.: 1948, El Régimen de los Ríos Peninsulares, CSIC, Barcelona, 511 pp. Masachs, V.: 1950, ‘Aportación al Conocimiento del Régimen Fluvial Mediterráneo’, in Comptes Rendus du Congrès International de Géographie, UGI, II, Lisbonne, pp. 358–390. Pardé, M. : 1955, Fleuves et Rivières, Colin, Paris, 224 pp. Pfister, C.: 1999, Wetternachhersage. 500 Jahre Klimavariationen und Naturkatastrophen 1496– 1995, Bern, 280 pp. Pfister, C. and Bareiss, W.: 1994, ‘The Climate in Paris between 1675 and 1715 According to the Meteorological Journal of Louis Morin’, in Frenzel B. (ed.), Climatic Trends and Anomalies in Europe, 1675–1715, Gustav Fischer, Stuttgart, pp. 151–172.
192
GERARDO BENITO ET AL.
Pfister, C. and Brázdil, R.: 1999, ‘Climatic Variability in Sixteenth-Century Europe and its Social Dimension: A Synthesis’, Clim. Change 43, 5–53. Pfister, C., Schwarz-Zanetti, G., Hochstrasser, F., and Wegmann, M.: 1996, ‘Winter Severity in Europe: The Fourteenth Century’, Clim. Change 34, 91–108. Rico Sinobas, M.: 1850, ‘Fenómenos Meteorológicos en la Península Ibérica desde el Siglo IV hasta el XIX’, Real Academia de Medicina de Madrid, Manuscritos 23, 4–15. Sánchez Rodrigo, F., Esteban-Parra, M. J., and Castro-Díez, Y.: 1995, ‘The Onset of the Little Ice Age in Andalusia (Southern Spain): Detection and Characterisation from Documentary Sources’, Annales Geophysicae 13, 330–338. Sturm, K., Glaser, R., Jacobeit, J., Deutsch, M., Brázdil, R., Pfister, C., Luterbacher, J., and Wanner, H.: 2001, ‘Hochwasser in Mitteleuropa seit 1500 und ihre Beziehung zur Atmosphärischen Zirkulation’, Petermanns Geographische Mitteilungen 6, 14–23. (Received 28 January 2002; in revised form 13 September 2002)