MSeasy: an R package for pre-processing of GC/LC-MS data adapted to chemical ecology Yann Guittona, Florence Nicolèa, Elodie Courtois b, Jérôme Mardon c, Martine Hossaert-Mckey c, Laurent Legendrea Contact:
[email protected] aUniversité de Lyon, F-69003, Lyon, France; Université de Saint-Etienne, F-42000, Saint-Etienne, France; BVpam, EA 3061; 23 rue du Dr Paul Michelon, F-42000, Saint-Etienne, France. b Laboratoire Evolution & Diversité Biologique UMR CNRS 5174 Bâtiment 4R3 Université Paul Sabatier 118, route de Narbonne 31062 Toulouse cedex 4, France . c Behavioural Ecology Group, Centre d’Ecologie Fonctionnelle et Evolutive UMR CNRS 5175, 1919 route de Mende, F-34293 Montpellier, cedex 5, France .
Abstract
The democratization of metabolic analyses has extended the scope of metabolomics to ecological questions. Chemical ecology interprets the variation and diversity of chemical signals of non-model organisms in the light of species interactions. Elucidating the biological information within such complex signals, using robust statistical analyses, requires a large number of replicates. We developed an unsupervised pre-processing method, that generates a fingerprinting peak list from large GC/LC-MS dataset. The method is based on the clustering of mass spectra and does not require any profile correction, retention time alignment or normalization. It is robust to the use of different types of columns and to shifts in retention times particularly common for large/longterm experiments. On the two datasets, used for validation we found that the best clustering method for grouping similar mass spectra was the hierarchical clustering analysis with the Euclidean distance and the Ward linkage. However, it is not excluded that other clustering algorithms could be more adapted for other datasets. For that reason, we have developed a function to identify the best clustering algorithm for each dataset. Availability : The package “MSeasy” implementing our pre-processing method is freely available. For non R users a graphical interface was created.
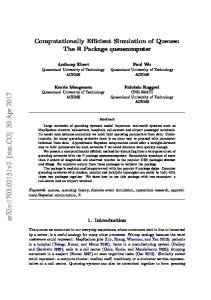
Process description Objective: unsupervised pre-processing of GC /LC-MS data in chemical ecology investigations
Workflow of the MSeasy package Inputs
Lavenders
Tropical trees
GC/MS data
Birds
LC/MS data
Made by externals softwares
Data from nice species But non-model species !
Step 1: Collect & compile data from chromatograms & spectra
Outputs
Corals
Compiled data matrix: Sample/RT/ abundance of each m/z
What is the best clustering method ? Test of the best clustering algorithm with a subdataset made of known peaks taken from the main dataset.
Graphic result: The best distance and the best linkage algorithm are easily seen on the graphic. Euclidean distance & Ward linkage give best results in all evalutated datasets. 0.5 0.7 0.9
Parameters Step 2: Group similar spectra into molecules, produce peak list and outfiles for quality control
PAM
diana
centroid
ward
complete
single
cor mink_1/2 mink_1/3 manhattan euclidean
average
Homogeneite
Answer
Best
Matching coefficient
Or Any matrix in the right format made by user by is own means
Option
Results: Tropical trees : 55 species, 390 GC-
0.9 0.7
diana
centroid
ward
complete
single
average
Mean silhouette width2
① How many clusters?
PAM
cor mink_1/2 mink_1/3 manhattan euclidean
0.5
Silhouette width
Silhouette Test
clu1
clu2
clu3
Sample 1
0
1
0
Sample 2
0
1
1
Sample 3
1
1
0
Conclusion
② How good are the clusters ? Answer :137
Small RT/RI shift
High RT/RI shift
☺ 1 cluster = 1 molecule
☺ 1 cluster = 2 molecules with similar spectra
OR
Number of clusters
High Silhouette width
MS runs, 250 clusters=294 molecules1 Lavenders: 30 species, 600 GC-MS runs, 137 clusters=194 molecules Both datasets contained ≈ 14 000 peaks.
1 molecule in two different columns (polar/apolar)
Rapid/Efficient Open source Do not write papers for you but save you time !
Metabolomic 2010 congress Amsterdam 27 june – 1st july Bibliography: 1-Courtois, E., C. Paine, et al. (2009). "Diversity of the Volatile Organic Compounds Emitted by 55 Species of Tropical Trees: a Survey in French Guiana." Journal of Chemical Ecology 35(11): 1349-1362. 2-Rousseeuw, P. J. (1987). "Silhouettes: a graphical aid to the interpretation and validation of cluster analysis." Journal of computational and applied mathematics 20(1): 53-65.