Special Article
Mythologies, Metro Rail Systems and Future Urban Transport Dinesh Mohan
There is still no clear vision among planners, policymakers and transport experts about what will make Indian cities better places to live in as far as mobility and access are concerned. The prevailing mythology is that construction of metro rail systems will somehow solve the problems of the future. A review of urban mass transport systems over the past century shows that metro systems were the obvious choice when relatively inexpensive cars and two-wheelers were not available. With the introduction of efficient buses, computer and information technologies to manage large fleets, and the need to have flexible, medium capacity systems that go close to homes and destinations, bus rapid transit systems with dedicated lanes seem to be the only choice for providing affordable mass transport in our cities.
C
onsider the following statements on urban transport:
A comprehensive bus system – which would help remove thousands of cars from the streets – can be set up for the same cost as constructing a flyover, which often only serves to shift a traffic jam from one point to another… It is crucial to give due consideration to the magnitude of a project in order to avoid the risk of presenting “show-case” solutions which are conceived for the media and only benefit a minority of the inhabitants [Lerner 1996].1 Unfortunately sometimes rail systems are also chosen for the worst possible reasons… Rail system salesmen are legendary for the procedures they utilise for selling their expensive wares…bus systems are more flexible, an important asset in developing countries’ dynamic cities. As a city attraction centre shifts, it is easier to adjust a bus system than a rail one [Penalosa 2004].2 A sustainable city is one that wastes the least and conserves the maximum. Most importantly, it means making the existing system of people and resources work better – rather than throwing it away and trying to replace it with a single, capital-intensive project such as a subway or a rail-based system [Rabinovitch 1995]. The demand for rail has continued to shrink because transit networks are unable to keep up with changing land use and travel patterns that have decentralised residences and employment...Unfortunately, transit systems have been able to evolve because their supporters have sold them as an antidote to the social costs associated with automobile travel, in spite of strong evidence to the contrary. As long as rail transit continues to be erroneously viewed in this way by the public, it will continue to be an increasing drain on social welfare [Winston and Maheshri 2007].
The above comments come from a wide spectrum of international experts, planners and politicians covering a period of more than a decade. Now examine the recent statements on need for metro rail projects for Indian cities from policymakers in India:
Dinesh Mohan (
[email protected]) is at the Transport Research and Injury Prevention Programme and the WHO Collaborating Centre at the Indian Institute of Technology, Delhi. Economic & Political Weekly january 26, 2008
A rail based metro system is inescapable…World-over the practice is that when the population of a city reaches 1 million mark, the studies and investigations needed for a metro system are taken up [Sreedharan 2004]. Punjab took a vital step towards the Mass Rapid Transit System (MRTS) era on Tuesday with the state government inking a Memorandum of Understanding (MoU)… Similar rail systems would be set up at Amritsar and Mohali, steps for which are being taken on a priority basis… Speaking on the occasion, chief minister Parkash Singh Badal described it as a historic event which would completely revolutionise the development scenario in the state.3 The Bangalore metro comes with a package deal. Comfortable, quick, safer and economical, its energy requirement per passenger km is only one-fifth of that of road-based systems. Commuters can breathe easy, there will be no air pollution as the system runs on electric power. The economic rate of return is 22.3 per cent.4 The city is all set to have a metro rail of international standards to meet the increasing traffic congestion. The Andhra Pradesh cabinet today approved the Rs 8,760 crore Hyderabad metro rail project covering 66 km and involving the construction of 63 stations.5
41
Special Article
Why are Indian policymakers out of sync with international expert opinion on the choice of urban transport technologies and policies? Are Indian cities completely different from the rest of the world? Or, are the Indian experts oblivious of international developments in urban transport theory and practice? Is it possible that metro rail projects are in favour because they are extremely capital intensive and suit most policymakers and contractors? Finally, even if all these explanations are partially valid, will urban metro rail projects help provide public transport at affordable prices, reduce congestion on roads, and reduce pollution and road traffic injuries and deaths? In this article we trace the history of urban transport systems, successes and failures around the world, and the lessons thereof. We also describe the attributes of surface public transport systems (bus, light rail, tram) and grade separated systems (metro rail, skybus, monorail, light rail) and their suitability for 21st century cities. Finally, we comment on urban forms and other issues that affect accessibility and mobility in modern urban areas.
1 History, Technology and Urban Transportation Urban transport can be roughly divided into the following periods: • Pre-1850: Pre-mechanisation era. Travel speeds (walking) about five km per hour. This limited city diameter to less than five km and influenced city form as the rich and the poor travelled at similar speeds. • 1850-1920: Steam engine/rail/tram/bicycle era. Rail-based transport is the first mechanised form to appear in the mid-19th century, the bicycle in its present form at the end of the 19th century and the commercial motor car soon after. Before the perfection of the pneumatic tyre and improvements in road building technology, large vehicles had to run on rails and so public transport was completely rail based. In the last two decades of this period the bicycle and the car appear as personal modes of transport for mainly the upper middle and rich classes. Average speeds go up to 10-15 km/h, city form decided by existence of rail tracks, and city size increases to about 10 km in diameter. • 1920-50: Metro-bus-car era. The diesel engine, good pneumatic tyres (making possible large buses) and mass produced cars become available in the first two decades of this period and change transport modes especially in the United States (US). Average urban speeds increase to about 30 km/h, buses start replacing rail-based trams and metro goes mainly underground. Bicycles as personal mode starts reducing. • Post-1950: Car era. In this period cars become the dominant mode of travel in all rich country cities and for the upper-middle class everywhere. Underground metro systems also expand, but mainly in rich cities. Buses and para-transit remain the main modes for pubic transport in low income cities. Average car speeds on arterial roads go up to about 50 km/h, but doorto-door speed rarely exceeds 25 km/h. Cities can now be 20-30 km in diameter and form dictated by car travel. Most large cities in high income countries (HIC) grew to their present size between 1850 and 1950. Technological developments were critical in changing the shape and form of the city. Before the invention of the steam engine everyone had to walk, ride
42
horses or horse carriages to get around. This meant speeds around five km/h for the rich and poor alike, and consequently city size was limited to about five km in diameter. Further, the city centre was very important as all important buildings and facilities had to be in the centre and that is where the rich preferred to live. City centres in Europe could be very grandiose as they represented the success of empires and the capital available from the colonies. These city centres developed as central business districts and remain so as the influential sections of society take pride in maintaining and improving these locations. Cities that have grown after 1950 do not have such characteristics and the elite of these cities do not have any particular emotional attachment to the old city centre. Rail-based transport starts in the second-half of the 19th century. The first rail-based metro line was completed in London in 1853, the first elevated railway in New York city in 1868, the first line of the Paris network in 1900, and in Mumbai the first suburban line, between Virar and a station in Bombay Backbay, in the year 1867. At the beginning of the 20th century road surfaces were not very smooth and roads were paved with the same materials and technology used by the Romans: bricks laid on a well-prepared foundation of sand, gravel, and stone [Whitten 1994]. The use of asphalt and bitumen only gets perfected between 1910 and 1930. The pneumatic tyre for large vehicles takes shape after 1930 and so does the heavy duty diesel engine. Therefore, mechanised transport could be comfortable only if vehicles moved on steel rails up to 1920 or so. This is why street trams became very popular as they were more flexible in operation and cheaper to build than underground rail systems. The golden age of the tramway system was the first quarter of the 20th century but starts declining in the 1920s. This was because systems resulting from the initial capital investment were reaching the end of their useful lives and the income from the system was not adequate enough for large investments necessary for renewal [Chant 2002]. This decline was aggravated by the appearance of the mass produced motor car and more efficient buses. The onset of the financial depression in 1929 in the US and Europe followed by the war in 1939 put the trams at great risk and they got replaced by buses (cheaper to introduce and run) in many cities helped along by the lobbying power of vehicle manufacturers. But, underground or elevated rail and surface trains/trams remained the only mode of mechanised transport well into the 1920s for those who could afford it in all large cities of the world. This is when the largest cities expanded to around 10 km in diameter with populations around one to two million. If one lived away from the centre it was essential to live along the rail lines, and all factories and employment centres were built along these tracks. Rail technology decided the shape and form of these 19th century large cities in Europe and the US, also giving a great deal of importance to the central business district (CBD) as it could be fed by these trains. Car ownership started increasing in the 1920s, but most families did not own a car until the middle of the 20th century. By then the essential land use and transportation patterns of large cities in HICs except in the US were well set with large CBDs. This encouraged building of high capacity grade separated metro systems, and in turn, the transport system encouraged densification of CBDs january 26, 2008 Economic & Political Weekly
Special Article
as large numbers of people could be transported to the centre of the city. The non-availability of the car to the middle class decided the widespread use of public transport and city form. However, this period when the bus and roads became comfortable (1920-50), was also the period of great economic and social upheaval and little thought could be given to improving urban transport with innovations in management systems and technology. Car ownership increased much faster in the US and so many cities did not have the political pressure to provide for public transport. Most Indian cities have expanded after 1960 and all have planned for multiple business districts. In addition, in the second half of the 20th century most families did not own a personal vehicle and so all leisure activity revolved within short distances around the home. In the past two decades motorcycle ownership has increased substantially in Indian cities, as a result about 50 per cent of Delhi’s families own a car or a motorcycle at a very low per capita income level of about $ 1,400 per year. Such high levels of private vehicle ownership did not happen until incomes were much higher in HIC cities. Therefore, the high ownership of motorcycles, non-availability of funds to build expensive grade separated metro systems and official plans encouraging multinodal business activity in a city have resulted in the absence of dense high population CBDs and city forms which encourage “sprawl” in the form of relatively dense cities within cities.
1.1 Declining Demand for Public Transportation Most middle class families did not own air-conditioned cars with stereo systems in HICs before 1970. The cars were noisy and occupants were exposed to traffic fumes as windows had to be kept open. Under such conditions, the train was much more comfortable. This created the condition in which there would be a political demand for metro systems that came from the middle class and could not be ignored. On the other hand, brand new, quiet, stereo equipped, air-conditioned cars are being sold in India now at prices as low as $ 5,000 to 6,000, and used ones for quarter the price. This has made it possible for the middle class first time car owner to travel in cars with comfort levels Europeans had not experienced till the late 20th century. Air-conditioned, comfortable, safe and quiet travel in cars with music in hot and tropical climates cannot be matched by public transport. Owners of such vehicles would brave congestion rather than brave the climate on access trips and the jostling in public transport. If public transport has to be made more appealing, it has to come closer to home, reduce walking distances and be very predictable. These conditions would favour high density networks, lower capacity, surface transport systems (to reduce walking distances) with predictable arrival and departure times aided by ITS information systems. Wide ownership of motorised two-wheelers (MTWs) has never been experienced by HIC cities. This is a new phenomenon, especially in Asia. The efficiency of MTWs – ease of parking, high manoeuvrability, ease of overtaking in congested traffic, same speeds as cars and low operating costs make them very popular in spite of MTW travel being very hazardous. Avaialability of MTWs has further reduced the middle class demand for public transport. In addition it has pegged the fare levels that can be Economic & Political Weekly january 26, 2008
charged by public transport operators. It appears that public transport cannot attract these road users who can afford an MTW unless the fare is less than the marginal cost of using a MTW. At current prices this amounts to less than Rs 1 per km. The only option available is to design very cost efficient public transport systems that come close to matching this price. The above discussion shows that Indian cities in the 21st century are growing under very different conditions from those in HICs in the first half of the 20th century. The political and ideological forces combined with changes in technologies will make it difficult to provide efficient transport systems in the old manner. It will also be very difficult to move away from multinodal city structures with future job opportunities developing on the periphery. Higher education and trade obviously have a reasonable amount to do with size of cities and form of urbanisation. The more “educated” we are, the larger the pool of resources we need both for work and human contact. Therefore, a large city becomes essential for a reasonable section of the population for finding “optimal” employment and friends. Inverse of the same issue is that trade and industry needs a large pool to select employees. This forces Indian cities to become larger than HIC cities. This is because for each rich person there is a larger number of poor people to serve her as compared to that in HICs. So, the same number of professionals in an Indian city will coexist with a much larger number of poorer residents than that in a HIC. For the foreseeable future, this will make Indian cities much larger than the “mature” cities of Europe. The existence of a large number of low income people pursuing informal trade and income generating activities places different political pressures on the rulers, increases demand for low cost mobility and short distance access to jobs and trade. This is offset by the middle and upper classes wanting to live away from the poor and form gated communities at the periphery of the city. These developments set up a powerful political demand, aided and abetted by contractors and consultants to provide infrastructure. The upper middle class of the postcolonial nations mainly have the US as a model for the good life. All Asian, African, South American cities are more influenced by the US than any other society. For example, American town planners were sitting in Delhi helping us plan our cities in the 1950s [Breese 1963]. So all these cities have tried hard zoning, broad avenues with highways running through them. If it has not happened it is due to inefficiency and shortage of finances! In the face of all these changes and constraints, the Indian upper class and policymakers still seem to think that just provision of railbased metro systems in our cities will solve all our problems.
2 The Problem Pressures of global warming, rising pollution and road traffic injury rates, and difficulties in moving around in the city are putting pressures on the government to find solutions for “sustainable urban mobility”. In response to such pressures the government of India announced a National Urban Transport Policy [Ministry of Urban Development 2005] and launched the Jawaharlal Nehru Urban Renewal Mission in 2006 for central
43
Special Article
Trips/person/day
assistance in overall development of cities with populations underground or elevated rail (or road) systems have not solved greater than one million [Ministry of Urban Development 2006]. any of the problems of congestion, pollution or of access for a The transport policy clearly states that its objectives would be majority of city residents in any city in the world, especially new achieved by: Figure 2: Effect of Increasing Income on Trip Demand Per Person • Encouraging integrated land use and transport planning in (Trips/person/day) Personal all cities so that travel distances are minimised and access to Business livelihoods, education, and other social needs, especially for Social Social the marginal segments of the urban population is improved. • Bringing about a more equitable allocation of road space Shopping Shopping Shopping with people, rather than vehicles, as its main focus. • Enabling the establishment of quality focused multi-modal public transport systems that are well integrated, providing Education Education Education Education seamless travel across modes. • Encourage greater use of public transport and non-motorised modes by offering central financial assistance for this Work Work Work Work purpose. However, the policy also indicates the confusion prevalent among policymakers and professionals regarding technologies Increase in income needed for public transport by stating that “Given the wide range Increase in income of possibilities, it is not possible to prescribe a particular techno cities. In the next section we review the performance of “metro” logy in a generic policy and such a choice will have to be made as a systems around the world and use these data to understand the part of city specific land use and transport plans. It would also options available to us. depend on the kind of city that would need to evolve at the particular location. The central government would, therefore, encourage 3 Attributes of Urban Transport Systems In this article we use the term “metro” to discuss all rail-based all proven technologies and not promote any specific technology.” One would have thought that after the announcement of the urban transit systems that are largely underground or elevated. above policies, transport planners in all cities would at least have These systems would generally include metro rail transport focused on the issue of bringing about a more equitable allocation systems (MRTS), monorail, elevated or underground light rail. of road space for people, rather than vehicles as its main focus. Not Figure 1 shows the average share of urban public transit systems a single city in India has yet announced a policy of providing safe in different continents [Rodrigue 2005]. It is clear that on the pedestrian or bicycle paths on all main roads in the near future. On whole North America and Australia have been reasonably the other hand, all cities have sent in proposals for widening roads unsuccessful in attracting people to use pubic transport in their and building flyovers, about half a dozen cities have submitted cities. European cities have been somewhat more successful, but it proposals for introducing the Bus Rapid Transit System, but a is the Asian cities that have high use of both public transport and larger number have dreams for building light rail, monorail and non-motorised modes. Besides factors of urban density and land use metro rail systems.6 The Delhi Metro Rail Corporation (DMRC) has patterns that influence mobility patterns [Newman and Kenworthy completed building 65 km of metro 1999], one implication of these Private motor vehicle Transit Walking/cycling Figure 1: Average Model Shares in Cities around the World (in %) rail in Delhi and has got approval for figures is that in general it is not easy 100 100% another 121 km, and the cities of to attract people to public transport Ahmadabad, Bangalore, Chennai, modes when incomes are high. Hyderabad, Ludhiana, Mumbai and 80% 80 3.1 Trip Demand Pune are in various stages of 7 Figure 2 is a conceptual represenplanning/constructing one. There is still no clear vision tation of how transport demand 60% 60 among planners, policymakers and increases with increasing incomes. transport experts about what cities The main point to be noted here is 40% 40 in India need and what will make that only the numbers of work and them better places to live in as far education trips are compulsory in as mobility and access are nature and remain constant with 20% 20 concerned. The prevailing mytho increasing incomes and all the logy is that construction of metro other trip types are flexible and rail systems will somehow solve smaller in number than work trips. problems of the future and remains0% 0 North Therefore, if we segregate work Australia West Europe High Income Low Income China America Asia Asia the single one point agenda of and education trips in time (which Private motor vehicle Transit Walking/cycling almost all transport consultants in is being practised in most Indian Transit figure for low income Asian cities includes para-transit. India. Unfortunately, the fact is that Source: Adapted from Rodrigue 2005. cities), then we need only to plan
44
january 26, 2008 Economic & Political Weekly
Special Article
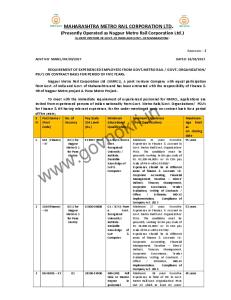
for the peak demand of work trips, as the optional trips would be (a) High-Income Country (HIC) Experience: Figures 4 and 5 undertaken at other times of the day. With appropriate neighbour- (p 47) show the distribution of trips by different modes of transhood school admission policies and provision of safe walking and port in the metropolitan areas of large cities in high-income bicycle facilities much of the demand for education trips can be countries [Cerin, Macfarlane, Ko and Chan 2007; Kawabata and converted non-mechanised modes. This is an important issue as Shen 2006; McGuckin and Srinivasan 2003; Morichi 2005; Statisall transportation and city development plans prepared by consult- tics Singapore 2006; Transport Department 2007; Transport for ants in India have justified provision of wider roads and very high London 2006; WBCSD 2004]. capacity transport systems on major corridors of a city based on Table 1 shows the modal shares by different modes of transport linear projections of ever increasing total trips per capita.8 in medium sized cities (population generally less than one million Though the number of work trips does not increase with rising persons) in Europe [Commission for Integrated Transport UK incomes or increasing population, the total number of trips per 2001]. corridor can increase with expansion in city size, but this can be These data show the tremendous variation in car use and moderated by transport demand management, change in modal public transport use at similar levels of income. In most large shares and, therefore, it is not advisable to Figure 3: Door-to-Door Trip Times by Various Modes of Transport for Different Travel Distances increase urban road widths beyond 40-45 m. (Time, minutes) Very wide roads inside a city disrupt social 30 40 structures and community relationships, especially among children and the elderly 25 30 [Dora 1999, 2007]. 20
3.2 Door-to-Door Trip Time
15
20
Figure 3 shows door to door travel times for different trip distances. Bus travel times are 10 10 for bus rapid transit (BRT) systems where buses 5 ply on dedicated lanes undisturbed by other traffic. The data shows that: (a) Travel by car 0 0 Metro BRT Car Bicycle Metro BRT Car Bicycle Walk or motorcycle will always give the least travel (b) 6 km trip (a) 3 km trip time compared to all other modes unless 100 there is congestion on the road. (b) Travel by 60 any rail system (metro) that is underground 80 or elevated has a minimum door-to-door trip 50 time of about 20 minutes. Walking is faster 40 than using the metro for distances of one to 60 two km, and bicycling is faster for distances 30 three to four km. (c) BRT gives lower travel 40 times than the metro for distances less than 20 about six k m. (d) The metro only becomes 20 efficient for trip distances greater than 12 k m, 10 and (e) If you introduce one change or one 0 0 Metro BRT Car feeder trip for a metro trip, then travel by Metro BRT Car (a) 12 km trip (b) 24 km trip metro takes more time than by car or motor Walking to station/veh Walking in station Waiting at station Journey in vehicle cycle for trips less than 12 km even if there is Walking to destination Congestion (car) One change congestion on the road. (1) Metro: A generic term used for all underground or elevated mass transport systems including MRTS, light rail, monorail and skybus. These numbers make it quite clear that BRT: Bus Rapid transit, bus system running on surface dedicated bus lanes. Car: Term includes motorcycles. (2) Assumptions: (i) Walking speed: 6 km/h; Bicycle speed: 12 km/h; Average Metro speed: 35 km/h; Average BRT speed: 25 km/h; Average Car speed: elevated and underground public transport 30 km/h without congestion, 15 km/h with congestion. (ii) Average time taken from origin to BRT/Metro station and to destination: 5 minutes (500 m) systems do not provide time saving compared (iii) Average time spent walking inside metro stations: 4 minutes (iv) Average time spent waiting for train/bus: 3 minutes (v) Congestion: Extra time in car if there is congestion (vi) One change: Extra time taken for changing routes once on BRT/Metro or taking one feeder bus to metro: 8 minutes to car or motorcycle use unless there is spent (shown only for trips > 3km). congestion on the road or the trip is very long. Because of the time lost on escalators and long walking distances cities in HICs car use remains high besides exceptions of Hong inside underground/elevated metro and monorail stations, the Kong and Tokyo. The needs are greatly influenced by urban use of BRT on dedicated lanes becomes more efficient for trips less form and infrastructure policies. Hong Kong and Tokyo both have very dense and congested central business districts and than about 10-15 km. restrictions on parking [Newman and Kenworthy 1999]. Tokyo 3.3 Modal Share and Trip Length is the only one among large urban conglomerations of the world This section discusses the patterns in modal share and trip length where metro/rail transport captures more than 30 per cent of in high- and low-income countries. daily trips. Generally this share remains around 20 per cent Economic & Political Weekly january 26, 2008
45
Special Article
even though some of these cities have extensive regional metro/ rail networks: London – 1,140 km, New York – 550 km, Tokyo – 612 km, Singapore – 138 km, Hong Kong – 259 km, Paris – 798 k m. Hong Kong is the only urban conglomeration where public transport accounts for a majority of the trips. This is probably because of the dense land use pattern of the city, relative Figure 4: Distribution of Trips by Different Modes of Transport in Large Cities in High Incomeshare Countries (% share) Percent 100% 100 80% 80 60% 60 40% 40
41
20% 20
17 0%
20
25
29
0 London London New York Tokyo Singapore Hong Kong* New York Tokyo Singapore Hong Kong * Metro + Rail Bus Car + MTW NMT Metro + Rail Bus Car + MTW NMT (1) All figures are for city metropolitan areas. (2) MTW: Motorised two-wheelers, NMT: Non-motorised transport – walking and bicycling. (3) * Figures for Hong Kong adapted by including 15% share for NMT. (4) Source: Adapted from Cerin, Macfarlane, Ko and Chan 2007;Kawabata and Shen 2006;McGuckin and Srinivasan 2003;Morichi 2005;Statistics Singapore 2006;Transport Department 2007;Transport for London 2006.
unavailability of car parking space and the limits to expansion until recently. The Hong Kong experience is unlikely to be repeated in any other city. What is interesting in these cities is that except greater New York, walking plus bus use is high in all the other cities. Figure 5 shows that public transport use is more than 60 per cent only in central Paris and less than 20 per cent for travel within areas outside. Public transport is preferred only when travelling to the central part of Paris, which has severe congestion on roads and limitations on parking space. All other cities record similar data. It is only in central Tokyo, New York, and Singapore, that public transport use exceeds 60 per cent. All medium sized cities of Europe have pubic transport use less than 30 per cent except Leeds which manages 36 per cent (Table 1, p 47). But, Leeds has a very high car and MTW use of 61 per cent. These data show that car use can remain high even with provision of public transport (e g, Edinburgh and Leeds). However, car use is low in Amsterdam and Stuttgart where the share of walking and cycling is higher than public transport. The experience of cities in HICs shows that just the provision of metro systems is not a sufficient condition for controlling car use. The empirical data from both large and medium cities suggests that car use does not seem to reduce when walking, bicycling and bus use is low. This points to the importance of urban design and land use patterns which make it easier for people to walk/bicycle safely and have easily accessible public transport stations. (b) Low and Middle Income Country (LMIC) Experience: Table 2 (p 47) shows the modal shares of large cities in LMICs. It is not easy to obtain data that are strictly comparable as many studies do not account for walk and bicycle trips accurately.
46
Sometimes data for trains and buses are not available separately. The data in Table 2 have been put together from different sources which have not used exactly the same definitions [Baker, Basu, Cropper, Lall and Takeuchi 2005; de la Torre 2003;de Villa and Westfall 2001; Hidalgo 2004; Roth 2000; Tiwari 2002b; Urban Age 2007; World Business Council for Sustainable Development 2001]. However, they are good enough for detecting broad trends and patterns. These data from LMIC show car use is low in all cities. Use of private modes of transport is relatively high only in those cities where motorcycles use is higher than car use. Hanoi is a special case as bus and para-transit services are almost non-existent and motorcycles are relatively inexpensive [JBIC 1999]. When walking and bicycling trips are measured they constitute about a third or more of the trips in most cities. A study from Bangkok (noted for its traffic jams) also shows that about 30 per cent people use non-motorised modes for getting to work [Ross, Poungsomlee, Punpuing and Archavanitkul 2000]. No city has significant use of rail based transport except in the case of Mumbai. Manila, Delhi, Shanghai and Mexico City have metro networks of about 48, 60, 148 and 201 kms respectively, but account for only 2, 2, 4 and 14 per cent of the local commuter trips. The case of Mexico City which has the largest metro network of 201 km is interesting. Though the fare charged in Mexico city is one of the lowest in the world, it carries only 14 per cent of trips and the share has reduced over time as the share of mini-buses and collectivos has increased. Among low and middle income cities the case of Mumbai seems to be a unique one where rail trips account for 23 per cent of commuter share. This is probably because the rail system in Mumbai is over a century old and the older part of the city developed along these rail lines when personal modes of transport were not affordable. This experience is not likely to be repeated in any modern large city. Table 3 (p 47) shows the distribution of length of trips in Mumbai and Delhi [Baker, Basu, Cropper, Lall and Takeuchi 2005; RITES 1998]. These data show that in spite of the greater metropolitan areas of these mega cities having populations in excess of 15 million and city diametres over 15 km, a majority of the trip lengths remain below five km and only about 20 per cent of them are greater than Figure 5: Trips by Mode in Paris Region Second Ring
First Ring C 75% PT 25%
C 69% PT 31%
Central Paris
C 42% PT 58%
C 35% PT 65%
C 78% PT 22%
C 90% PT 10% (1) C = Car and MTW, PT = Public transport (2) Source: Adapted from WBCSD 2004.
january 26, 2008 Economic & Political Weekly
Special Article
10 km if walk trips are taken into account. An analysis of trip times Provision of public transport facilities alone is not sufficient to for Delhi shows that 26 per cent of the trips by bus take less than 30 ensure low use of personal modes. Provision of efficient and minutes and another 23 per cent take 30 to Table 1: Modal Share of Trips by Different Modes widespread bus transport systems seems to 45 minutes [RITES 2005b]. The former trips of Transport in Medium Sized Cities in Europe be essential for significant transport use, even are likely to be less than three km and the Modal Share (in %) for the use of metro systems. For example, in City Car + MTW PT W&C latter three to six km in length. The same Singapore 25 per cent of the commuters use Bristol, UK 65 12 23 study shows that 60 per cent of the car trips the metro systems but 60 per cent of them Leeds, UK 61 36 3 took less than 30 minutes.9 These data clearly Nantes, France combine it with a bus trip [Statistics Singa58 14 28 show that even in very large cities in India a Helsinki, Finland pore 2006]. 54 20 26 vast majority of trips remain less than 10 km Marseille, France Cities in LMIC that have grown after the 53 12 35 in spite of large city size. This is likely to be Edinburgh, UK 1950s seem to be different in character with 52 29 19 48 19 33 true for many of the other cities mentioned in Newcastle, UK multiple business districts, mixed land use Brussels, Belgium 44 18 38 Table 3 also as all of them have significant (largely by default, illegally), relatively short Frankfurt, Germany 42 21 37 proportion of non-motorised and bus trips. trip distances and large share of walking 36 25 39 These data point to the fact that large cities Stuttgart, Germany and public transport, even if the latter is not 32 16 52 in LMICs may have different travel patterns in Amsterdam, Neth's provided by the city authorities.11 Car share MTW – motorised two-wheeler, PT – Public transport. W&C – Walking and cycling. remains below 20 per cent even at per capita terms of trip lengths than those in HICs as a Source: Adapted from Commission for Integrated Transport UK 2001. incomes of $ 6,000-8,000 (Bogota, Mexico majority of the people do not own cars. This is supported by studies form Europe which show that trip length City). This is an important point to note as Indian incomes are not increases significantly only when people are able to own cars and likely to reach these levels in the next 20 years. It is also clear that travel at high speeds or use long distance commuter trains as time no city in LMIC has been able build a metro system that attracts a majority of public transport passengers. This is partly because no budgets remain relatively constant [Knoflacher 2007a]. It seems that a majority of people in LMIC cities chose to live city that has grown after 1950 has large and dense central closer to work as they do not have the option to travel at high business districts. All large Indian cities are growing around the speeds. This would mean that these large cities function as cities periphery and will not have dense centres in the future. In the next section we review the performance of rail based within cities and the effect of sprawl is different in character from the sprawl of HIC cities and we should be careful when evaluating grade separated (elevated or under- Table 3: Trip Length Percentage Distribution in Mumbai and Delhi transportation policy literature form HIC cities. If large Indian cities ground) metro systems to under Trip Length Mumbai Delhi have high density living in spite of the sprawl compared to western stand why their presence in growing (km) 57 cities [Urban Age 2007] and trip lengths are relatively short, then it low and middle income cities has not 0-3 } 40 12 becomes an ideal case to plan for walking and bicycling facilities been as successful as in the large 3-5 5-10 12 35 cities of some lmIC. for the healthy and efficient bus transport systems.10 10-15 8 The data presented above shows us that contrary to the } 25 > 15 11 widespread perception of most urban policymakers and planners, 4 Metro Rail Performance Source: Adapted from Baker, Basu, Cropper, rail based metro transportation systems play a limited role in Metro systems in India have been Lall and Takeuchi 2005; RITES 1998. most large cities of the world except Tokyo. The cities where justified on the basis of the following criteria [Sreedharan 2004]: metro systems have a wide network and are successful in attract- • Need to be in place when city size exceeds three million population. ing a significant proportion of commuter trips are those where the system was initiated in the first half of the 20th century and • Very high carrying capacity of 40,000-60,000 persons per hour per direction (pphpd). have very dense and large central business districts [Cox 2004; • Reduction in time of travel, per TCRP 1996]. This is probably because the Table 2: Modal Share of Trips by Different Modes of Transport in Cities in Low and Middle Income Countries sonal transport use, traffic congestion, only form of mechanised transport the City Modal Share (in %) pollution, road traffic crashes, and buses middle class commuters could afford had Walk + Car + Bus Paratransit Metro/ Bicycle MTW + Taxi Rail on the road. to be public transport. Technological 18 35* 41 6 • Increase in social welfare. choices were limited before the 1940s Bangalore, India Bogota, Colombia 13 11 73 3 and the only system available had to be Delhi, India 37 18* 40 3 2 4.1 City Size, Income and Metro rail based. Therefore, workplaces and Hanoi, Vietnam 32 60* 8 Performance homes had to be along these lines which Johannesburg, S Africa 33 33 5 24 5 One of the main justifications for introfed city centres and the large cities of the Lahore, Pakistan 37 35* 14 14 0 duction of metro systems is that all large early 20th century had little choice but to Manila, Philippines@ - 21 24 53 2 cities need a grade separated metro take these forms. Mexico City, Mexico@ - 20 61 5 14 system as there is enough demand for Another characteristic common to most Mumbai, India 47 11 16 3 23 54 14 28 - 4 transporting more than 40,000 passenlarge and mid-sized cities is that use of Shanghai, China – motorised two-wheeler, * Majority MTW, gers in one hour per direction during personal modes is low only in those cities MTW @ Walk and bicycle not included. where the combined share of walking, Source: Baker, Basu, Cropper, Lall and Takeuchi 2005; de la Torre 2003; de Villa and peak time. The web site of the Delhi Westfall 2001; Hidalgo 2004; Roth 2000; Tiwari 2002; Urban Age 2007; Metro Rail Corporation states: “It has bicycling and public transport trips is high. World Business Council for Sustainable Development 2001. Economic & Political Weekly january 26, 2008
47
Special Article
been observed that in developed countries, planning for mass not have any strong relationship with metro productivity levels transit system starts when city population size exceeds one (Figure 6c) and some low income cities have higher rates than high million; the system is in position by the time the city popula- income cities and vice versa. It is often argued that as the system tion is two to three million and once the population exceeds length increases ridership levels will improve. Figure 6e gives no four million or so, planned extensions to the Mass Rapid Transit evidence for this. Shanghai (228 km) has less than half the tppdpk Systems is vigorously taken up… The city of Delhi with a popula- than both Mexico City with a large system (202 km) and Beijing tion of round 16.2 million should have had an MRTS network of at with a small system (96 km). It is also likely that tppdpk producti least 300 km by this time”.12 vity decreases as the system expands because it starts covering less The original feasibility study for developing a metro system for dense corridors. In Figure 6 (b,d,f) we also examine BRT tppdpk Delhi justified the economic feasibil- Table 4: Performance of Metro, Light Rail and Bus Rapid Transit productivity levels. For the cities ity of the system projecting a daily Systems in Low and Middle Income Cities examined BRT systems seem to Population Country Type Passen- Length Passenridership of 3.1 million passengers by City compete well with metro systems with (million) Per Capita gers/Day (km) gers Per Income (million) km Per Day 2005 [RITES 1995]. This was later levels of productivity similar to the ($ Per Year) Thousand reduced to a projected demand of 2.18 Mexico City, Mexico 18 best rail systems. Population size, per 6,760 MRT 3.90 202 19.31 million passengers to be transported Shanghai, China capita income, and length of the BRT 18 1,500 MRT 1.80 228 7.89 per day on the first three corridors Kolkata system seem to have little effect on 16 620 MRT 0.16 17 9.41 (65.8 km) when completed in Decem- Delhi productivity. This means that BRT 15 620 MRT 0.60 65 9.23 12 3,750 MRT 0.42 28 15.00 ber 2005 [Sreedharan 2003], and Istanbul, Turkey systems are more likely to have 12 1,500 MRT 2.10 96 21.88 then in 2005 further reduced to 1.5 Beijing, China success than rail systems on any 3,000 MRT 0.50 45 11.11 million a day.13 The system is actually Rio de Janeiro, Brazil 11 heavily travelled route in any city. 10 1,170 MRT 0.40 29 13.79 operating at around 0.6 million Manila, Philippines Figure 7 (p 50) shows all the 9 2,490 MRT 0.58 44 13.18 passengers per day at the end of 2007, Bangkok productivity (tppdpk) of metro Santiago, Chile 6 5,220 MRT 0.57 60 9.50 less than 20 per cent of projected systems in all cities with MRT in Table Kuala Lumpur, Malaysia 5 4,520 LRT 0.17 55 3.09 capacity. Similarly, the Kolkata metro 4 and also New York and London. This Medellin, Colombia 4 2,020 LRT 0.29 29 10.00 is operating at about 10 per cent Guadalajara again shows a wide scatter and just 4 6,760 LRT 0.13 24 5.42 projected capacity [Singh 2002]. high density is not enough to project Tunis, Tunisia 2 2,650 LRT 0.40 32 12.50 The first few metro corridors are Mexico City, Mexico 18 metro use with certainty. What is of 6,760 BRT 0.28 20 14.21 always selected to be on the most Sao Paulo, Brazil note is that even in the very large HIC 16 3,000 BRT 0.80 78 10.26 8 2,020 BRT 0.79 42 18.81 heavily travelled stretches in a city, Bogota, Colombia cities the metro share of commuters is 3 3,000 BRT 2.43 122 19.92 and so it should be surprising that the Curitiba, Brazil less than 30 per cent except in Tokyo. 2 2,210 BRT 0.38 36 10.50 Indian metros are operating at such Quito, Equador In any case Tokyo and Hong Kong are MRT: Metro, LMRT: Light Rail, BRT: Bus Rapid Transit. low levels. There are very few cities in Source: Data from Cox 2001; Bus Rapid Transit Policy Centre 2007; World Bank 2006; exceptions, where urban rail producLMICs that have metro systems. UrbanRail.Net 2007; official web sites of metro systems; official web sites of BRT systems. tivity (passengers carried per km of Table 4 summarises the experience of metro (and light rail) and rail) is around 27,000 passengers per day per km [Cox 2001]. In bus rapid transit use in LMIC cities [Cox 2001; Bus Rapid Transit almost all other cities in LMIC this number is less than 40 per cent Policy Centre 2007; World Bank 2006; UrbanRail.Net 2007]. of that in Tokyo. For example, London, Paris and New York metros Most LMIC cities have small systems and the largest systems are operate at less than half the productivity of Tokyo, and all other much smaller than those in the cities included in Figure 4. Metro cities at even lower factors. Light rail productivity factors are genersystems in LMIC cities are operating between 10,000 to 20,000 ally less than one-tenth that of Tokyo in almost all cities. passengers per day per route km (tppdpk) with Mexico City and Table 1 also shows that medium sized HIC cities have very low Beijing having the highest rates (around 20,000 tppdpk). Mexico public transport use (which includes bus use). In the largest City has the oldest (30 years), the most extensive (202 km) and metro networks of around 200 km in Mexico City and Shanghai, the cheapest system. Table 4 also shows the experience of cities the metro system accounts for less than 15 per cent of motorised with light rail systems (monorail included) and all of them have trips, and if walk and bicycle trips are Table 5: CO2 Emissions by Mode very low rates. included it could be less than 10 per of Travel (in gram/passenger km) Emissions In Figure 6 (a-f, p 49) we examine the influence of city popula- cent. It appears that metro systems in Mode Car Petrol 186 tion, per capita income and total transit length on the systems’ LMIC mega cities are not likely to be Diesel 141 productivity in terms of tppdpk. Figure 6 a shows that even in large very successful in attracting even a Hybrid 125 cities (> 8 million) there is large scatter and no strong relationship significant proportion of the total Bus 56 with size of the population. The rail systems are operating with an number of commuter trips and the Metro 107 average productivity of 11.5 tppdpk. This should be examined in possibility of the same is even lower. Source: Bannister 2005. light of the fact that the projection for phase I of the Delhi metro for Therefore, it is not surprising that the 2005 was 33.5 tppdpk and the projection for 2011 at the end of projected ridership of 34,000 passengers per day per km of the phase II is 16.1 tppdpk. Large city size does not ensure high produc- metro in Delhi did not come true as there is no empirical evidence tivity as Shanghai has half the productivity level as Mexico City at for such high ridership values anywhere in the world. The Delhi similar large populations (18 m). Similarly, per capita income does metro system is expected to complete 186 km of rail lines in 2011
48
january 26, 2008 Economic & Political Weekly
Special Article
and have projected a ridership of 3 million passengers per day. If we take the most successful example of Mexico City then this is likely to come true, but at present Delhi rates (which also reflect the average experience of cities around the world) then the ridership is likely to be less than half that projected. This means that at the end of Phase II of the Delhi metro project it is likely to account for much less than 10 per cent of all trips.
Economic & Political Weekly january 26, 2008
tppdpk
tppdpk tppdpk
tppdpk
tppdpk
tppdpk
Bank found that typical at-grade LRT throughputs were about 4,000-6,000 passengers per hour compared to busway average of 15,000 and there were no known LRT’s operating at-grade which approach the passenger carrying capacity of the existing Curitiba, Quito or Bogota busways. Various studies suggest that rail-based systems are no longer suitable for cities which do not have very dense and large central business districts. Cox in Figure 6: Productivity of Metro (Including Light Rail) and Bus Rapid Systems in Low and Middle Income Cities his review of rail-based (a) Metro productivity vs city population (b) BRT productivity vs city population 25 systems around the 25 world summarises than “Exceedingly large 15 central business districts 15 are necessary to serve metro rail systems. For 5 example, Tokyo, New 5 5 10 15 20 0 York, Paris and London 5 10 15 20 Population, million Population, million have central business (c) Metro productivity vs per capita income districts with more than 25 (d) BRT productivity vs per capita income 7,50,000 jobs. Virtually 25 no other urbanised area in the developed world 15 has a central business 15 district with more than 5 4,00,000 jobs” [Cox 2004]. An international 5 0 2,000 4,000 6,000 8,000 2,000 4,000 6,000 8,000 review of rail systems Per capita income $/year (country) Per capita income $/year (country) conducted for the US (e) Metro productivity vs system length 25 (f) BRT productivity vs system length government also 25 concludes that “Central business districts have 15 traditionally been the 15 foci of transit systems and have the highest 5 mode shares…While job 5 0 50 100 150 decentralisation, either 100 200 300 Total length, km Total length, km in polycentric regions or (1) Productivity measured as thousands of passengers carried per day per km of system (tppdpk). (2) Y axis on all graphs is productivity (tppdpk). in dispersed patterns, (3) Sources: Cox 2001; The Bus Rapid Transit Policy Centre 2007; The World Bank 2006; UrbanRail.Net 2007; official web sites of metro systems; official web sites of BRT systems. results in less use of Many other studies of rail systems in LMIC cities come to similar transit for all trip purposes” [Daniels 1972, 1981]. conclusions. A study of rail systems in HIC cities concludes that Since all cities in India have weak central business districts, “There are now some signs of a shift from light rail to bus-based are expanding in a radial mode and all new businesses and systems…There is evidence from the literature that expenditure residential developments are being located on the periphery, this on new rail-based schemes can divert resources away from bus has very important implications for us. Taken together with all routes used by low-income people with no alternative mecha- the other evidence discussed above, it is clear that none of the nised mode of travel… To sum up, it seems that the impacts of new grade separated rail systems (metro, light rail or mono rail) many of the new urban public transport systems (rail based) are will contribute to transporting a significant number of commuters much smaller than those anticipated by those promoting them” in Indian cities in the future. [Mackett and Edwards 1998]. Another study of LMIC cities states “It is difficult to justify the use of rail-based mass transit for most 4.2 Metro Rail, Congestion and Social Welfare cities in the developing world…Conversely, the bus-way system This section discusses issues relating to congestion, pollution offers unrivalled performance and value for money. The fact that and social welfare. recent experience has seen a strong and growing demand for metros and LRT suggests that the influence of intangible factors is Congestion: Congestion reduction is one of the most often used as strong, if not more so, than the technical evidence” [Fouracre, justifications for underground or elevated rail systems. However, Dunkerley and Gardner 2003]. Another study done for the World most other studies also support the findings of Winston and
49
Special Article
Pass/day/km, thousand
Maheshri. Mackett and Edwards [1998] conducted a worldwide survey to investigate the decision-making process involving the selection of the most appropriate technology for an urban transport system and found that the benefits of new urban public transport systems are much smaller than those anticipated by those promoting them. In most systems some or most of the funding comes from the central government and this causes a problem because the local government does not have to bear the risk when the benefits do not occur in reality to the extent assumed. Even worse, there is evidence from the literature that expenditure on new rail-based schemes can divert resources away from bus routes used by low-income people with no alternative mechanised mode of travel. This has been found true even for light rail projects, “The Figure 7: Productivity of Metros in Low and Middle justification for Income Cities with Different Population Densities such high quality 25 systems is usually in terms of their 15 positive image and their role in reduc5 10 20 30 ing road congestion Population density, persons/sqkm, thousand and stimulating development. Neither of these effects have been substantiated… Hence there is a need to consider lower cost alternatives, for example, bus-based systems” [Edwards and Mackett 1996].
road traffic does not ultimately get affected by metro systems neither would road traffic crash rates.
Greenhouse Gases Ever since the emergence of a scientific consensus on global warming issues, concern about carbon dioxide (CO2) and other greenhouse gases has taken centre stage [IPCC 2007]. Transportation is a major source of greenhouse gas emissions and the most rapidly growing anthropogenic source and needs to be controlled. Table 5 (p 48) gives estimates of CO2 emissions per passenger km by mode of travel [Bannister 2005]. Figure 8 shows estimates of CO2 emissions for Taipei (Taiwan) for different urban trans portation options and also shows much better performance of BRT compared to non-BRT systems [Chang 2007]. Metro CO2 emissions turn out to be almost double (for coal, diesel or gas power plants) than for bus because of extra efficiency loss at the power plant and transmission losses [Kågeson 2001]. This is why BRT systems are being favoured over metro and personal transport in urban areas [Christopher Zegras 2007; Vincent and Jerram 2006].
Social Welfare
One of the most detailed analyses of welfare benefits from metro rail systems has come from the Brookings Institute in Washington DC [Winston and Maheshri 2007]. The authors have used rail transit demand and cost models to estimate users’ benefits and Pollution: It stands to reason that if congestion is not relieved agencies’ budget deficits and also account for rail’s effect on the by metro systems then, neither would pollution. Because, if road cost of roadway congestion, safety, real estate prices, etc. They space and the number of vehicles remain the same, then pollution conclude that metro rail systems in the US have failed to provide cannot decrease. This has been supported by many studies and overall welfare benefits and, “because no policy option exists the general conclusion is that there is no significant reduction in that would enhance the social desirability of most urban rail city pollution with the introduction of metro systems and they transit systems, policymakers only can be advised to limit the have not done anything significant in terms of addressing the social costs of rail systems by curtailing their expansion”. Their problems caused by the car [Mackett and Babalik Sutcliffe 2003]. analysis does not detect economic benefits in terms of reducing This is because existing road space is always filled by vehicles congestion, air pollution or accidents. They also find that energy over time and congestion does not reduce either by increasing costs of building a metro system are so high (128 million litres road space or with introduction of metro systems [Mogridge of petrol for one line in Portland, Oregon) that it “would take a 1997; Stopher 2004] but public officials cynically use congestion minimum of 15 years to even begin to achieve energy savings”. as a rationale for funding of high-profile public transit projects In regard to commercial development, “case studies have yet [Taylor 2004]. The latest report from the Texas Transportation to show that after their construction transit systems have had a Institute shows that in the past 25 years congestion has increased significant effect on employment or land use close to stations and in every single urban area in the US in spite of all investments in that such benefits greatly exceed the benefits from commercial development that would have occurred elsewhere in the absence transit and road construction [Schrank and Lomax 2007]. The main reason for the failure of metro systems in reducing of rail construction”. Other studies indicate that elevated metro systems can have negative effects on congestion or pollution is that they Figure 8: CO Production in Taipei for Different 2 residential housing prices due to noise increase transport supply to their area of Transport Options (in ‘000 tonnes/day) 2500025 and other benefits tend to be less in high operation (in addition to the road system) income housing areas [Brons, Nijkamp, by being underground or elevated. If there Elevated Expressway 22500 Pels, and Rietveld 2003; Debrezion, is a temporary decongestion of the road Pels, and Rietveld 2004; Nelson 1992]. that is quickly filled up by latent and Metro 2000020 The literature on the effects of railway induced demand [Cervero 2002; Noland stations on property value is mixed, 2001]. The only example of reducing BRT ranging from a negative to an insignificongestion in the central area of a large 17500 cant or a positive impact and commercial city comes from London where congestion properties enjoy a higher positive impact pricing has been introduced [Santos and 1500015 2005 2010 2015 2020 2025 2005Chang 2007.2010 2015 2020 2025 compared to residential properties. Shaffer 2004]. It stands to reason that if Source:
50
january 26, 2008 Economic & Political Weekly
Special Article
The Delhi Metro The experience of the Delhi metro substantiates all of the above observations in terms of low ridership rates, and no positive welfare in terms of actual reductions in pollution, road traffic crashes or congestion. However, studies claiming welfare benefits are based on notional time and energy savings [Murty, Dhavala, Ghosh, and Singh 2006; RITES 2005a]. These studies calculate environmental benefits based on the theoretical reduction of motor vehicles and not the actual experience. They also do not take into account any increase in motor vehicles or trips due to induced and latent demand.14 Time savings are calculated on the basis of only the train trip and not door-to-door time. There are generally no door-to-door time savings by metro unless the trips are greater than 12 km as shown in Figure 4. This is mainly because access and egress times for underground or elevated systems can average more than 20 minutes [Krygsman, Dijst, and Arentze 2004]. Actually, pollution in Delhi has increased over the past three years [CSE 2007] especially NOx and respiratory particle matter. The number of vehicles and road traffic crashes also increased by about 20 per cent [Delhi Traffic Police 2007]. Traffic monitoring on the metro corridors shows that the number of motor vehicles increased and the number of buses remained constant over the past three years [Tiwari 2007]. Metro authorities projected a decrease in buses but there has been none, and now extra feeder buses are being added to the fleet by them to bring passengers to the metro stations. Exaggerating benefits and underestimating costs are not confined to the Indian experience. A study of more than 210 transportation infrastructure projects worldwide demonstrates that cost underestimation and exaggeration of benefits (both by an average factor of two) are common, especially for rail projects [Flyvbjerg, Holm and Buhl 2002; Flyvbjerg, Holm, and Buhl 2005]. The authors conclude that “Underestimation cannot be explained by error and is best explained by strategic misrepresentation, that is, lying”. They also show that forecasts have not become more accurate over the 30-year period studied, despite claims to the contrary by forecasters. Decision-makers should not trust cost estimates and cost-benefit analyses produced by metro project promoters and their analysts. In the case of the Delhi metro the cost of capital alone accounts for subsidy of Rs 35,000 per passenger per year.15 This is more than the per capita income (Rs 28,000 per year) of India and more than 60 per cent of the estimated per capita income of Delhi (Rs 56,000 per year). This is obviously not sustainable. At this cost we could send over a million children to a good private school every year. The policy implications are clear, if the risks generated from misleading forecasts are ignored or downplayed it will be to the detriment of social and economic welfare.
All Indian cities are developing on the periphery, have multiple business districts, and are not suited to fixed line very high capacity rail systems. The demand will never come up to the theoretical capacity of these systems partly because metro rail is not time saving as a vast majority of trips in Indian cities are less than 10 km in large cities. The presence of motorised two-wheelers makes it even more difficult as the marginal cost of travel amounts to less than Rs 1 per km. Public transport cannot charge more than this amount without losing ridership. Therefore, we have to promote an efficient and economical public transport system that has a dense network, is flexible, on the surface and of medium capacity (15,000-30,000 passengers per hour per direction). The BRT with dedicated bus lanes seems to be the only option left as it can be built at 5 per cent of the cost of metro systems [Allport and Thomson 1990; Ben-Akiva and Morikawa 2002; Fouracre, Dunkerley and Gardner 2003; Fulton, Hardy, Schipper, and Golub 2007; GAO 2003; Halcrow Fox 2000; Levinson, Zimmerman, Clinger, Rutherford, Smith, Cracknell and Soberman 2003; Penalosa 2004; Ridley 1995; The Bus Rapid Transit Policy Centre 2007; Tiwari 2002a, 2002c; Winston and Maheshri 2007; World Business Council for Sustainable Development 2001].16 The cost of building elevated rail systems (including monorail and light rail) is around Rs 1,500 million per km and for underground systems Rs 2,000-2,500 million per km. On the other hand, BRT systems cost about Rs 50-100 million per km. About 20-30 km of BRT can be built for each km of the metro. This cost of the BRT system includes shifting of water and electric services, providing better footpaths and bicycle lanes and installing modern lighting and other road furniture. This happens because when the road layout is altered you get an opportunity to redevelop the corridor. So a BRT project ends up being a urban rejuvenation project. Since the metros are underground or elevated they do not have this effect on the ground.17 There are strong reasons why surface BRT is preferable in modern LMIC large cities [Knoflacher 2007b]: Economic: Public transport on the ground in form of buses and street cars is cheaper to build, maintain and to operate. Efficiency: Public transport is one of the most efficient modes with respect to energy consumption, use of space and safety. Therefore, there is no reason to remove it from the road surface. Accessibility: Elevated or underground public transport loses half or even two-thirds of potential customers compared to street level public transport modes. Further, if public transport is separated from the street level, it becomes necessary to build and operate escalators, lifts, etc. This enhances the costs for construction, maintenance and operation.
5 Conclusions International empirical evidence and the Delhi experience indicate that metro rail systems (elevated or underground) have not delivered the goods in terms of passengers carried or social welfare and are unlikely to in cities that do not have a very dense and large central business district. Economic & Political Weekly january 26, 2008
Security: The entire transport system on the street level is under public social control and is, therefore, much safer. Urban Economy: Street level public transport is good for the urban economy. The experience of European cities shows that
51
Special Article
replacing street level public transport by underground systems has a negative effect on local shops. Underground or grade separated public transport systems increase both disparities and the need for longer travel. Structural: Public transport on street levels keep people moving without fundamental changes of urban structures and the system provides flexibility as land use changes. Urban Vision: It is crucial to integrate public transport also in the mental map of people and visitors. Public transport on the streets tells the people that it is a socially balanced city. Environmental: Public transport on the street level serves as an indicator for an environment-friendly transport policy of the city. To integrate public transport in the human society it Notes 1 Jamie Lerner was the mayor and chief architect of the Curitiba (Brazil) master plan. During his 12 years in office, Lerner devised many of Curitiba’s innovative and inexpensive solutions to city problems and is credited for introducing the first version of the bus rapid transit system in his city. 2 Enrique Penalosa was mayor of Bogota, Colombia, and chose to implement a bus rapid transit system instead of a metro system. He is in demand worldwide to share his views on city planning and development. 3 ‘Ludhiana to Have Its Metro Rail Service’, The Hindu, Wednesday, October 10, 2007, online edition, http://www.thehindu.com/2007/10/10/ stories/2007101053990500.htm. 4 Bangalore Mass Rapid Transit (BMRTL), Benefits of Namma Metro, http://www.bmrc.co.in/ benefits.html, accessed October 15, 2007. 5 ‘Hyderabad to Have Metro Rail’, The Tribune, online edition, Sunday, January 21, 2007, Chandigarh, http://www.tribuneindia.com/ 2007/20070121/nation.htm#4, accessed October 16, 2007. 6 See the web site of the ministry of urban development to get an insight into this confusion (http:// urbanindia.nic.in/moud/programme/ud/main. htm). The ministry has to repeatedly write to the states and cities to clarify matters, e g, “…This ministry is receiving proposals for flyovers road widening, metros etc, under JNNURM Viability Gap Funding budgetary support from government of India… while proposing any option, all other options should also be evaluated specially when high cost options are being proposed” (D O No K-14011/07/2007-UT, May 22, 2007, from secretary urban development to chief secretaries of all states). 7 The managing director of DMRC, E Sreedharan, is today convinced that all cities above three million population should have a metro system and is in the process of preparing detailed project reports for implanting such systems (see Project Monitor, October 20, 2007: http://www.projectsmonitor.com/detailnews.asp?newsid=7734). 8 The ministry of urban development web site http://jnnurm.nic.in/missioncities.htm includes all the city development plans submitted under the JNNURM. Almost all of them use this argument of increase in demand for widening roads. 9 At average urban speeds of 20 km/h in Delhi, this would mean that even 60 per cent of the car trips are less than 10 km. 10 The average density in persons per square km for metropolitan regions of low and middle income cities are: Mumbai – 4,080, Delhi – 1,227, Kolkata –
52
11
12 13 14
15
16
17
is necessary to keep it on the road surface instead of the sky or underground. It is clear that urban metro systems appeared at the end of the 19th and early 20th century when there were no choices except rail available for the middle class commuters for mechanised travel. They got a further boost during the cold war when deep tunnels were justified as air raid and nuclear shelters and cost was no criterion. The evidence seems to be clear that elevated and underground rails systems are far too expensive and not very successful in 21st century LMIC large cities. Surface light rail systems may have a role in connecting megacities with surrounding towns on existing rail alignments. With the challenges of global warming staring us in the face, the only choice we have is to plan our cities for safe walking and bicycling facilities on all roads, bus rapid transit systems on all major roads, supplemented by low energy consuming economical taxi systems.
7,978, Bangalore – 1,050, Shanghai – 2,619, Mexico City – 3,796. Similar statistics for some HIC cities: London – 679, Berlin – 818, New York – 783. When public transport is not provided officially, informal systems using mini-buses, three-wheelers and vans operate semi-legally or illegally and provide a majority of the motorised trips. No low or middle income city is without such systems. Delhi Metro Rail Corporation web site http:// www.delhimetrorail.com/corporates/needfor_ mrts.html accessed on 2007-11-03. Delhi Metro Rail Corporation web site http://www. delhimetrorail.com/corporates/projectupdate/ expected_ridership.html, accessed on 2005-12-02. Newspapers reported the results of study done by CRRI (‘Metro Brings Down Pollution Levels’, Times of India, June 5, 2007) claiming a benefit of Rs 20,725 million by the end of 2007 based on savings in petrol, diesel and CNG, passenger time due to faster mode, reduction in environmental pollutants and the like. Based on a capital expenditure of Rs 105,710 million for phase I, 600,000 passengers day (300,000 roundtrips), depreciation and interest rate at 5 per cent each. Details of and studies regarding bus rapid transit system are available at www.go.brt.org. In India, the cost of a BRT system is Rs 50-100 million and metro system 1,500-2,500 crore per km. For BRT the costs are based on the project being implemented in Delhi and others being sanctioned by the ministry of urban development. For metro systems, the costs are based on those quoted by the Delhi Metro Rail Corporation from time to time. The average cost of Metro Phase I in Delhi is estimated at Rs 1,626 million per km (http//www. delhimetrorail.com/corporates/projectupdate/ project_cost.html). Only 20 per cent of this is underground.
References Allport, R J and J M Thomson (1990): Study of Mass Rapid Transit in Developing Countries, Report 188, Transport Research Laboratory, Crowthorne, UK. Baker, J, R Basu, M Cropper, S Lall and A Takeuchi (2005): ‘Urban Poverty and Transport: The Case of Mumbai’, World Bank Policy Research Working Paper 3693, World Bank, Washington DC, pp 1-81. Bannister, D (2005): Unsustainable Transport: City Transport in the New Century, Routledge, New York. Ben-Akiva, M and T Morikawa (2002): ‘Comparing Ridership Attraction of Rail and Bus’, Transport Policy, 9(2), pp 107-16.
Breese, G (1963): ‘Urban Development Problems in India’, Annals of the Association of American Geographers, 53(3), pp 253-65. Brons, M, P Nijkamp, E Pels and P Rietveld (2003): ‘Railroad Noise: Economic Valuation and Policy’, Transportation Research Part D: Transport and Environment, 8(3), pp 169-84. Bus Rapid Transit Policy Centre (2007): ‘BRT Database’, Breakthrough Technologies Institute, Washington DC, http://www.gobrt.org. Cerin, E, D J Macfarlane, H H Ko and K C Chan (2007): ‘Measuring Perceived Neighbourhood Walkability in Hong Kong’, Cities, 24(3), pp 209-17. Cervero, R (2002): ‘Induced Travel Demand: Research Design, Empirical Evidence, and Normative Policies’, Journal of Planning Literature, 17(1), pp 3-20. Chang, J S K (2007): ‘Integration of Ring Road and BRT System Urban Transport’, International Workshop Urban Transport: Today and Tomorrow, TRIPP, Indian Institute of Technology Delhi, New Delhi. Chant, C (2002): Rapid Transit Systems and the Decline of Steam, Grange Books, Rochester, Kent. Christopher Zegras, P (2007): ‘As If Kyoto Mattered: The Clean Development Mechanism and Transportation’, Energy Policy, 35(10), pp 5136-50. Commission for Integrated Transport UK (2001): European Best Practice in the Delivery of Integrated Transport, WS Atkins Transport Planning, Epsom, Surrey. Cox, W (2001): ‘Urban Transport Fact Book – Urban Rail Productivity’, http://www.publicpurpose. com/ut-intlrrprodtok.htm, Wendell Cox Consultancy, accessed 2007-07-11. – (2004): ‘The Public Purpose, a National Journal’, http://www.publicpurpose.com/, Wendell Cox Consultancy, accessed 2007-07-11. CSE (2007): Is Delhi Losing the Pollution Battle?, Centre for Science and Environment, New Delhi. Daniels, P W (1972): ‘Transport Changes Generated by Decentralised Offices’, Regional Studies: The Journal of the Regional Studies Association, 6(3), pp 273-89. – (1981): ‘Transport Changes Generated by Decentralised Offices: A Second Survey’, Regional Studies: The Journal of the Regional Studies Association, 15(6), pp 507-20. de la Torre, G Q (2003): Mexico City: Energy, Mobility and Sustainable Urban Development, Business Council for Sustainable Development – Mexico, Mexico City. de Villa, V and M S Westfall (2001): Urban Indicators for Managing Cities: Cities Data Book, Asian Development Bank, Manilla. Debrezion, G, E Pels and P Rietveld (2004): ‘The Impact of Railway Stations on Residential and january 26, 2008 Economic & Political Weekly
Special Article Commercial Property Value: A Meta Analysis’, Tinbergen Institute Discussion Paper, TI 2004-023/3, Tinbergen Institute, Amsterdam. Delhi Traffic Police (2007): ‘Road Accidents in Delhi – 2006’, Accident Research Cell, Delhi Police, New Delhi. Dora, C (1999): ‘A Different Route to Health: Implications of Transport Policies’, British Medical Journal, 318(7199), 1686-89. – (2007): ‘Health Effects’, Seminar, 579, pp 26-30. Edwards, M and R l Mackett (1996): ‘Developing New Urban Public Transport Systems: An Irrational Decision-making Process’, Transport Policy, 3(4), pp 225-39. Flyvbjerg, B, M K S Holm and S L Buhl (2002): ‘Underestimating Costs in Public Works Projects – Error or Lie?’, Journal of the American Planning Association, 68(3), pp 279-95. – (2005): ‘How (In) Accurate Are Demand Forecasts in Public Works Projects? The Case of Transportation’, Journal of the American Planning Association, 71(2), pp 131-46. Fouracre, P, C Dunkerley and G Gardner (2003): ‘Mass Rapid Transit Systems for Cities in the Developing World’, Transport Reviews, 23(3), pp 299-310. Fulton, L, et al (2007): Bus Systems for the Future: Attaining Sustainable Transport Worldwide, International Energy Agency, Paris. GAO (2003): Bus Rapid Transit Offers Communities a Flexible Mass Transit Option, GAO-03-729T, United States General Accounting Office, Washington DC. Halcrow, Fox (2000): World Bank Urban Transport Strategy Review – Mass Rapid Transit in Developing Countries, Final Report, Department for Inter national Development, World Bank, Washington DC. Hidalgo, D (2004): ‘Bogota Experience in Sustainable Transportation’, Proceedings of International Conference on Reducing the Impact of Vehicles on Air and Environment Quality in Cities, http:// iu app a .c om /c on f e r e nc e /s e m i n a r-m e x ic o. htm#Summary, IUAPPA, Brighton, UK, accessed 2007-10-11. IPCC (2007): Climate Change 2007: Synthesis Report, Intergovernmental Panel on Climate Change, Geneva. JBIC (1999): Urban Public Transportation in Vietnam: Improving Regulatory Framework, JBIC Research Paper No 4, Research Institute for Development and Finance, Japan Bank for International Cooperation, Tokyo. Kågeson, P (2001): The Impact of CO2 Emissions Trading on the European Transport Sector, VINNOVA Report VR 2001:17, Nature Associates, Stockholm. Kawabata, M and Q Shen (2006): ‘Job Accessibility as an Indicator of Auto-Oriented Urban Structure: A Comparison of Boston and Los Angeles With Tokyo’, Environment and Planning B: Planning and Design, 33(1), pp 115-30. Knoflacher, H (2007a): ‘Success and Failures in Urban Transport Planning in Europe – Understanding the Transport System’, Sadhna – Academy Proceedings in Engineering Sciences, 32(4), pp 293-308. – (2007b): ‘From Myth to Science’, Seminar, 579, pp 40-44. Krygsman, S, M Dijst and T Arentze (2004): ‘Multi modal Public Transport: An Analysis of Travel Time Elements and the Interconnectivity Ratio’, Transport Policy, 11(3), pp 265-75. Lerner, J (1996): ‘Change Comes from the Cities’, Our Planet: Human Settlements, 8(1). Levinson, H, S Zimmerman, J Clinger, S Rutherford, R L Smith, J Cracknell and R Soberman (2003): Bus Rapid Transit – Volume 1: Case Studies In Bus Rapid, TCRP Report, 90, Transportation Research Board, Washington DC, pp 1-62. Mackett, R and E Babalik Sutcliffe (2003): ‘New Urban Rail Systems: A Policy-Based Technique to Make Them More Successful’, Journal of Transport Geography, 11(2), pp 151-64. Economic & Political Weekly january 26, 2008
Mackett, R I and M Edwards (1998): ‘The Impact of New Urban Public Transport Systems: Will the Expectations Be Met?’, Transportation Research A, 32(4), pp 231-45. McGuckin, N and N Srinivasan (2003): Journey to Work Trends in the United States and Its Major Metropolitan Areas 1960 – 2000, FHWA – EP-03058, Office of Planning, Federal Highway Administration, US Department of Transportation, Washington DC. Ministry of Urban Development (2005): National Urban Transport Policy, Ministry of Urban Development, Government India, New Delhi, pp 1-22. – (2006): ‘Jawaharlal Nehru Urban Renewal Mission’http://jnnurm.nic.in/defaultud.aspx#, Ministry of Urban Development, Government of India, New Delhi, accessed 2007-11-11. Mogridge, M J H (1997): ‘The Self-Defeating Nature of Urban Road Capacity Policy: A Review of Theories, Disputes and Available Evidence’, Transport Policy, 4(1), pp 5-23. Morichi, S (2005): ‘Enhancement of Urban Transport Sustainability in Japan’, Ministry of Land, Infrastructure and Transport, Japanese government, Tokyo, Murty, M N, K K Dhavala, M Ghosh and R Singh (2006): Social Cost-Benefit Analysis of Delhi Metro, Report for Planning Commission, Government of India, Institute of Economic Growth, Delhi, pp 1-30. Nelson, A C (1992): ‘Effects of Elevated Heavy-Rail Transit Stations on House Prices with Respect to Neighborhood Income’, Transportation Research Record, (1359), pp 127-32. Newman, P and J Kenworthy (1999): Sustainability and Cities: Overcoming Automobile Dependence, Island Press, Washington DC. Noland, R B (2001): ‘Relationships between Highway Capacity and Induced Vehicle Travel’, Transportation Research Part A: Policy and Practice, 35(1), pp 47-72. Penalosa, E (2004): ‘Social and Environmental Sustainability in Cities’, Proceedings of International Mayors Forum on Sustainable Urban Energy Development, Kunming, P R China. Rabinovitch, J (1995): ‘A Sustainable Urban Transportation System: The “Surface Metro” in Curitiba, Brazil’, Working Paper No 19, United Nations Development Programme, New York. Ridley, M A (1995): World Bank Experiences with Mass Rapid Transit Projects, World Bank, Washington DC. RITES (1995) Integrated Multi-Modal Mass Rapid Transport System for Delhi, Economic Analysis for Modified First Phase, RITES, Gurgaon, Haryana. – (1998): Traffic and Transportation Policies and Strategies in Urban Areas in India, Final Report, Ministry of Urban Affairs and Employment, Government of India, New Delhi. – (2005a): Environmental Impact Assessment for Phase II Corridors of Delhi Metro, Delhi Metro Rail Corporation, New Delhi. – (2005b): Integrated Multi-Modal Public Transport Network for the National Capital Territory of Delhi, Final Report, Transport Department, Government of NCT of Delhi, New Delhi. Rodrigue, J P (2005): ‘Urban Mobility’ in J P Rodrigue, C Comtois and I Slack (eds), The Geography of Transport Systems. Ross, H, A Poungsomlee, S Punpuing and K Archavanitkul (2000): ‘Integrative Analysis of City Systems: Bangkok “Man and the Biosphere” Programme Study’, Environment and Urbanisation, 12(2), pp 151-61. Roth, L C (2000): ‘An Economic Approach to Urban Development and Transportation in Metro Manila’, Master Thesis dissertation, Programme for Business Administration and Economics, Linkoping University. Santos, G and B Shaffer (2004): ‘Preliminary Results of the London Congestion Charging Scheme’, Public Works Management and Policy, 9(2), pp 164-81.
Schrank, D and T Lomax (2007): The 2007 Urban Mobility Report, Texas Transportation Institute, The Texas A&M University System, College Station, Texas, pp 1-138. Singh, Y P (2002): ‘Performance of the Kolkata (Calcutta) Metro Railway’ in X Godard and Fantozoun I (eds), Proceedings Conference CODATU X: Urban Mobility for All, A A Balkema Publishers, Rotterdam. Sreedharan, E (2003): ‘Delhi Metro Rail...2,500 Less Buses on Roads’, http://www.indiainfoline.com/ infr/spfe/delh.html, India Infoline, accessed 2005, pp 12-02. – (2004): ‘Need for a National Policy for Metro Rail Projects’, mimeo, Delhi Metro Rail Corporation, New Delhi. Statistics Singapore (2006): ‘General Household Survey 2005, Statistical Release 2: Transport, Overseas Travel, Households and Housing Characteristics’, Department of Statistics, Ministry of Trade and Industry, Singapore. Stopher, P R (2004): ‘Reducing Road Congestion: A Reality Check’, Transport Policy, 11(2), pp 117-31. Taylor, B D (2004): ‘The Politics of Congestion Mitigation’, Transport Policy, 11(3), pp 299-302. TCRP (1996): Transit, Urban Form, and the Built Environment: A Summary of Knowledge (Volume 1, Part I), Washington DC, TCRP Report 16, Transportation Research Board, National Research Council, National Academy Press. Tiwari, G (2002a): ‘Bus Priority Lanes for Delhi’ in G Tiwari (ed), Urban Transport for Growing Cities: High Capacity Bus Systems, pp 200-22, Macmillan India, New Delhi. – (2002b): ‘Urban Transport Priorities – Meeting the Challenge of Socio-Economic Diversity in Cities, A Case Study of Delhi, India’, Cities, 19(2), pp 95-103. – (2002c): Urban Transport for Growing Cities: High Capacity Bus Systems (ed), Macmillan Indian, New Delhi. – (2007): Traffic Monitoring at Selected Locations in Delhi, Transportation Research and Injury Prevention Programme, Indian Institute of Technology Delhi, New Delhi. Transport Department (2007): ‘Transport in Hong Kong’, The Government of the Hong Kong Special Administrative Region of the People’s Republic of China, http://www.td.gov.hk/transport_in_ hong_kong/transport_figures/monthly_traffic_ and_transport_digest/index_t.htm, accessed 2007-11-19. Transport for London (2006): London Travel Report 2006, Mayor of London, London, pp 1-74. Urban Age (2007): ‘Urban India: Understanding the Maximum City’, The London School of Economics and Political Science, London. UrbanRail.Net (2007): ‘A Complete Guide to Rail Metro, Subway, or Underground Networks’, Robert Schwandl, http://www.urbanrail.net, accessed 2007, pp 11-19. Vincent, W and L C Jerram (2006): ‘The Potential for BRT to Reduce Transportation-Related CO2 Emissions’, Journal of Public Transportation, 9(3), pp 219-37. WBCSD (2001): Mobility 2030: Meeting the Challenges to Sustainability, World Business Council for Sustainable Development, Geneva. Whitten, D O (1994): ‘Rollin on Rubber: 120 Years of Rubber Road Surfacing’ in E J Perkins, Essays in Economic and Business History (12): pp 414-27. http: //www.business. auburn.edu/~whittdo/ Rollin%2 0on% 20Rubber.pdf, accessed 2007, pp 11-19. Winston, C and V Maheshri (2007): ‘On the Social Desirability of Urban Rail Transit Systems’, Journal of Urban Economics, 62(2), pp 362-82. World Bank (2006): World Development Indicators 06, World Bank, Washington DC. World Business Council for Sustainable Development (2001): Mobility 2001: World Mobility at the End of the Twentieth Century and Its Sustainability, WBCSD, E&Y Direct, Geneva.
53