National Study of Long-Term Care Providers Introduction The biennial National Study of Long-Term Care Providers (NSLTCP), sponsored by the U.S. Centers for Disease Control and Prevention’s National Center for Health Statistics (NCHS), is a groundbreaking initiative to monitor trends in the major sectors of paid, regulated long-term care services providers. NSLTCP includes adult day services centers, home health agencies, hospices, nursing homes, and assisted living and similar residential care communities. The vision for NSLTCP is to offer reliable, accurate, relevant and timely statistical information to support and inform long-term care services policy, research and practice. The main goals of NSLTCP are to: 1. Estimate the supply and use of paid, regulated long-term care services providers. 2. Estimate key policy-relevant characteristics and practices. 3. Produce national and state-level estimates, where feasible. 4. Compare among sectors. 5. Monitor trends over time. NSLTCP replaces NCHS’ previous National Nursing Home Survey, National Home and Hospice Care Survey, and National Survey of Residential Care Facilities. NSLTCP:
CS246793 (04/2014)
Includes five major sectors of paid, regulated long-term care services providers. Uses existing administrative data on nursing homes, home health agencies, and hospices. Collects primary data via nationally representative surveys of adult day services centers and residential care communities, because national administrative data are not available on these providers. Allows comparisons among provider sectors at a similar point in time and over time.
National Center for Health Statistics Division of Health Care Statistics
NCHS implemented the first wave of NSLTCP in 2012 and released the first NSLTCP overview report in December 2013. The overview report is available at: http://www.cdc.gov/ nchs/data/nsltcp/long_term_care_services_2013.pdf. The restricted 2012 survey data files for adult day services centers and residential care communities are available through NCHS’ Research Data Center. Other first wave products, planned for release in 2014, include web-based tables showing state estimates and data briefs. NCHS plans to field the second wave of adult day and residential care surveys between June and December 2014. Information will be obtained from mail and web questionnaires administered to directors (or their designees) of adult day services centers and residential care communities. The questionnaires will take on average 30 minutes to complete. All information that would permit identification of an individual center or community participating in this study is kept strictly confidential. Survey participants receive assurance of this confidentially under the Public Health Services Act. To learn more about NSLTCP, please visit http://www.cdc.gov/ nchs/nsltcp.htm or contact Dr. Lauren Harris-Kojetin, Chief, Long-Term Care Statistics Branch at
[email protected] or 301–458–4369.
Selected 2012 NSLTCP Findings*
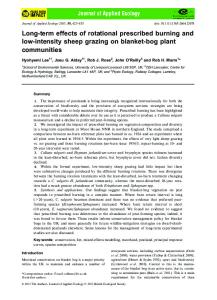
In 2012, about 58,500 paid, regulated long-term care services providers served about 8 million people in the United States. Each day in 2012, there were 273,200 participants enrolled in adult day services centers, 1,383,700 residents in nursing homes, and 713,300 residents in residential care communities; in 2011, about 4,742,500 patients received services from home health agencies, and 1,244,500 patients received services from hospices. Percent distribution of long-term care services providers, by provider type and region: United States, 2012 16.4
28.6
15.6
21.3
16.9 36.4
West
48.3
Adult day services center (4,800)
South
85 and over
32.4
75–84
27.9
31.3 24.6
27.3
23.7
8.0
12.6
17.0
Home health agency (12,200)
Hospice (3,700)
Nursing home (15,700)
22.9
Midwest
10.1
Northeast
The largest share of adult day services centers, home health agencies, hospices and nursing homes was in the South, while the largest share of residential care communities was in the West. Percentage of users of long-term care services with a diagnosis of Alzheimer's disease or other dementias, and with a diagnosis of depression, by provider type: United States, 2011 and 2012
14.9
36.5 17.6
16.4
14.9
5.5
Adult day services center
Residential care community (22,200)
NOTE: Percentages are based on the unrounded numbers.
Home health agency
Hospice
Nursing home
10.4
65–74
6.7
Under 65
Residential care community
NOTES: Denominators used to calculate percentages for adult day services centers, nursing homes, and residential care communities were the number of participants enrolled in adult day services centers, the number of residents in nursing homes, and the number of residents in residential care communities on a given day in 2012. Denominators used to calculate percentages for home health agencies and hospices were the number of patients whose episode of care in a home health agency ended at any time in 2011, and the number of patients who received care from Medicare-certified hospices at any time in 2011. See Appendix A and Technical Notes for more information on the data sources used for each provider type. Percentages may not add to 100 because of rounding. Percentages are based on the unrounded numbers.
The age composition of long-term care services users varied by sector, with residential care communities, hospices, and nursing homes serving more persons aged 85 and over, and adult day services centers serving more persons under age 65 than other sectors.
Depression
48.5
48.5
Total number and percent distribution of nursing employee full-time equivalents, by provider type and staff type: United States, 2012
44.3 39.6 34.7
31.9
19.4
32.9
Alzheimer’s disease or other dementias
50.5
32.2 30.6
20.7
42.3
46.8
42.4
18.3
25.5
27.2
34.5 32.4
Percent distribution of users of long-term care services, by provider type and age group: United States, 2011 and 2012
30.1 23.5
Adult day services center
24.8
22.2
Home health agency
Hospice
Nursing home
26.6
69.4
19.0
11.3
54.4
Residential care community
NOTES: Denominators used to calculate percentages for adult day services centers, nursing homes, and residential care communities were the number of participants enrolled in adult day services centers, the number of residents in nursing homes, and the number of residents in residential care communities on a given day in 2012. Denominators used to calculate percentages for home health agencies and hospices were the number of patients whose episode of care in a home health agency ended at any time in 2011, and the number of patients who received care from Medicare-certified hospices at any time in 2011. See Appendix A and Technical Notes for more information on the data sources used for each provider type. Percentages are based on the unrounded numbers.
Alzheimer’s disease or other dementias were most prevalent among nursing home residents, and least prevalent among home health patients. The percentage of long-term care services users with a diagnosis of depression was highest in nursing homes, and lowest in residential care communities, adult day services centers, and hospices.
35.7 65.4 9.6
54.7
19.2 Adult day services center (20,700 FTEs)
Hospice (57,800 FTEs)
Aide
10.2
Licensed practical or vocational nurse Registered nurse
22.9 11.7
Home health agency (143,600 FTEs)
82.1
7.6
Nursing Residential care home community (952,100 FTEs) (278,600 FTEs)
NOTES: Only employees are included for all staff types; contract staff are not included. For adult day services centers and residential care communities, aides refer to certified nursing assistants, home health aides, home care aides, personal care aides, personal care assistants, and medication technicians or medication aides. For home health agencies and hospices, aides refer to home health aides. For nursing homes, aides refer to certified nurse aides, medication aides, and medication technicians. See Appendix A and Technical Notes for information on how outliers were identified and coded. Numbers may not add to 100 because of rounding. Percentages are based on the unrounded numbers. FTE is full-time equivalent.
In 2012, nearly 1.5 million nursing employee full-time equivalents (FTEs) were directly employed by providers in the five sectors. The relative distribution of staff types of nursing employee FTEs varied across sectors.
* Source: Long-Term Care Services in the United States: 2013 Overview Appendix B. Available at http://www.cdc.gov/nchs/nsltcp/nsltcp_products.htm.