NOVEL ZNS NANOSTRUCTURES: SYNTHESIS, GROWTH MECHANISM, AND APPLICATIONS
A Dissertation Presented to The Academic Faculty
by
Daniel F. Moore
In Partial Fulfillment of the Requirements for the Degree Doctor of Philosophy in the School of Materials Science and Engineering
Georgia Institute of Technology December 2006
COPYRIGHT 2006 BY DANIEL F. MOORE
NOVEL ZNS NANOSTRUCTURES: SYNTHESIS, GROWTH MECHANISM, AND APPLICATIONS
Approved by: Dr. Zhong L. Wang, Advisor School of Materials Science & Engineering Georgia Institute of Technology
Dr. Christopher Summers School of Materials Science & Engineering Georgia Institute of Technology
Dr. Shuming Nie School of Biomedical Engineering Georgia Institute of Technology
Dr. C. P. Wong Materials Science & Engineering Georgia Institute of Technology
Dr. Robert Snyder School of Materials Science & Engineering Georgia Institute of Technology Date Approved: October 24, 2006
To everyone who has assisted me in my studies throughout my life
ACKNOWLEDGEMENTS One of the first things that I do when I open a new book or piece of work is read the dedication and acknowledgement section. Many times, these are some of my favorite parts of the work. Acknowledgements offer an opportunity for the reader to recognize that a whole host of people and events are behind any individual work and that without the input, impact, and interference of the people acknowledged, the work would be entirely different, perhaps not even recognizable. First, I ought to thank those that had a direct impact on my scholastic studies. I have much gratitude to my advisor Dr. Zhong L. Wang for without his guidance none of my studies would have been possible. My gratitude is also to my committee members: Dr. Shuming Nie, Dr. Robert Snyder, Dr. Chris Summers, and Dr. C.P. Wong. The members of my research group have also had a great impact on my research, both materially and helping me shape the questions I ask. In particular, I would like to thank Xudong Wang, who has been my officemate for my entire time here at Georgia Tech, my friend, and, most recently, my racquetball partner. He has endured my sometimes distracting nature and my dangerous racquetball technique. I would also like to thank Christopher Ma and William Hughes. These two group members have helped me shape my scientific outlook. Jenny Morber has constantly put up with my sometimes blunt nature and my rants on different subjects. She should know that she dishes it out just as well as she takes it. Just as important are those that have impacted me outside of the laboratory and my research group. Dr. Molly Cochran has provided me innumerous inspiration and faith that the ivory tower of academia is in good hands. She has constantly encouraged me to
iv
explore deeper issues and to maintain a renaissance attitude towards education. She has kept me and my faith in the belief that education serves the educated on its own. It serves no master. Many other people have had an impact upon my life during my time studying for my doctorate. Most importantly, my parents, John and Jimi Moore have constantly prodded me to work hard, keep my eye on the ball, and remember why it is that I am here. Also, my brother and my sister have provided me with enjoyment and encouragement to leave my comfort zone. Leslie Brody has been a constant source of encouragement and joy.. Without any of these people, along with countless other friends and family, my education at Georgia Tech would have been worse off. I have an immeasurable amount of gratitude for all those who have helped me in my education.
v
TABLE OF CONTENTS Page ACKNOWLEDGEMENTS
iv
LIST OF TABLES
x
LIST OF FIGURES
xi
SUMMARY
xix
CHAPTER 1
Introduction
1
1.1 Nanotechnology
1
1.1.1 Nanotechnology
1
1.1.2 The Current Direction of Nanotechnology Research
3
1.2 Nanomaterials
7
1.2.1 Zero- and Two-Dimensional Nanostructures
11
1.2.2 One-Dimensional Nanostructures
17
1.3 II-VI Wurtzite Semiconductors
33
1.3.1 II-VI Semiconductors
34
1.3.2 The Wurtzite Structure
37
1.4 Applications of One-Dimensional Nanostructures
2
44
1.4.1 Field Effect Transistors
45
1.4.2 Electroluminscent Display
46
1.4.3 Biomedical Applications
48
1.5 Summary
50
1.6 References
51
Methodology and Theory
63
vi
2.1 Synthesis Techniques and Growth Mechanisms 2.1.1 Vapor Deposition
64
2.1.2 Solution Based Chemistry
71
2.1.3 Growth Mechanism
72
2.2 Synthesis Setup
79
2.2.1 General Nanomaterial Synthesis
79
2.2.2 Temperature Gradient Measurements
87
2.3 Growth Model
88
2.3.1 Growth Dependeces
89
2.3.2 Atomic Scale Growth Process
97
2.3.3 Other Models of Nanostructure Growth
3
63
110
2.4 Summary
112
2.5 References
113
Cadmium Selenide
118
3.1 Introduction
118
3.2 CdSe Nanostructures
119
3.2.1 Cadmium Selenide Nanowires
119
3.2.2 Cadmium Selenide Nanobelts
121
3.2.3 Cadmium Selenide Nanosaws/Nanocombs
122
3.3 Statistical Determination of the Effects of Temperature and Growth on Cadmium Selenide Growth 125
4
3.3.1 Findings
125
3.3.2 Consistency with the Growth Model
127
3.4 Summary
132
3.5 References
134
Zinc Sulfide
136 vii
4.1 Introduction
136
4.1.1 Zinc Sulfide Crystal Structures
137
4.1.2 Applications of ZnS
139
4.2 Synthesis
140
4.3 Anisotropy in Zinc Sulfide
141
4.3.1Anisotropy Due to Polarity and Differently Terminated Surfaces 142 4.3.2 Effect of Defects in the Growth Material 4.4 Zinc Sulfide Nanostructures
145
4.5 Non-Polar Surface Dominated Zinc Sulfide Nanostructures
151
4.5.1 Nanowires, Nanobelts, Nanosaws, and Nanowindmills
152
4.5.2 Catalyst Assisted Growth
168
4.6 Polar Surface Dominated Zinc Sulfide Nanostructures
171
4.6.1 Polar Growth in Other Nanomaterials
172
4.6.2 Helical and Ring-like Morphologies of ZnS Nanostructures
173
4.7 Multi-Component Systems
5
144
184
4.7.1 Zinc Sulfide Nanowires on Cadmium Selenide Crystals
184
4.7.2 Core-shell ZnS-SiO2 Ultra-long Nanowires
190
4.8 Biocompatibility
210
4.9 Summary
212
4.10 References
216
Conclusion
222
5.1 The State of the Research
222
5.2 Summary of Research
223
5.3 Future Avenues of Research
224
5.3.1 Multi-Component Systems
viii
224
5.3.2 Hierarchical Structures
225
5.3.3 Surface Functionalization
225
APPENDIX A: Derivations
227
APPENDIX B:
235
Tables
ix
LIST OF TABLES Page Table 2.1: Several Methods for Deposition and Growth
64
Table 3.1: Comparison of calculated radii with experimental
130
Table 3.2: Calculation of effective charge of various II-VI compounds
131
Table B.1: Tables of Nanowire Core/Shell Measurements
236
Table B.2: Table of Averages from Measurements
241
x
LIST OF FIGURES Page Figure 1.1: (a), (b) S E M i m a g e o f a g e c k o ‟ s f o o t h a i r , s h o w i n g t h e n a n o s c a l e s i z e o f t h e seta that are small enough to operate using the van der Waals force as an adhesive; (c) color image of a bacteria with magnetic nanowire particles inside that are used as a compass to help orient the bacteria; (d) SEM image of a molecular motor used to take nanometer steps along protein tracks inside the cytoplasm of a cell. 8 Figure 1.2: Nanomaterials have been used unknowingly in stained glass by grinding up gold and silver nanoparticles to small sizes. This figure shows SEM images of gold and silver nanoparticles with sizes ranging from 25 nm to 100 nm. Both gold and silver change their color significantly with size. Silver also can change its color depending on its shape as seen in the difference between the spherical and prismatic 100 nm silver nanoparticles 9 Figure 1.3: Pictured are the electronic band gap structures for metals, insulator, and semiconductors. Ef is the Fermi energy level, the highest energy level at which electrons collect at absolute temperature 13 Figure 1.4: These vials contain solutions with different sized monodispersed CdSe quantum dots. On the left is the smaller, sized quantum dots, ranging from blue to red. 14 Figure 1.5: Model of a graphene sheet illustrating the lattice vectors a1 and a2 and the chiral vector Ch. This model helps describe different types of nanotubes. 19 Figure 1.6: Three dimensional models of different chirality nanotubes
21
Figure 1.7: An AC potential is applied to a nanotube in situ in the TEM. The frequency is controlled in each in order to measure the harmonic frequencies. (a) no potential is applied; (b) the nanotube is in fundamental resonance; (c) the nanotube is in the second harmonic resonance 24 Figure 1.8: High-resolution TEM images of (a) 6.7 nm, (b) 10.7 nm, and (c) 20.6 nm diameter Si nanowires grown by the dissociation of silane. (d) A silicon nanowire grown by sublimation of SiO2, with SiO2 shell 28 Figure 1.9: (a) An STM image and schematic of a silicon nanowire after treatment with hydrofluoric acid. (b) A schematic view of SiH3 on the (111) surface of silicon. The red and large blue represents the hydrogen atoms and the silicon atoms in SiH3 while the small blue represents the (111) silicon atoms 30
xi
Figure 1.10: TEM images of ZnO nanobelts showing their geometrical shape. (A),(B),(C) TEM images of several straight and twisted ZnO nanobelts (D) Cross-sectional TEM image of a ZnO nanobelt, showing a rectanglelike cross section (E) TEM image of a nanobelt. The inset shows the electron diffraction pattern 32 Figure 1.11: The zinc blend and wurtzite crystal structures. The blue represents the zinc atoms and the black represents the sulfur atoms 39 Figure 1.12: Piezoelectricity encompasses electric polarization produced by mechanical deformation. The polarization created is proportional to the strain. The images show, from left to right, the wurtzite crystal in its relaxed state, being compressed, and being stretched 40 Figure 1.13: Projection of the wurtzite crystal structure along [110]. The (0001) and (01– 11) polar planes are evident 43 Figure 1.14: AFM image of nanobelt-based field effect transistor (FET) design and the IV characteristics 45 Figure 1.15: Architecture for an electroluminescent display (ELD) device
47
Figure 1.16: Scale with the sizes of typical biological entities. Note, that cells are much larger than and biological molecules are on the same size scale as many nanostructures 48 Figure 2.1: A schematic of sputtering deposition
65
Figure 2.2: A schematic of a typical PLD process. Other specific setups are common, but the general design principle is the same 67 Figure 2.3: The VS growth process is pictured here, showing first the impingement of the source vapor on the substrate, the formation of a seed, and finally the growth of the nanowires out of the seed 73 Figure 2.4: (a) Low magnification SEM images demonstrating the weed-like growth of ZnS nanobelts; (b and c) SEM images of the seeds of two different ZnS weed 75 Figure 2.5: The VLS growth process is pictured here, showing first the impingement of the source vapor on the metal catalyst, supersaturating it and the growth of the nanowires out of the seed 76
xii
Figure 2.6: In situ TEM images recorded during the process of nanowire growth. (a) Au nanoclusters in solid state at 500 C; (b) alloying initiates at 800 C, at this stage Au exists in mostly solid state; (c) liquid Au/Ge alloy; (d) the nucleation of Ge nanocrystal on the alloy surface; (e) Ge nanocrystal elongates with further Ge condensation and eventually a wire forms (f). (g) Several other examples of Ge nanowire nucleation, (h,i) TEM images showing two nucleation events on single alloy droplet 77 Figure 2.7: Schematic of the furnace setup for the synthesis of ZnS nanostructures
81
Figure 2.8: Thermolyne 79300 Single Zone Split Tube Furnace
82
Figure 2.9: Schematic of the vacuum system used
84
Figure 2.10: Temperature gradient measurements of the single zone furnace
88
Figure 2.11: Schematic showing the two possible outcomes of ZnS vaporization – dissociated vapor phases and stoichiometric vapor phases 91 Figure 2.12: (a) An optical image of a single ZnO synthesis run containing (b) Zn nanowires and (c) ZnO nanowires. (d) The XRD pattern confirming the Zn nanowires 92 Figure 2.13: Experimental setup with the Zinc and Sulfur separated, attempting to determine the vapor species that deposits onto the deposition substrates
93
Figure 2.14: SEM image of sulfur doped ZnO nanowires synthesized with the setup in Figure 2.13 94 Figure 2.15: Scanning electron microscope image showing carbon nanotubes growing on the heated portion of an atomic force microscope cantilever 95 Figure 2.16: The impact of having a carrier gas present on the concentration of the growth species in the vapor
97
Figure 2.17: A schematic showing the typical steps in crystal growth
98
Figure 2.18: The hard-spheres model for the accommodation coefficient
101
Figure 2.19: Coordinate system used in the calculations. The domains s (substrate surface) and w (nanowire side wall), where the two diffusion equations are solved, are indicated, the radius and the height (z = L) of the nanowire 105 Figure 3.1: SEM images of CdSe nanowires on single-crystal silicon substrate
120
Figure 3.2: (a) SEM and (b,c) TEM images of CdSe nanobelts
121
Figure 3.3: (a) SEM image of CdSe nanosaws and (b) TEM analysis of a nanocomb/nanosaw structure showing the growth direction
123
xiii
Figure 3.4: (a) TEM image of CdSe nanocomb; (b) Image of boxed area at root of secondary growth showing the zinc blende layers; (c) Image of root and side of the secondary growth 124 Figure 3.5: (Statistical findings of CdSe nanowire, nanobelt, and nanosaw growth studies are presented with respect to (a) source temperature, (b) system pressure, and (c) distance from the source. (d) The predicted concentration of the vapor species based on distance from Figure 2.16 is presented for comparison 126 Figure 4.1: The zinc blende (left) and wurtzite (right) crystal structures of ZnS
137
Figure 4.2: Schematic of an electroluminescent display (ELD) device with ZnS as the phosphor material 140 Figure 4.3: Projection of the wurtzite crystal structure along [1-210]. The (0001) and (0111) polar planes are evident 143 Figure 4.4: Epitaxial growth of ZnS at very low vapor concentration. This forms a rough layer of ZnS 146 Figure 4.5: Schematic diagrams of the three growth modes for epitaxial systems: Frankvan der Merwe (FM), Volmer-Weber (VW), and Stranski-Krastanow (SK)147 Figure 4.6: Hexagonal ZnS columns grown by vapor deposition
148
Figure 4.7: (a) Hexagonal ZnS columns whose growth has been arrested so the growth process can be seen; (b and c) The hexagonal layer-by-layer growth of the columns can be seen 150 Figure 4.8: Various other ZnS nanostructures synthesiszed using the simple vapor deposition process
151
Figure 4.9: ( a ) L o w m a g n i f i c a t i o n S E M i m a g e d e m o n s t r a t i n g t h e “ w e e d ” g r o w t h c a u s e d b y t h e V S m e c h a n i s m ; ( b ) S E M i m a g e o f t h e “ s e e d ” c r y s t a l o f t w o d i f f e r e n t ZnS weeds 154 Figure 4.10: SEM images of (a) ZnS comb-like structure and (b) sheet-like structure 155 Figure 4.11: (a) TEM image and the corresponding electron diffraction pattern from a saw-like ZnS nanostructure; (b) TEM image of the comb-like ZnS nanostructure. The inset is an EDS spectrum showing the existence of sulfur and zinc atoms in the specimen, while the copper signal comes from the TEM grid used 157 Figure 4.12: (a) SEM image of the windmill structure; (b) Image of the polyhedral structure of ZnS; (c) structural model of the growth of the windmill structure 158
xiv
Figure 4.13: TEM images of a ZnS nanosaw (a) before and (b) after illumination by an electron beam; (c) Electron diffraction pattern recorded from the area which can be indexed as the coexistence of the hexagonal and cubic phases with the presence of twins in the cubic phase; (d) Theoretical diffraction pattern that corresponds to the experimental pattern 159 Figure 4.14: (a) Unit cell models for the hexagonal and cubic phases; (b) [2-1-10] high resolution TEM image of the wurtzite ZnS; (b) [0-11] Image of the zinc blende ZnS 161 Figure 4.15: HR-TEM showing the coexistence of the wurtzite, zinc blende, and the twinned zinc blende structure. The model shows the transformation among the structures that occurs by adjusting the stacking sequence of the atomic layers 162 Figure 4.16: SEM image of the as-synthesized ZnS nanostructures. The inset is an energy dispersive X-ray spectrum recorded from the sample. The Zn and S peaks are due to the nanostructures, while the silicon and oxygen peaks are due to the silicon substrate 163 Figure 4.17: (a) Bright field TEM image of a ZnS nanosaws. The polar growth occurs mainly on one side of the belt. (b) Dark field TEM image of the saw structure 164 Figure 4.18: (a) Diffraction pattern shows the saw ribbon is along [01-10] and the sawteeth are along [0001]; (b) CBED pattern recorded from the sample; (c) Highresolution TEM image recorded from the ZnS nanosaw 165 Figure 4.19: (a ) „ F e a t h e r ‟ s t r u c t u r e o f Z n S ; ( b ) A T E M i m a g e o f t h e f e a t h e r s t r u c t u r e a n d the corresponding growth directions 167 Figure 4.20: Low magnification SEM of substrate partially coated with a catalyst to promote VLS growth and partially left void of catalysts for VS growth 169 Figure 4.21: SEM image of a single nanobelt growing from a gold catalyst
170
Figure 4.22: Two specific cases of nanobelt crystallographic configurations that can lead to significant differences in growth 171 Figure 4.23: Some examples of (a and b) ZnO nanohelices and (c) nanobow, another polar dominated ZnO nanostructure 172 Figure 4.24: (a) Low magnification SEM image showing the high yield of ZnS nanohelices on the silicon substrate; (b) a very long, very densely branched nanohelix; (c) a more typical moderately branched nanohelix; (d) a densely branched nanohelix that has fallen in on itself and loosely formed a ring-like structure 174
xv
Figure 4.25: (a) A lightly branched nanohelix. The branched secondary growth always grows towards the inside of the helix as seen particularly in the two boxed areas. The nanohelices consist of a spine which coils in a helical shape. On the inner side of the spine there is Y-shaped secondary growth which all grow to the same length along an individual nanohelix; (b) another typical, moderately branched nanohelix. The Y-shaped branches always point towards the inside of the coil, regardless of the handedness of the nanohelix, suggesting that the inner face is the chemically active Zn-terminated face 175 Figure 4.26: (a) The branched secondary growth always grows towards the inside of the helix. The nanohelices consist of a spine which coils in a helical shape. On the inner side of the spine there is Y-shaped secondary growth which all grow to t h e s a m e l e n g t h a l o n g a n i n d i v i d u a l n a n o h e l i x ( t h e s c a l e b a r i s 5 μ m ) ; ( b ) P l o t of the thickness of the spine (or initial growth) of the helix vs. the radius of the helix. Values were obtained on nearly one hundred separate helices on pitch, radius, and handedness of the helix and on thickness of the spine and length and density of secondary branch of growth. While no direct relationship between pitch and radius can be determined, there does appear to be a critical thickness-to-radius ratio below which the helices form; (c) Another moderately branched nanohelix showing how the pitch and diameter of the nanohelices wer e d e t e r m i n e d ( t h e s c a l e b a r i s 2 μ m ) 177 Figure 4.27: (a) A typical TEM image of the ZnS nanohelix. It has been broken due to transfer from the silicon deposition substrate to the TEM sample holder. (b) An SEM closeup of the secondary Y-shaped branches growing towards the inside of the helix. The rough growth surface is visible 178 Figure 4.28: (a) Top down view of a typical branch growth, its SAED pattern shows (c) the (01-13) twin structure and the growth direction of the branch is along the [0002] direction; (b) The dark field image of the branch growth and the twin plane revealing a large number of stacking faults, indicating a large amount of local strain in the crystal 179 Figure 4.29: (a) A bright field TEM image with the beam direction along the length of one of the secondary growth branches (inset); the SAED pattern of the spine is shown in (b) it shows that the growth plane of the spine is the (2-1-10) plane; (c) Dark field image highlighting the growth of the spine and the branched growth. A high-resolution image is taken from (d) the spine of the nanohelix and (e) the rough secondary growth 180
xvi
Figure 4.30: (a) A schematic showing the various planes and growth directions of the nanohelix. The main spine of the nanohelix is oriented along the (2-1-10) plane, with the polar (01-11) plane towards the inside of the helix. Off of this polar plane, the secondary growth occurs; (b) A projection of the ZnS wurtzite lattice along the (2-1-10) showing key planes. The {0001} and {01-11} families of plane are polar, terminating in Zn+ cations and S- anions. The {0113} plane is also shown, as it is the side plane of the initial secondary growth off of the nanohelix spine 182 Figure 4.31: (a) SEM image of ZnS nanowire bundles grown on a CdSe substrate that was first deposited on Si(111). The CdSe is a solid film, but the ZnS is bundles of aligned nanowires; (b) Side view of the ZnS nanowire bundles; (c) Enlarged SEM image of a ZnS bundle showing traces created due to fluctuation in growth condition, presenting the equal growth rate of all of the nanowires; (d) Fractured surface of the sample showing the direct growth of ZnS nanowires on the CdSe crystals and the preservation in the ZnS nanowire bundles of the surface morphology of the CdSe crystal; (e) Enlarged top view of the aligned ZnS nanowires 186 Figure 4.32: (a and b) Low-magnification TEM images of bundles of aligned ZnS nanowires and the corresponding electron diffraction patterns from the bunches showing orientation ordering among the [0001] nanowires; (c) High-resolution TEM image of a nanowire showing uniform lattice structure; (d) EDS of ZnS nanowires showing the chemical composition 188 Figure 4.33: Schematic showing the growth of the ZnS nanowire bundles. First the CdSe crystals form on the silicon surface (left); Second, the ZnS nanowires grow on the top surface of the CdSe, thus forming the bundles 189 Figure 4.34: (a and b) SEM images of the laterally aligned ultra-long ZnS nanowires; (c) The EDS shows Zn, S, Si, and O elements 192 Figure 4.35: (a) A composite SEM image showing the growth of the ultra-long aligned nanowires across the entire silicon deposition substrate; (b) An optical image of a typical synthesis shows the high density and yield of the synthesis run. Note that the nanowires begin from the (c) upstream side of the substrate and are so long that they continue off of the (d) downstream side of the substrate 193 Figure 4.36: (a) A TEM image of the nanowire, revealing the core-shell structure; (b and c) Electron diffraction patterns taken from the shell and core respectively. Note that the shell reveals a typical amorphous pattern while the core reveals the wurtzite pattern, with growth proceeding in the [0001] direction; (d and e) The corresponding EDS spectra taken from the shell and core respectively. Here, the shell is made of only Si and O, where as the core is determined to be ZnS 194
xvii
Figure 4.37: Synthesis runs were performed where the peak temperature was maintained for a variety of times in order to obtain a picture of the growth of the nanowires. Typical SEM images of the run time are shown, with their corresponding times above 195 Figure 4.38: (a) The average shell and core widths are shown as determined by a TEM study. The trendlines are added to emphasize that while the shell size increases dramatically, the core size decreases only slightly with longer synthesis times; (b) The ratio of the core volume to the shell volume as it changes over time. This was determined based on the TEM studies. This data differs with what was determined from the XRD studies 196 Figure 4.39: Full scan XRD diffraction patterns from each sample with corresponding reaction times. Broad humps at low 2theta most likely correspond to amorphous alumina shell. Disappearance of peaks in some patterns most likely due to variation of sample alignment in XRD machine with respect to the s a m p l e ‟ s o r i e n t a t i o n 199 Figure 4.40: Graph of the XRD determined ratio of ZnS to SiO2 with different synthesis times. According to the XRD studies, the amount of ZnS compared with SiO2 peaks with the 75 minute synthesis run 203 Figure 4.41: Results of the XRD study determining the ZnS crystallite size. This assumes that the ZnS core is single crystal 206 Figure 4.42: The photoluminescence spectra from six different synthesis times are shown. Note that each spectrum has two major peaks, one at 340 nm and one at 532 nm. The legend refers to series number. They correspond as follows, Series1 = 30 min, Series2 = 45 min, Series3 = 60 min, Series4 = 75 min, Series5 = 90 min, Series6 = 110 min 208 Figure 4.43: A comparison of the photoluminescence peak intensities as they change over time. The 340 nm peak stays virtually the same with longer synthesis runs where as the 532 nm peak increases initially and then at the longest synthesis time it disappears completely 209 Figure 4.44: A suggested growth model for the core-shell nanowires
210
Figure 4.45: (a) Before and (b) after SEM images of placing the core-shell ZnS-SiO2 Nanowires into a phosphate buffer solution for 30 minutes. No damage is done to the nanowires by the PBS 212
xviii
SUMMARY
Motivated by a desire to understand the basic concepts of one-dimensional nanostructure growth, the research described in this thesis aims at understanding the basic mechanisms controlling the synthesis and formation of a specific group of II-VI semiconducting nanostructures. In particular, this thesis examines one-dimensional nanostructures (such as nanobelts and nanowires) and different morphologies of ZnS that result from the interesting properties that the materials have at the nanoscale. In order to understand how to tune these properties in the nanostructure, it is necessary to have an understanding of the growth mechanism that dictates the morphology, structure, and rate of growth of the nanomaterial. It is necessary to understand what impact changes to the macroscopic setup in the experiment have on the nanoscopic scale of the nanomaterials. Having a larger understanding and exerting more precise control over the growth of nanomaterials will allow a higher level of selectivity, more control over dimensionality and the type of morphology, easier manipulation, and the simpler incorporation of these structures into a nanotechnological device. The main focus of the research was on CdSe and ZnS, with the bulk of the research being conducted on ZnS nanostructures. These materials were chosen for their potential for extensive research, their possible applications in optoelectronics, their potential to form the wurtzite crystal structure, and the potential generalization of results to other nanomaterials. The framework for the research is given first. Then a description of the experimental setup and a model for the growth of nanostructures is discussed. A
xix
brief overview of the synthesis of CdSe nanostructures is given and then a detailed analysis of the synthesis of specific ZnS one-dimensional morphologies is presented.
xx
CHAPTER 1 INTRODUCTION
This chapter seeks to provide the framework within which the research presented was undertaken. It is intended to be broad, covering a large view of the field of nanomaterials, but concise. The chapter has been divided into discussion of nanotechnology and its direction, nanomaterials, II-VI wurtzite semiconductors, and applications. 1.1 Nanotechnology Nanotechnology has seen fast development in recent years. Research dollars have been pumped into nanotechnology research at a feverish rate since the start of the National Nanotechnology Initiative in the United States. Companies are beginning to research and develop products with nanotechnology in mind and their developments are being closely watched. Nanotechnology has begun to seep into the national (and international) consciousness and awareness and is being spoken about as a revolutionizing technology that will change everything from basic building materials to computers to space travel. With all of this promise and frantic development, a simple, yet important, question is what is nanotechnology? 1.1.1 What is nanotechnology? Nanotechnology is the application of nanoscience to useful devices. In turn, nanoscience is the science that relates to objects with at least one dimension between one and one hundred nanometers in length, a size scale referred to as the nanoscale. This is
1
the size scale of atoms, molecules, and super-molecular structures. Nanotechnology will likely provide some of the most exciting breakthroughs in technology. The ability to work with atoms at the nanoscale, on the molecular level, with atomically precise design, promises to open up a lot of areas of technological development. Breakthroughs are being developed for nanostructured metals, exactly shaped ceramics and polymers without machining, nanostructured sensors, and nano-electronics for embedded health systems. W i t h a t e r m l i k e “ n a n o t e c h n o l o g y , ” a n d t h e “ n a n o ” p r e f i x t h a t i s u s e d t o d e n o t e certain products of it, it is important to define what exactly is meant when the word is used. Within science, there is hardly a definitive idea of what is included in “ n a n o t e c h n o l o g y ” b u t a w o r k i n g d e f i n i tion is useful. T h e t e r m “ n a n o t e c h n o l o g y ” h a s b e e n i n u s e a s e a r l y a s 1 9 7 4 . I t w a s d e f i n e d b y D r . N o r i o T a n i g u c h i i n a p a p e r t i t l e d “ O n t h e B a s i c C o n c e p t o f „ N a n o -T e c h n o l o g y ‟ . ” I n i t , “ n a n o t e c h n o l o g y ” i s r e f e r r e d t o a s t h e a b i l i t y t o e n g i n e e r m a t e r i a l s p r ecisely at the n a n o m e t e r l e v e l . [ 1 ] S i m i l a r l y , K . E r i c D r e x l e r u s e d “ n a n o t e c h n o l o g y ” i n t e r c h a n g e a b l y w i t h “ m o l e c u l a r t e c h n o l o g y ” ( n o w r e f e r r e d t o a s “ m o l e c u l a r m a n u f a c t u r i n g ” ) i n h i s b o o k “ E n g i n e s o f C r e a t i o n . ” I n i t , D r e x l e r p l a c e d h i s n a n o t e c h n o l o g y f o c u s on molecular m a c h i n i n g s a y i n g t h a t t h e “ n e w t e c h n o l o g y w i l l h a n d l e i n d i v i d u a l a t o m s a n d m o l e c u l e s w i t h c o n t r o l a n d p r e c i s i o n . ” [ 2 ] B o t h o f t h e s e s i m i l a r d e f i n i t i o n s a r e d e s i g n e d t o m a k e a d i s t i n c t i o n b e t w e e n “ n a n o t e c h n o l o g y ” a n d “ b u l k t e c h n o l o g y . ” T o b e s u r e , t h e “ b u l k ” style of technology has led to many great accomplishments. We make wonderful computing devices, ultra-strong steel, and very pure ceramics. Using bulk technology we can make exquisitely small devices and materials. However, we still do it by cutting, chipping, pounding, extruding, and performing other such bulk procedures.
2
“ N a n o t e c h n o l o g y ” i s d i f f e r e n t , a c c o r d i n g t o D r e x l e r a n d T a n i g u c h i . “ N a n o t e c h n o l o g y ” starts on the atomic scale and, controlling atomic/molecular placement, it builds up into unique devices and structures. T h i s d e f i n i t i o n o f “ n a n o t e c h n o l o g y ” i s u s e f u l i n o u t l i n i n g a p h i l o s o p h i c a l difference between previous technologies and the current developments. However, it should be expanded in order to include some aspects of nanotechnology as it is practiced today. It has been discovered in recent years that many materials have extremely unique properties when they are developed at a nanoscale. Many materials also configure themselves in different crystallographic structures not seen in a bulk form of the same material. Many of these properties are different regardless of whether it was formed from the bottom up or from the top down. 1.1.2 The Current Direction of Nanotechnology Research What then is the current, dominant direction of nanotechnology research? The answer is the development, characterization, and functionalization of nanomaterials. Nanomaterial development represents a critical component in achieving the goals of nanotechnology. As the material used becomes central to the makeup of the device (as is the case in nanotechnologies), the properties of that material become central as well. Indeed, in nanotechnology, material, structure, and device are virtually indistinguishable from each other. Nanomaterials have actually been important in some sense in the materials field for some time. For example, nano-sized carbon black particles have been used to reinforce tires for nearly 100 years. Another, more common example, is precipitation
3
hardening. This accidental discovery in 1906 allowed for significant improvements in the strength of aluminum. At the time, researchers could not image the precipitates, but it was discovered later that nanoscale precipitates were the source of this hardening. The advent of the electron microscope allowed for a better understanding of the structure of the precipitates and, thus, allowed for improvements through composition selection and intelligent processing techniques. Today, this tradition is continued, but in some more engineered techniques. Clearly the current direction of nanotechnology research focuses on materials research and development. Nanoscience and nanotechnology are fields that are still in their early stages. Envisioned to change almost everything about how we manufacture and approach technology, it is a technological development that is well anticipated and significantly hyped. The current explosion of interest in the field began with the characterization of carbon-based nanotubes in 1990. This discovery set off a flurry of study on other one dimensional nanostructures, materials that have one growth direction that is significantly faster than all other growth directions; two directions are confined to the nanoscale range. Examples of one-dimensional nanostructures include nanotubes, nanowires, nanobelts, and nanorods. Two dimensional nanostructures have two fast growth directions, so that only one direction is contained to nanoscale dimensions. Examples of these include nanosheets and self-assembled monolayers. Zero dimensional nanostructures have all directions confined to nanoscale dimensions. These include quantum dots and nanoparticles. What makes all of these interesting is that the materials exhibit significantly enhanced or altered properties because they are confined to the nano-scale. Because of this change in properties, developing control over these materials has been the
4
significant thrust of research in nanotechnology for the past decade. The basic physical and chemical concepts that govern the interactions at play with nanotechnology are not fully understood. This is why a bulk of the research aims at discovering novel properties, unique structures and morphologies, or basic commercial device fabrication using nanostructures. If nanoscience and nanotechnology are to continue to make a lasting scientific impact, the fundamental concepts and basic theoretical constructs governing materials design and property must be unearthed. Positioning and patterning nanostructures will play an important role in the incorporation of these structures into device fabrication, as they provide for a significant amount of ease in scaling up production of nanostructures for industrial use and design of specific patterns and architectures of nanomaterials. Some progress has been made on positioning of nanomaterials, however, rational control and design their properties has proven somewhat difficult. This is a case where one of the greatest strengths of nanotechnology is also one of its greatest detriments. Changing the size of a material by only a few nanometers can have a significant impact on the properties of that material, allowing for a great variety and uniqueness to new designs. However, a deviation in the size of a material by only a few nanometers can have a significant impact on the properties of that material, strongly limiting the margin of error allowed. When measuring properties of a material on a nanoscale, there is a strong correlation between the dimensionality of the material and the physical (or chemical) properties. For example, as will be highlighted later, a small change in the size of quantum dots (on the order of 5 nanometers) can shift their luminescence from the red end of the visible light spectrum to the blue end. Therefore, the precision required to
5
control the dimensionality within a few nanometers or less is necessary for the development and use of nanomaterials. In part motivated by a desire to understand these basic concepts, the research described in this thesis aims at discovering the basic mechanisms controlling the synthesis and formation of a specific group of II-VI semiconducting nanostructures. In particular, this thesis examines one-dimensional nanostructures (such as nanobelts and nanowires) and different morphologies that result from the interesting properties that the materials have at the nanoscale. The goal was systematically to investigate the experimental parameters that led to different morphologies and affected the structure property relationship of these nanostructures. Although the first nanobelts synthesized were transparent semiconducting oxides (ZnO, CdO, In2O3, Ga2O3, and SnO2),[3] this thesis will focus on non-oxide nanostructures. Each of these semiconductors has a stable or metastable wurtzite crystal structure. The main focus of the research was on CdSe and ZnS, with the bulk of the research being conducted on ZnS nanostructures. These materials were chosen for their potential for extensive research, their possible applications in optoelectronics, their potential to form the wurtzite crystal structure, and the potential generalization of results to other nanomaterials. Therefore, the primary focus of this thesis will be on the morphology, growth, and structure of nanomaterials. The goal is to understand the mechanisms that determine the different growth factors of the nanostructures and use that understanding for a rational design and growth of useful nanomaterials. Controlling the morphology is important to
6
controlling the physical, electronic, and chemical properties of materials. Even when chemically identical, structures can have significantly different physical properties. For example, wurtzite crystals have an associated dipole moment about their C-axis. Nanobelts can have multiple growth directions, as will be shown, and by tuning the growth direction the dipole moment across the entire nanostructures can be maximized. This dipole moment has an impact on the properties of the material, affecting its usefulness in piezoelectric, optical, and other applications. In order to understand how to tune these properties in the nanostructure, it is necessary to have an understanding of the growth mechanism that dictates the morphology, structure, and rate of growth of the nanomaterial. It is necessary to understand what impact changes to the macroscopic setup in the experiment have on the nanoscopic scale of the nanomaterials. Having a larger understanding and exerting more precise control over the growth of nanomaterials will allow a higher level of selectivity, more control over dimensionality and the type of morphology, easier manipulation, and the simpler incorporation of these structures into a nanotechnological device.
1.2 Nanomaterials The special functionality of materials on the nanoscale has been known for some time. In the natural world, the impact of design on the nanoscale is well known and nature has evolved some very interesting uses for nanomaterials. For example, some bacteria have magnetic nanoparticles inside of them which are used as a compass and help provide a sense of direction to the bacterium.[4] Even larger creatures have taken
7
advantage of nanoscale design. Gecko foot-hair, nanoscale in size, have shown to be central in geckos exceptional ability to climb rapidly up smooth vertical surfaces. The individual hair (seta) operates by van der Waals forces, allowing for great adhesive forces.[5] Even the most basic building blocks of biological things are an example of nanoscale design. Most forms of movement in the cellular world are powered by molecular motors that use sophisticated intramolecular amplification mechanisms to take nanometer steps along protein tracks in the cytoplasm.[6] These are illustrated in Figure 1.1.
Figure 1.1 ( a ) , ( b ) S E M i m a g e o f a g e c k o ‟ s f o o t h a i r , s h o w i n g t h e n a n o s c a l e s i z e o f t h e seta that are small enough to operate using the van der Waals force as an adhesive; (c) color image of a bacteria with magnetic nanowire particles inside that are used as a compass to help orient the bacteria; (d) SEM image of a molecular motor used to take nanometer steps along protein tracks inside the cytoplasm of a cell.
8
Not just used by nature, nanomaterials also unwittingly have been used by artisans for centuries. When gold is significantly reduced in size, it no longer has the yellow-metallic appearance that is most familiar, but it can take on an array of colors.[7] Chinese artisans discovered this when crushing gold to form the red paint that appears on many vases. Separately, medieval artisans in Europe discovered that by mixing gold chloride into molten glass they could create a rich ruby color.[8] By varying the amount of gold put in to the mixture, different colors could be produced. Different sizes of gold and silver nanoparticles are shown in Figure 1.2. Though the cause was unknown at the time, the tiny gold spheres were being tuned to absorb and reflect the sunlight in slightly different ways, tunable to the size of these particles.
Figure 1.2 Nanomaterials have been used unknowingly in stained glass by grinding up gold and silver nanoparticles to small sizes. This figure shows SEM images of gold and silver nanoparticles with sizes ranging from 25 nm to 100 nm. Both gold and silver 9
change their color significantly with size. Silver also can change its color depending on its shape as seen in the difference between the spherical and prismatic 100 nm silver nanoparticles
It was not until the development of electron microscopy that imaging materials at the nanoscale was possible. In order for successful imaging, a material must be at least as large as the wavelength that is being used to image it. For visible light, this is much larger than nanomaterials (400-700 nm). For a typical low voltage scanning electron microscope (SEM) with a beam energy of 5 keV, the wavelength of the electron beam is around 0.0173 nm. For a 100 keV transmission electron microscope (TEM), the wavelength is even smaller, 0.0037 nm. For a 400 keV electron beam, the wavelength is 0.00028 nm. Of course, this is the theoretical limit and the actual resolution of the microscope is never as good as this. Chromatic and spherical aberrations, along with lens defects, astigmatisms, and other practical considerations, combine to significantly reduce the resolution of the microscopes.[9] However, with certain configurations adjusting for astigmatisms and aberrations, these electron microscopes can even distinguish individual atoms. This allows for a great ability to discover and investigate nanomaterials and how their atomic makeup impacts their properties. Electron microscopes also allow for a proper classification of nanomaterials so that they can be discussed in an intelligible and useful manner. Because the main feature of nanomaterials are their small size in some dimensions, nanomaterials have come to be classified by the number of dimensions in which they are confined to the nanoscale. Because of convention, the names have been reduced and in fact refer to the number of
10
spatial dimensions which are not confined to the nanoscale – such is the oddity of scientific naming. As such, two-dimensional nanomaterials are so named because they have been confined to the nanoscale in only one-dimension. One-dimensional nanomaterials are named because they have been confined to the nanoscale in two dimensions. Finally, zero-dimensional nanomaterials are so named because they have been confined to the nanoscale in all three dimensions. 1.2.1 Zero- and Two-Dimensional Nanostructures The focus of this thesis is on one-dimensional nanostructures. However, it is important to understand their context with other nanostructures for several reasons. First, many of the phenomenon that occur in one-dimensional nanostructures occur in zero- and two-dimensional nanostructures as well. Understanding these phenomenon in those structures helps to understand them in one-dimensional nanostructures as well. Second, many architectures and devices will use a combination of the different types of nanostructures. Understanding the similarities and connections between the three types of nanomaterials will allow for a greater understanding of the larger device. 1.2.1.1 Zero-dimensional Nanostructure - Quantum Dots and Nanoparticles One of the early nanomaterials to be extensively studied was the quantum dot (QD). Quantum dots are zero-dimensional nanostructures that are semiconductors. Quantum dots were first theorized in the 1970s and initially synthesized in the early 1980s. If semiconductor particles are made small enough, quantum effects begin to assert themselves. These effects limit the energies at which electrons and holes can exist in the particles. Because energy is related to wavelength of the resulting photon, this means that the optical properties of the particle can be finely tune depending on its size. 11
Quantum mechanics determines that only certain discrete energy levels are allowed within a single atom. If two identical atoms are held at large distances from each other electrons within each will have the exact same energy. As those two atoms are brought closer to one another, they interact, and no two electrons with the same spin can have the same energy. This governing principle is called the Pauli exclusion principle. When a large number of atoms are brought together to form a solid, the discrete allowed energy levels of the individual atoms become a continuous energy band. The generic energy band structure of conductors, semiconductors, and insulators is shown in the figure. These are demonstrated in Figure 1.3. This band structure directly impacts electronic and optical properties. In bulk structures, these properties can only be altered by adding constituents to create defects, interstitials, or substitutions in the material. The impressive phenomenon in QDs is that the optical and electronic properties can by precisely tuned by changing the size of the dots in addition to adding dopants. The electronic and optical properties that were thought to be inherent to a material was transformed when the material was formed in a small enough (nanoscale) size.
12
Figure 1.3 Pictured are the ekectronic band gap structures for metals, insulator, and semiconductors. Ef is the Fermi energy level, the highest energy level at which electrons collect at absolute temperature. As the dimensions of a material decrease in size, quantum confinement effects begin to occur. Quantum confinement is when a material is on the order of or smaller t h a n t h e e x c i t o n B o h r r a d i u s o f i t s c o n s t i t u e n t c o m p o u n d . [ 1 0 ] T h i s r e s t r i c t s e a c h a t o m s ‟ movement, resulting in the above mentioned discrete energy levels and differences in material properties. With QDs quantum confinement effects have a significant impact on the optical properties of the material. One popular quantum dot material is Cadmium Selenide (CdSe). Figure 1.4 shows the very size dependent properties of the CdSe QDs. In the image, each vial is filled with a solution of monodispersed CdSe QDs with the particle size getting smaller from left to right. The result is dramatic.
13
Figure 1.4 These vials contain solutions with different sized monodispersed CdSe quantum dots. On the left is the smaller, sized quantum dots, ranging from blue to red.
Scientists at Bell Labs were some of the first to determine the direct relationship between quantum confinement in zero-dimensional cadmium selenide quantum dots and the induced higher energy shift in the electronic band structure.[11, 12] It was demonstrated that when CdSe was reduced in one, two, and three dimensions to sizes that are on the nanoscale, the energy bands reconfigure to a band structure that resembles individual atoms.[10, 13] That is, on a small enough scale, with a small enough number, groups of atoms act as a single atom. For this reason, quantum dots are often referred to as artificial atoms. Because of its unique properties, quantum dots have some promising potential applications. The more prolific research involves using quantum dots for biological imaging[14, 15] and computing[16] applications. Biological labeling exploits the luminescent properties of the quantum dots and require attaching a functional group to
14
the surface of the QD. The functional group preferentially binds itself to a specific organism, cell, or protein once the system is injected into a biological system. The QDs are then caused to emit light through luminescence or fluorescence, allowing the detection and tracing of the biological targets inside the body.[14, 17, 18] The advantage of using quantum dots for this application as opposed to organic dyes, which is currently used, is that QDs are brighter and more resistant to photobleaching.[19] Zinc sulfide has also plays an important role in quantum dot based nanosensors. Cadmium Selennide is typically an ideal quantum dot material. However, under certain conditions quantum dots with a CdSe core have been found to be acutely toxic to biological cells. In in vitro applications, quantum dots used for labeling have been found to be toxic. This is due to cadmium release into the system. Capping the CdSe quantum dots with a ZnS shell seems to help the toxicity.[20, 21] This coating eliminates all cytotoxicity following exposure of the core-shell quantum dots to air, but UV light still induces some toxicity.[22] Quantum computing makes use of the electronic properties of quantum dots. Jeong et al have linked two quantum dots allowing for semiconductor-based quantum computers.[23] Computers now work by representing information as a series of bits (either one or off, ones or zero). This code is related by transistors. Quantum computers would take advantage of the formation of quantum bits, or qubits, that exist in both the on and off states simultaneously, making it possible for them to process information much faster than conventional computers. This is because a string of quantum bits would be able to calculate every possible on-off combination simultaneously, increasing the comp u t e r ‟ s p o w e r a n d m e m o r y d r a s t i c a l l y . B e c a u s e q u a n t u m d o t s c a n a c t a s a n a r t i f i c i a l
15
atom, each dot can exist in this quantum state and can exhibit the spin state (up or down) that quantum computers would rely on. 1.2.1.2 Two-Dimensional Nanostructure – Thin Films Two-dimensional nanostructures have traditionally been studied and categorized a n d “ t h i n f i l m s ” b e c a u s e o f t h e i r c o n f i n e m e n t t o t h e n a n o s c a l e o n l y i n o n e d i m e n s i o n . They have been developed for use for a significant amount of time in fields as diverse as electronic devices and photovoltaic applications. For example, in the silicon integratedcircuit industry many devices rely on thin films for their operation and control of film thicknesses approaching the atomic level is necessary. Monolayers are used significantly in chemistry. The formation and properties of these layers are reasonably well understood from the atomic level upwards, even in the quite complex layers that are used in lubricants. Significant research is being done in precisely controlling the composition and the smoothness of the growth of these films. Photovoltaic (PV) solar panels consist of several connected direct current PV cells, which are made out of a semiconducting material in between two metallic electrodes. Typically this material is a silicon-based p-n junction[24-26] but other heterojunction materials are also used, most notably indium-gallium-phosphide/galliumarsenide and cadmium-telluride/cadimium-sulfide.[27-31] The cells are encapsulated behind glass to waterproof them. Most PV systems today use mono- or multi-crystalline silicon as the semiconducting material necessity for converting sunlight into electricity. However, a major drawback to using silicon is the high loss of materials during production of the wafers and the efficiency achieved is relatively low. Thin films are one of the main alternatives to standard PV solar cells. Amorphous silicon is one of the most
16
developed thin film materials. Also, newer materials such as Copper Indium diselenide (CIS) is being developed. Cell efficiencies of almost 20% have been achieved with CIS. Another thin film material that has been tested for use in PV cells is CdTe. This is a promising material because of the low cost of production of CdTe thin films, which uses techniques that include electrodeposition and high-rate evaporation. Thin film nanostructures are good for highly efficient conversion of light to electrical power in photovoltaic cell devices due to their large surface area, on which phoelectrochemical processes take place. A large amount of research has investigated synthesizing TiO2 electrodes to improve the PV structure for more efficient electron transport and good stability. Chemical vapor deposition (CVD) of Ti3O5 has been used to deposit layered crystalline anatase TiO2 thin films that are optically responsive and stable.[32] Also, compression of TiO2 powder has been used as a technique to form thin films. However, TiO2 films have add trouble achieving an efficiency of over 10%. So efforts have focused on wide brand gap semiconducting oxide materials such as ZnO and SnO2.[33-38] In addition, combination structures comprised of semiconducting oxide film and polymeric layers for solid-state solar cell devices have been examined in hopes of increasing the overall efficiency. So far, these devices have increased efficiency up to 5% for ZnO devise,[33] 1% for SnO2 devices,[37] and up to 2% for hybrid devices.[39] 1.2.2 One-Dimensional Nanostructures The wire- or rod-like shape of one-dimensional nanostructures has caused them to be the source of somewhat intensifying research of the past several years. In particular, their novel electrical and mechanical properties are the subject of intense research. The category of one-dimensional nanostructures consists of a wide variety of morphologies.
17
These include whiskers, nanowires, nanorods, fibers, nanotubules, nanocables, and nanotubes, among others. Often, the distinguishing features between these are a little arbitraries. Whiskers and nanorods are essentially shorter versions of fibers and nanowires. These one-dimensional structures have been studied for some time. Onedimensional structures with diameters ranging from several nanometers to several hundred microns have been referred to as whiskers and fibers in early literature, whereas nanowires and nanorods are more recent and refer to one-dimensional nanostructures whose width does not exceed 100 nanometers. 1.2.2.1 Nanotubes T h e t e r m “ n a n o t u b e s ” r e p r e s e n t s t w o s e p a r a t e t y p e s o f n a n o s t r u c t u r e . T h e f i r s t i s any structure that appears to be like a nanowire with a hollow center. The side surfaces of the nanotube in this sense may be well-faceted. Many materials have been used to make these structures. Research on one-dimensional nanostructures took-off recently with the pu b l i c a t i o n i n 1 9 9 1 o f I i j i m a ‟ s s e m i n a l p a p e r o u t l i n i n g t h e d i s c o v e r y o f c a r b o n n a n o t u b e s , “ H e l i c a l M i c r o t u b u l e s o f G r a p h i t i c C a r b o n . ” [ 4 0 ] M o r e r e c e n t l y , c a r b o n nanotubes have been reported of being grown up to lengths of several centimeters.[41] The cross-sections of carbon nanotubes are only a few nanometers thick. Carbon nanotubes are made up of a hexagonal network of carbon atoms forming a c r y s t a l l i n e g r a p h i t e s h e e t . T h i s s h e e t i s “ r o l l e d u p ” t o f o r m a t u b u l a r s t r u c t u r e . I f t h e t u b e consists of only a single carbon sheet that meets end on end, then the carbon nanotube is referred to as a single wall nanotube (SWNT). However, if the nanotube consist of multiple sheets rolled up coaxially or if the nanotube roll up somewhat spirally, then the carbon nanotube is referred to as a multi-wall nanotube (MWNT).
18
The other important characteristic of the nanotube is the chirality, or the direction the nanotubes are rolled. The chirality has a large impact on the physical properties.[42, 43] There are three distinct types of nanotubes based on their chirality: chiral, armchair, and zig-zag. The difference between the three is understandable in the idea of a chiral vector and angle. The chiral vector and angle is illustrated in Figure 1.5 on a twodimensional hexagonal lattice.
Figure 1.5 Model of a graphene sheet illustrating the lattice vectors a1 and a2 and the chiral vector Ch. This model helps describe different types of nanotubes.
The chiral vector is determined as Ch=na1+ma2, where a1 and a2 are unit vectors a n d n a n d m a r e i n t e g e r s . T h e c h i r a l a n g l e , θ , i s m e a s u r e d r e l a t i v e t o a 1. Chiral angles between 0° and 30° are known as chiral nanotubes. Armchair nanotubes are formed when 19
n = m a n d t h e c h i r a l a n g l e i s 3 0 ° . I t i s c a l l e d a n “ a r m c h a i r ” n a n o t u b e b e c a u s e t h e p attern the carbon lattice forms when it is rolled this way. Zig-zag nanotubes are formed when either n or m are zero and the chiral angle is 0°. Figure 1.6 depicts a three-dimensional view of each of these types of carbon nanotubes. Chirality is directly related to the electrical conductivity of carbon nanotubes. Armchair nanotubes have an electronic conduction closely resembling that of a metal.[43] In fact, the standard rule is that for a given (n,m) nanotube, if 2n+m=3q (where q is an integer), then the nanotube is metallic. In theory, metallic nanotubes can have an electrical current density more than 1000 times stronger than metals like silver and copper. Alternatively, zig-zag nanotubes tend to have the same electronic properties as a semiconductor, where electrons must overcome a bandgap in order to enter the conduction band.[43] It is this wide range of electronic properties that make nanotubes interesting in the field of electronics.
20
Figure 1.6 Three dimensional models of different chirality nanotubes One interesting phenomenon associated with the metallic-conducting nanotubes is ballistic conduction. Ballistic conduction allows electrons to flow through the nanotube without collisions.[44] Therefore, it has quantized conduction and no energy dissipation. The lack of energy dissipation means that it generates no heat when conducting electrons.[45] The impact of having electronic components that have quantized conduction and generate no heat would be significant for electronic packaging applications. The electronic packaging industry is rapidly approaching the limits of current technology and heat management as miniaturization packs more and more components with increasingly fine feature sizes into and ever-shrinking devices. Carbon
21
nanotubes have the potential to provide a major breakthrough in thermal management with computer technology. Carbon nanotubes also have a novel physical properties. Nanotubes have been s h o w n t o h a v e a Y o u n g ‟ s m o d u l u s a n d t e n s i l e s t r e n g t h v a l u e s i n f a r e x c e s s o f t h e modulus of diamond. In fact, in terms of tensile strength and elastic modulus, carbon nanotubes are one of the strongest materials known to man. This strength results from the covalent sp2 bonds formed between the individual carbon atoms in the nanotube. This strong bond occurs only between carbon atoms within the same graphite sheet. The sheets themselves are loosely bonded together, making them easy to peel off a single sheet. However, the intra-sheet bonds are very strong. MWNT have been tested to have a tensile strength of 63 GPa,[46] far eclipsing high-carbon steel with a tensile strength of approximately 1.2 GPa. The elastic modulus of nanotubes has been measure on the order of 1 TPa.[47] Since carbon nanotubes have a low density for a solid of 1.3-1.4, its specific strength is the best known of materials. Under excessive tensile strain, nanotubes undergo plastic deformation beginning at strains of approximately 5% and can increase the maximum strain the nanotube undergoes before fracture by releasing strain energy.[48] The measurement of these properties are very difficult. Typical measurement techniques are unrealistic for nanoscale materials. To solve this problem of dimensionality, researchers have developed a variety of new techniques for isolating and measuring the properties of a single nanostructure, often in situ TEM experiments.[4951] An example of such a novel technique is seen in an experiment in which a TEM stage holder was create to allow an individual nanotube to be electrically excited into
22
resonance.[52] This is illustrated in Figure 1.7. The resonating nanotube is modeled as a cantilever beam in resonance governed by the theories of classical dynamics. By knowing the resonant frequency and material constants of the nanotube, the bending modulus of an individual nanotube can be calculated. This study revealed that there is a relationship between the radius of the nanotube and the bending modulus. The smaller tube diameters (8 nm) have larger bending modulus (1 TPa) whereas the larger tube diameters (40 nm) have the smaller bending modulus (0.1 TPa). The bending modulus is related to the Y o u n g ‟ s m o d u l u s . S e v e r a l p r e v i o u s s t u d i e s h a v e m e a s u r e d t h e Y o u n g ‟ s m o d u l u s f o r a SWNT at around 1 TPa and the tensile strength for nanotubes has been measured at 30 GPa.[53-56] One of the main causes of these high values is the lack of defects in the carbon nanotubes. This is probably also the reason why smaller nanotubes have higher values. The smaller a material is, the less thermodynamically stable it is for dislocations and line defects to exist within them. Defect concentration has not been directly linked to strength in carbon nanotubes, but it has in other materials.
23
Figure 1.7 An AC potential is applied to a nanotube in situ in the TEM. The frequency is controlled in each in order to measure the harmonic frequencies. (a) no potential is applied; (b) the nanotube is in fundamental resonance; (c) the nanotube is in the second harmonic resonance
The strength and flexibility of carbon nanotubes makes them of wide potential use in nanoapplications. Particularly in controlling other nanoscale structure, which would g i v e t h e m a n i m p o r t a n t r o l e i n e n g i n e e r i n g n a n o t e c h n o l o g i e s . T h e c o n c e p t o f a “ s p a c e e l e v a t o r ” i s a c o m m o n t h e m e u s e d i n d i s c u s s i n g c a r b o n n a n o t u b e a p p lications, as they would have the required tensile strength. However, the nanotubes would have to be
24
p r o t e c t e d b y s o m e s o r t o f s h e a t h , a s t h e m o n o a t o m i c o x y g e n i n t h e E a r t h ‟ s u p p e r atmosphere would erode the nanotubes. Carbon nanotubes have been used in a number of other strengthening applications. They have already been used as composite fibers in polymers and concrete to improve the mechanical, thermal, and electrical properties. Also, it has been found that adding nanotubes to polyethylene increases the polymers elastic modulus by 30%. Carbon nanotubes have been shown to be able to bend to extreme angles without fracture.[57] In concrete, they have been shown to increase the tensile strength and halt crack propogation. Though carbon nanotubes have some properties that make them very appealing to applications, there are some drawbacks to their use commercially. It was stated above that the electronic properties of carbon nanotubes depends mainly on their chirality. Therefore, if nanotubes are to be used in commercial electronic applications, scientists need to be able to control the chirality of the nanotubes synthesized. However, in all the current techniques of nanotube synthesis, this control is not available. In current synthesis, metallic and semiconducting nanotubes are formed side-by-side. This forces developing attempts to separate the types nanotubes post-synthesis. Recently, a technique was reported that successfully separated the types of nanotubes that had been suspended in a solution.[58] This method took advantage of the difference of the relative dielectric constants of the two types of nanotubes with respect to the solvent. Using alternating current dielectrophoresis, the metallic tubes were attracted to the microelectrode array faster, leaving the semiconducting tubes in the solvent. However, in the study, only 100 pg (picograms) of metallic nanotubes was recovered from 100 ng (nanograms) of starting
25
tubes. Though this is too small a quantity to be effective, efforts are ongoing to scale up the process, perhaps by using microfluidic dielectrophoretic separation cells, a common technique in biology. Another issue with the procedure is that during the processing, the nanotubes would bundle to form nanotube fibers. If these fibers contain a combination of metallic and semiconducting nanotubes, the process is inhibited. These difficulties in nanotubes have caused research to explore many other types of one-dimensional nanostructures. Due to both the promise and shortcomings of carbon nanotubes, interest in nanoscience has grown significantly since their discovery in 1991. Some research has been performed on inorganic nanotobes, particularly based on layered compounds such as molybdenum disulphide. They have excellent lubrication properties, resistance to shockwave impact, catalytic reactivity, and they have shown a high capacity for hydrogen and lithium storage. This implies a wide range of applications, including energy storage (for hydrogen applications). 1.2.2.2 Nanowires and Nanorods One particular nanostructure has been the focus of intense research. The progression shifted from the one-dimensional nanostructure nanotubes to other oned i m e n s i o n a l n a n o s t r u c t u r e s , n a n o w i r e s a n d n a n o r o d s . T h e t e r m “ n a n o w i r e ” i s w i d e l y used to represent one-dimensional nanostructures that have a specific axial direction while their side surfaces are less well-defined.[59, 60] Typically, nanowires have a radius that is negligible in comparison to their length. There are two distinct types of nanowires. There are ultrafine wires or linear arrays of dots, formed by self-assembly. Related to n a n o w i r e s a r e “ n a n o r o d s . ” A n a n o r o d i s t y p i c a l l y m u c h s h o r t e r i n l e n g t h t h a n a nanowires. Nanorods show more side facets than nanowires tend to.
26
What differs nanowires and nanorods from nanotubes is the geometry of their cross-section. Nanotubes are hollow and have a cross-section resembling the perimeter of a circle or the outside of a rectangle. Nanowires and nanorods have solid cores. Their cross-section resembles a filled-in circle or hexagon. For the nanowires, the cross-section is typically so small relative to its length that any faceted structure the cross-section may have is negligible. Nanorods, on the other hand, have a length closer to the order of magnitude of their width so that any facets that the cross-section may have. In general, nanorods are a short nanowires, and are therefore considered a simple subgroup of this n a n o s t r u c t u r e . A s s u c h , t h e t e r m “ n a n o w i r e s ” w i l l b e u s e d t o r e f e r t o b o t h n a n o w i r e s a n d nanorods. Nanowires have been successfully synthesized out of a wide range of materials, including titanium oxide,[61] indium oxide,[62] indium-tin oxide,[63] aluminum,[64] and tungsten oxide.[65] In a similar way to quantum dots and nanotubes, one particular nanowire material has been the focus of a large amount of research. Research in nanowires was dominated by silicon nanowires. The main synthesis technique that has been used is physical vapor deposition (PVD). PVD is a process of transferring growth species from a source to a deposition substrate to form a structure. Several mathods have been developed for vaporizing the source species and these will be explored in more detail later. In the case of silicon nanowires, the source material is typically high purity silicon or silicon dioxide.[60, 66, 67] One major benefit of silicon nanowires over carbon nanotubes is the electronic structure. Whereas nanotubes are either metallic or semiconducting depending on the chirality, silicon nanowires are always semiconducting.[68] This characteristic makes
27
silicon nanowires immediately useful, bypassing the hurdle that carbon nanotubes faced as there is no need for separation of different electronic types of nanowires. However, a major drawback to silicon nanowires is that silicon forms an unavoidable passivation layer of silicon dioxide (SiO2) – silica – when silicon is in an oxidizing atmosphere such as air. Just as this is true for bulk silicon, this occurs with silicon nanowires as well. As soon as it is exposed to an oxygen atmosphere, a silicon nanowires becomes encased in a sheath of amorphous SiO2.[60, 69] This is illustrated in Figure 1.8. The problem with this is that SiO2 is electrically insulating and this can affect any semiconducting properties that the silicon nanowire might have.
Figure 1.8 High-resolution TEM images of (a) 6.7 nm, (b) 10.7 nm, and (c) 20.6 nm diameter Si nanowires grown by the dissociation of silane. (d) A silicon nanowire grown by sublimation of SiO2, with SiO2 shell
28
Silicon nanowires have other issues facing them. TEM studies have revealed that silicon nanowires are sometimes made of polycrystalline cores and can have dislocations and defects incorporated into the nanostructures.[59, 70] This hinders electron and hole transport through a material; ideally, a material should be single-crystal and defect free for electronic applications. The grain boundaries in polyucrystalline materials, as well as any dislocations, serve as scattering points in a material. These scattering points not only hinder the electrons from moving through the material, but they also can ruin a materials thermal transport properties. Thermal transport properties are very important in nanoscale electronics. Because of the problems created by the passivating layer, alternative methods of synthesizing silicon nanowires have been developed. Instead of employing a PVD technique, some researchers have used a chemical vapor deposition (CVD) technique, where a chemical reaction in the vapor phase is used to create the deposited nanostructure. In the case of silicon nanowires, a silane (SiH4) gas is used as a source. This dissociates into silicon and hydrogen and the silicon reacts with gold on the deposition substrate to nucleate silicon nanowire growth. This type of synthesis leads to significantly reduced dislocation concentration in the nanowires and consistently produces single-crystal nanowires.[71, 72] However, the issue of the SiO2 passivation layer still exists with this method and a post-synthesis treatment is necessary to remove it. The silicon nanowires must be treated with hydrofluoric acid in order to etch away the SiO2 layer. This etching process leaves a chemically inert hydrogen-terminated surface on the silicon nanowires as seen in Figure 1.9. The inertness of this surface prevents a SiO2 layer from reforming.[73]
29
Figure 1.9 (a) An STM image and schematic of a silicon nanowire after treatment with hydrofluoric acid. (b) A schematic view of SiH3 on the (111) surface of silicon. The red and large blue represents the hydrogen atoms and the silicon atoms in SiH3 while the small blue represents the (111) silicon atoms.
Other nanowires materials have been produced using a wide array of synthesis techniques. Single crystal nanowires of group II-VI and III-V semiconducting materials have been synthesized, without a passivation layer. Also, materials beyond semiconductors such as metals have been formed as nanowires. Beyond PVD and CVD, synthesis methods such as laser ablation and solution-based synthesis, both of which allow complex chemistries beyond binary compounds, have been used to form several types of nanowires.[74, 75] 1.2.2.3 Nanobelts One of the more distinguishing features of nanowires is their very large length with respect to their width, making the sides essentially non-faceted. One of the more distinguishing features of nanorods is that their sides are faceted, but their length is comparable with their width. There is a type of one-dimensional nanostructure that combines the length of nanowires with the faceted structure of nanorods. This structure is
30
the nanobelt. Nanobelts, often referred to as nanoribbons, have two of their dimensions confined to the nanoscale, with the third dimension being relatively very long. However, unlike nanowires, they exhibit faceted side surfaces, so that their cross section is rectangular. Pan et al. first reported transparent semiconducting oxides synthesized in a beltl i k e m a n n e r i n 2 0 0 1 . T h e r e p o r t e d m a t e r i a l s u s e d t o s y n t h e s i z e t h e s e “ n a n o b e l t s ” w e r e ZnO, CdO, In2O3, Ga2O3, and SnO2.[3] These materials are all transitional metal oxides ranging over three different elemental groups (II-VI, III-VI, and IV-VI) and at least five types of crystallographic structures. Since this first report, nanobelts have also been synthesized in non-oxide semiconductors such as ZnS,[76-79] CdS,[80] CdSe,[81, 82] and ZnSe.[83] Nanobelts have several unique properties that make them amenable to study and for use in technology. In general nanobelts can be synthesized as single crystals that are relatively long (about one-two mm). They have a rectangular cross-section that is generally uniform through the length of the belt.[84] The width of the nanobelts can range from as much as one hundred nanometers to as little as six nanometers.[85] They typically have a thickness to width ratio of about one-to-ten. The aspect ratio has also been measured and ranges from about five-to-one to ten-to-one (width to thickness ratio). Though stacking faults may be present, the nanobelts are also essentially dislocation and defect-free. So even if a stacking fault is present, it typically does not terminate within the nanobelt structure and provide a location for scattering processes to occur. Because of the extremely high surface area to volume ratio, the presence of a dislocation is not energetically feasible. Nanobelts also have well-defined crystallographic planes.[3] This
31
means that not only is the fastest growth direction well-defined, but also the top and bottom (along the width) planes and the side (along the thickness) planes are well-defined crystallographic planes and are synthesized along well-defined directions. This allows for tuning of properties and of catalytic surfaces and can have a profound effect on the structure and properties of the synthesized material. It is important to note some of the ways in which nanomaterials differ from their bulk counterparts. One example in nanobelts has to do with their extreme flexibility. Many nanobelts are made of ceramic materials, notorious for their rigidity. However, at the nanoscale nanobelts are very flexible, enduring great strain without breaking. This strain is also fairly reversible; because of the lack of presence of dislocations the nanobelts should be extremely resistant to fatigue and failure.
32
Figure 1.10 TEM images of ZnO nanobelts showing their geometrical shape. (A),(B),(C) TEM images of several straight and twisted ZnO nanobelts (D) Cross-sectional TEM image of a ZnO nanobelt, showing a rectanglelike cross section (E) TEM image of a nanobelt. The inset shows the electron diffraction pattern
In some properties, nanobelts are not all too different from some of their more heavily researched cousins in one-dimensional nanomaterials, nanowires and nanotubes. All three can be synthesized to varying lengths. All three have been shown at varying thicknesses (or diameters). Nanowires and nanobelts can controllably be synthesized along a single crystallographic growth direction. Reliably, nanowires and nanobelts can be synthesized with a precise electronic band structure. However, the differences between the nanostructures are significant. Notably, nanowires often contain defects and dislocations. Mechanically, the presence of these contributes to the fatigue of the material as a whole. Electronically, the presence of defects and dislocations in a material can decrease electron transport due to the increase in possible scattering sites. This decreases both the speed of response and the sensitivity of devices made with the nanowires. This also decreases their usefulness in lasing applications. Nanobelts have shown to have significant use in such applications, even exhibiting a degree of tunability over certain wavelength.
1.3 II-VI Wurtzite Semiconductors Though nanostructures are formed out of many different types of structure, the main focus of this thesis will be nanostructures of the II-VI semiconductor materials. Most of the II-VI semiconductors can form, with some degree of stability in bulk, the 33
wurtzite crystal structure. This crystal structure offers several benefits to the formation of and the physical properties of nanomaterials. 1.3.1 II-VI Semiconductors There are generally recognized eight II-VI semiconductor materials. They are ZnO, ZnS, ZnSe, ZnTe, CdO, CdS, CdSe, and CdTe. Mercury, the other group IIB metal, forms a liquid at standard temperature and pressure (STP) and therefore is not generally included in this list. Because of their uses in optoelectronic and semiconducting applications, II-VI semiconductors have recently been the focus of intense research in nanomaterials. The II-VI semiconductors are typically wide band gap materials, serving as efficient light emitters. This makes them likely candidates to replace materials such as GaN in light emitting diodes (LED).[86] Each of the II-VI semiconductors demonstrate some unique properties, making them useful for unique applications. ZnS has a band gap of 3.54 eV for the zinc blende phase and 3.91 eV for the wurtzite phase.[87] It displays a high refractive index of 2.2 and a high transmittance of light in the visible region of the spectrum.[88-90] These properties make ZnS a strong candidate for optoelectronic devices. Nanostructures of II-VI semiconductors have also been shown to have some unique properties. CdS nanowires have functioned as Fabry-Perot optical cavities and these nanowires have been used as electrically driven lasers.[91] Also, CdSe nanorods can have up to 100% polarized luminescence and could be used as nano-emitters or high resolution detectors of polarized light.[92]
34
This thesis will focus on two particular non-oxide II-VI semiconductors, as they have offered the most potential for nanostructure applications. A brief portion of the thesis will first be given to CdSe nanostructures including a short consideration of the generalizability of some growth results of CdSe. Then, the bulk of the thesis will consist of a discussion of ZnS nanostructures, which have been focused on due to the excellent optoelectronic and phosphor properties of ZnS. 1.3.1.1 Cadmium Selenide - CdSe Cadmium Selenide is an important II-VI semiconducting compound. As discussed above, CdSe quantum dots are among the most extensively studied quantum dot structure. This is due mainly to its size-tunable optical properties. CdSe has been used as a model system for investigating a wide range of nanoscale processes.[93] CdSe has also been synthesized as self-assembling semiconductor nanocrystal superlattices.[94] The direct band gap of 1.8 eV makes CdSe useful for a wide-array of applications, including laser diodes,[95] nanosensing,[17] and biomedical imaging.[14] Until recently, there were few reports of one-dimensional CdSe nanostructures, as the research had been confined to quantum dots. However, CdSe has now been recognized as a useful one-dimensional nanostructure. Shape controlled synthesis of CdSe nanorods along with template-assisted synthesis of CdSe nanowires and nanotubes have been demonstrated.[96-98] Even more recently, CdSe nanobelts, nanosaws, and nanocombs have been synthesized through a simple vapor deposition process.[81, 82, 84] These studies have formed the basis of the research presented in this thesis with CdSe. 1.3.1.2 Zinc Sulfide - ZnS
35
Wurtzite ZnS is a direct wide band gap (3.91 eV) semiconductor that is one of the most important materials in photonics. This is because of its high transmittance in the visible range and its high index of refraction (about 2.2). ZnS has been synthesized as nanowires, nanobelts, nanocombs, and, most recently, nanohelices.[78, 79, 99, 100] All of these are one-dimensional nanostructures. Recently, ZnS nanobelts have been doped with manganese without changing their crystallography.[101] ZnS doped with manganese (Mn) exhibits attractive light-emitting properties with increased optically active sites for applications as efficient phosphors. Furthermore, single ZnS nanobelts have been shown to facilitate optically pumped lasing.[102] All of these properties make ZnS onedimensional nanostructures attractive candidates for use in devices and other technologies. ZnS is also an important phosphor host lattice material used in electroluminescent devices (ELD), because of the band gap large enough to emit visible light without absorption and the efficient transport of high energy electrons. Electroluminescent display devices consist of several layers. The central layer is a phosphor which emits light when an electric field on the order of 1.5 MV/cm is applied across it. Because of this high field lever, current limiting insulating layers are placed on either side of the phosphor. Finally, electrodes on the top and bottom of the device form the basic capacitive structure. Of course, in order to view the emitted light, at least one of the electrodes is transparent.[103] The ZnS research presented in this thesis represents some of the earliest and more influential work that has been done on one-dimensional ZnS nanostructures. It includes the publication of the first ZnS nanobelts structures. This journal article was featured by
36
Thomson, publisher of the very useful ISI d a t a b a s e , a s a “ f a s t m o v i n g f r o n t ” i n t h e f i e l d of Materials Science. This means that the paper pioneered a field (one-dimensional nanostructures of ZnS) that had the largest percentage increase in number of core papers for Materials Science. This is also measured by the rate of increase in citations to the paper. When it was first featured, the following was reported about ZnS nanostructure: “ A s t h e c u r r e n t r e s e a r c h i s d r i v i n g t o w a r d n a n o -scale phenomena and technology, synthesis of ZnS nanomaterials is of great interest. Quasi-one-dimensional nanostructures of ZnS are attractive because they are candidates for fabricating electronic and optoelectronic nanodevices. This wide band gap compound semiconductor has a high refractive index and a high transmittance in the visible range. Zinc sulfide has two types of crystal structures: hexagonal wurtzite ZnS (referred to as "hexagonal phase") and cubic zinc blend ZnS (referred to as "cubic phase"). Typically, the stable structure at room temperature is zinc blend, with few observances of stable wurtzite ZnS. In this paper, we report the first success of synthesizing stable wurtzite-structured nanobelts, nanocombs, and nanowindmills, using a simple catalyst-free thermal evaporation technique. The structures of these characteristic shapes have been fully characterized. Detailed study on the phase transformation from wurtzite to zinc blend is presented. It is anticipated that t h e s e n o v e l s t r u c t u r e s w i l l h a v e s o m e u n i q u e a p p l i c a t i o n s i n n a n o p h o t o n i c s . ” 1.3.2 The Wurtzite Structure A common characteristic II-VI semiconductors share is a propensity to form into the wurtzite crystal structure given the right conditions.[87] Wurtzite is the most stable structure for CdS and CdSe and the other II-VI semiconductors have previously been observed to exhibit the wurtzite crystal structure when synthesized under the right
37
conditions.[83, 104, 105] The wurtzite structure has a hexagonal unit cell (space group P63mc). It is useful to treat ZnS as a model wurtzite crystal structure, but please realize that anything said about the ZnS wurtzite structure is true of any of the other wurtzite crystal structures. The structure of wurtzite ZnS can be described as a number of alternating planes composed of tetrahedrally coordinated S2– and Zn2+ ions, stacked alternatively along the c-axis (Figure 1(b)). The tetrahedral coordination in ZnS results in non-central symmetric structure and piezoelectricity. Another important characteristic of the wurtzite structure is the polar surfaces of some of its planes. The most common polar surface is the basal plane. The oppositely charged ions produce positively charged Zn-(0001) and negatively charged S-(000 1 ) polar surfaces, resulting in a normal dipole moment and spontaneous polarization along the c-axis as well as a divergence in surface energy. 1.3.2.1 Wurtzite and Zinc Blend The wurtzite crystal structure can be seen in Figure 1.11. It is placed alongside the cubic zinc blend structure in order to illustrate the relationship between the two crystal structures. In fact, the cubic (zinc blend) and hexagonal (wurtzite) crystal structures of ZnS (and other II-VI semiconductors) are quite similar. Consider the zinc blend structure first. The stacking sequence of the close-packed planes (the (111) planes) within the zinc blend crystal can be represented by a sequence of ABCABCABCABCABC. Each letter represents a different placement of the plane. This pattern continues through the entire crystal. However, if the stacking sequence of the (111) planes is altered from the ABCABCABCABCABCABC pattern to ABABABABABAB, the crystal structure
38
described is the wurtzite crystal structure. Here, the stacking planes represent the (0001) planes along the c-direction. Because of this close relationship, wurtzite and zinc blend can often be transformed from one to another. Although wurtzite is not stable in bulk ZnS, this hexagonal crystal structure can be formed at elevated temperatures.[106] The transformation from zinc blend to wurtzite ZnS occurs at 1020 °C. There have been reports of stable wurtzite ZnS, but all of them involved nanoscale materials.[105] This relationship between zinc blend and wurtzite will be explored in greater detail later in this thesis.
Figure 1.11 The zinc blend and wurtzite crystal structures. The blue represents the zinc atoms and the black represents the sulfur atoms.
1.3.2.2 Piezoelectricity
39
Piezoelectricity is an important characteristic for these materials, because the intrinsic asymmetric nature of wurtzite gives rise to a piezoelectric phenomenon.[107] This piezoelectric property in nanobelts lends them to applications such as nanocantilevers in scanning probe microscopy.[108] The use of nanobelt cantilevers could increase the sensitivity ~35-1800 times that of conventional cantilevers. The nanocantilevers could be used in mass, biological, force, thermal, pressure, and chemical sensing applications.[109-111]
Figure 1.12 Piezoelectricity encompasses electric polarization produced by mechanical deformation. The polarization created is proportional to the strain. The images show, from left to right, the wurtzite crystal in its relaxed state, being compressed, and being stretched
40
Piezoelectric materials exhibit a distinct relationship between mechanical strain (either tension or compression) and a voltage across their surface. When compressed or stretched, a piezoelectric material will build up alternate charges on opposite faces, thus acting like a capacitor with an applied voltage. A current is then generated between the faces. Figure 1.12 shows a schematic of the creation of this polarization. Piezoelectricity is determined by the crystal structure. A piezoelectric crystal must fit a couple specific criteria. First, it must have a non-centrosymmetric crystal structure. In geometrical terms, for a crystal structure to be non-centrosymmetric, its space group must not contain an inversion center, where every point (x, y, z) in the unit cell there is an indistinguishable point (-x, -y, -z). Second, the crystal must possess a structural bias under the influence of an electric field and/or a mechanical force. 1.3.2.3 Growth Directions of Wurtzite Nanostructures Structurally, ZnS has three-types of fast growth directions: <2-110> (±[2-110], ±[1-210], ±[ 11-20]); <01-1 0> (±[01-10], ±[10-10], ±[1-100]); and ±[0001]. Together with the polar surfaces due to atomic termination, ZnS exhibits a wide range of novel structures by tuning the growth rates along these directions. Through the successful synthesis of II-VI semiconductors in a nanobelt form, a wide range of mechanical and optoelectronic application may be possible for these materials. This is why II-VI semiconductors and ZnS remain a fast developing area of research. The ZnS wurtzite crystal also has the interesting feature of having several different low-index planes that terminate with either a positively charged Zn cation or, on the opposite side, a negatively charged S anion. This characteristic of the crystal structure creates polarized surfaces, resulting in a dipole moment and spontaneous polarization
41
along the axis perpendicular to the plane. One plane is the basal plane - (0001). This is also the close-packed plane of the crystal. Though in the bulk this dipole and divergence in surface energy is compensated for by creating facets or massive surface reconstruction, it can be a significant contributor to asymmetric growth in nanostructures.[112-114] By projecting the wurtzite ZnS crystal along the [1-210] direction we can see that another polar surface is present in the (01-11) family of planes. This surface, like the (0001) plane, can also contribute to the final morphology of nanostructures because of its polarity. This can be seen in great detail in Figure 1.13.
42
Figure 1.13 Projection of the wurtzite crystal structure along [110]. The (0001) and (01– 11) polar planes are evident
In addition to the contribution that polarity makes, these surfaces also contribute to anisotropic growth because of the different terminating species that they contain. Zn and S have different chemical potentials and opposite surfaces can have very different growth reactions occur on them.[79, 81, 115] At a nanoscale regime, especially with the single crystals that get produced, these differences get amplified and have a large impact on the anisotropic growth. 43
The specific growth directions and specific reasons for their growth in given applications are always an interplay of complicated procedures. They are also very important to the properties of the nanostructure. As such, in this thesis the growth directions of each structure will be discussed in greater detail when the structure is presented.
1.4 Applications of One-Dimensional Nanostructures When performing research of any kind, it is very easy to get drawn in to the minutiae of any given problem and forget the overall thrust of the research, the problem that it is attempting to address and solve. In pure sciences, often this problem is speculative and for solving a theoretical problem that has no immediate impact or technological application. Of course, one-dimensional nanostructures are of interest for fundamental materials studies. They provide a physical manisfestation of materials at extremes, quasi-infinite lines or strings. Researchers can now test theoretical predictions of material surfaces and gain new insight into what properties really are material specific and which rely on size. However, in engineering and applied science, such as Materials Science and Engineering is, the problem that the researcher is attempting to address typically focuses on applications or the development of new materials for new applications. Therefore, it is always useful to keep in mind the applications for potential nanostructures. This section outlines just a few of the important potential applications for the nanostructures that are discussed later in this thesis.
44
1.4.1 Field Effect Transistors
Figure 1.14 AFM image of nanobelt-based field effect transistor (FET) design and the IV characteristics
By contacting semiconducting one-dimensional nanostructures to metallic electrodes, field effect transistors (FETs) can be produced – allowing the exploration of the electrical properties of the structures. FETs have been fabricated with SnO2 and ZnO nanobelts and with various nanowires using varying techniques.[116] This is shown in Figure 1.14. Methods to create FETs with nanobelts include depositing a nanobelt onto a substrate and then using e-beam lithography to make electrodes or directly applying ethanol-dispersed nanobelts on predefined gold electrode arrays. In both cases a gold layer is used as the back gate electrode and the current-voltage (I-V) characteristics of the FET can be revealed. Nanobelt-based FETs have also been shown to be controlled by
45
ultraviolet light illumination. When a UV light with a wavelength shorter than the band gap of the nanobelt is introduced, an immediate increase in the source-drain current can b e o b s e r v e d . T h i s i n d i c a t e s a s w i t c h f r o m “ o f f ” s t a t u s t o “ o n . ” N a n o b e l t F E T s h a v e b e e n shown to have switching ratios as large as six orders of magnitude, conductivities as high as 15 (ohms-cm)-1, and electron mobilities as large as 125 cm2/V-s. By placing these one-dimensional nanostructure based FETs in different environments, they can be shown to have high quality applications as nanoscale sensors. The high surface to volume ratio of one-dimensional nanostructures makes them potentially far superior to thin films for use. This allows for higher sensitivity as sensors because the faces are more exposed and the small size is likely to produce a complete depletion of carriers into the nanobelt, which typically changes the electrical properties. Some nanobelts have already been successfully shown to be gas sensors by being placed on platinum electrodes. Prompt current changes are observed when certain gases are introduced to the system. These results demonstrate the usefulness for fabricating highly sensitive nano-scale gas sensors using single one-dimensional nanostructures. 1.4.2 Electroluminescent Display Zinc Sulfide is an important phosphor host material, used in thin film, electroluminescent displays, and many other phosphor applications. A typical electroluminescent display device consists of a very basic structure. This architecture is displayed in Figure X.X. There are at least six layers to the device. The first layer is a baseplate and it is usually a rigid insulator like glass. The second layer is a conductor. The third layer is an insulator. The fourth layer is the phosphor material. The fifth layer is an insulator. Finally, the sixth layer is another conductor. Of course, at least one of the
46
conductors must be transparent so that the light can escape the device. Essentially, ELDs a r e s o m e w h a t “ l o s s y ” c a p a c a i t o r s t h a t b e c o m e s e l e c t r i c a l l y c h a r g e d l i k e a c a p a c i t o r a n d then loses its energy in the form of light. The insulator layers are necessary to prevent arcing between the two conductive layers. An alternating current (AC) is generally used to drive an ELD because the light generated by the current decays when a constant direct current (DC) is applied.[117]
Figure 1.15 Architecture for an electroluminescent display (ELD) device
47
Recently, the development of ZnS one-dimensional nanostructures has driven research in to smaller, more precise ELD devices. ZnS serves as the host material and, by doping it with specific materials which serve as emission centers for the light, different color electroluminescence can be achieved. Table X.X provides an overview of the dopants that ZnS can have and the wavelength of light emitted with each. A significant amount of research has gone into doping ZnS nanostructures with manganese in order to develop the electroluminescence of ZnS nanostructures.[101, 118, 119] 1.4.3 Biomedical Applications
Figure 1.17 Scale with the sizes of typical biological entities. Note, that cells are much larger than and biological molecules are on the same size scale as many nanostructures
Because of their size, nanomaterials are especially suited to interface with biological specimen. This is because many cells and cell components are sized in the nanometer to micrometer range. Figure 1.17 illustrates the size ranges of a few typical biological components. Notice that most nanomaterials contain at least one dimension that is smaller than or on the same size order of most of the biomolecules. Nanoparticles can approach close to cells or components and may be coated or functionalized with
48
biomolecules to change their surface chemistry, allowing tagging and manipulation of biologic targets. Magnetic nanostructures offer increased functionality for biomedical applications since they allow action from a distance through optically opaque living tissues via external magnetic field manipulation. They may also resonate in response to a time-varying field, transferring energy from the magnetic field to the particles themselves.[120] Current biomedical applications of various types of nanoparticles include Magnetic Resonance Imaging (MRI) contrast enhancement, cell separation, hyperthermic cancer treatment, drug targeting, genetic screening, disease detection, and others.[121-123] Most recent interest carbon nanotube biocompatibility has arisen out of an observed need to study new biomedical uses of nanomaterials. Recent publications cite work to establish cytotoxicity, blood clearance, solubility, protein binding, and new CNT based architectures for bioprosthetics. Although some early work found unmodified CNTs highly toxic, later studies have found the materials to be well tolerated, especially after functionalization with a variety of active biomolecules.[124, 125] CNTs are appealing in that they have been previously well characterized chemically and physically, and they often exhibit interesting electronic and mechanical properties. A portion of this thesis will consider some of the steps towards studying the biocompatibility and usefulness of ZnS nanostructures. Some research has been conducted into the biodegradation of ZnS nanowires (that is, the degradation of the material over time when submerged in a biofluid).
49
1.5 Summary In summary, this thesis will focus on one-dimensional ZnS nanomaterials, their design, synthesis, and applications. The review above provides the framework for this exploration and the motivation behind it. The review also provides sufficient content to grasp and digest the following chapters of this thesis: the methodology and synthesis of nanostructures and the characterization and applications of them.
50
1.6 References
1. Taniguchi, N. O n t h e B a s i c C o n c e p t o f ‘ N a n o -T e c h n o l o g y ’ . in International Conference of Product Engineers. 1974. Tokyo, Japan: Japan Society of Precision Engineering. 2. Drexler, K.E., Engines of Creation: The Coming Era of Nanotechnology. 1986, New York, New York: Anchor Books. 298. 3. Pan, Z.W., Z. Dai, and Z.L. Wang, Nanobelts of semiconducting oxides. Science, 2001. 291: p. 1947-1949. 4. Matsunaga, T., Y. Okamura, and T. Tanaka, Biotechnological application of nano-scale engineered bacterial magnetic particles. Journal of Materials Chemistry, 2004. 14(14): p. 2099-2105. 5. Autumn, K., et al., Adhesive force of a single gecko foot-hair. Nature, 2000. 405(6787): p. 681-685. 6. Schliwa, M. and G. Woehlke, Molecular motors. Nature, 2003. 422(6933): p. 759-765. 7. Geddes, C.D., et al., Luminescent blinking of gold nanoparticles. Chemical Physics Letters, 2003. 380(3-4): p. 269-272. 8. Chang, K., Tiny is Beautiful: Translating 'Nano' Into Practical, in The New York Times. 2005: New York City, NY. 9. Wang, Z.L. and Z.C. Kang, Functional and smart materials: Structural evolution and structure analysis. 1 ed. 1998, New York City, New York: Plenum Press.
51
10. Bawendi, M.G., et al., Luminescence properties of CdSe quantum crystallites: Resonance between interior and surface localized states. The Journal of Chemical Physics, 1992. 96(2): p. 946-954. 11. Alivisatos, A.P., et al., Electronic states of semiconductor clusters: Homogeneous and inhomogeneous broadening of the optical spectrum. The Journal of Chemical Physics, 1988. 89(7): p. 4001-4011. 12. Brus, L.E., Electron--electron and electron-hole interactions in small semiconductor crystallites: The size dependence of the lowest excited electronic state. The Journal of Chemical Physics, 1984. 80(9): p. 4403-4409. 13. Murray, C.B., D.J. Norris, and M.G. Bawendi, Synthesis and characterization of nearly monodisperse CdE (E = sulfur, selenium, tellurium) semiconductor nanocrystallites. Journal of the American Chemical Society, 1993. 115(19): p. 87068715. 14. Chan, W.C. and S. Nie, Quantum Dot Bioconjugates for Ultrasensitive Nonisotopic Detection. Science, 1998. 281(5385): p. 2016-2018. 15. Bruchez, M., Jr., et al., Semiconductor Nanocrystals as Fluorescent Biological Labels. Science, 1998. 281(5385): p. 2013-2016. 16. Li, X., et al., An All-Optical Quantum Gate in a Semiconductor Quantum Dot. Science, 2003. 301(5634): p. 809-811. 17. Tran, P.T., et al., Use of Luminescent CdSe-ZnS Nanocrystal Bioconjugates in Quantum Dot-Based Nanosensors. Physica Status Solidi B, 2002. 229(1): p. 427-432. 18. Gao, X., et al., In vivo cancer targeting and imaging with semiconductor quantum dots. Nature Biotechnology, 2004. 22(8): p. 969-976. 19. Smith, A.M., X. Gao, and S. Nie, Quantum Dot Nanocrystals for In Vivo Molecular and Cellular Imaging. Photochemistry and Photobiology, 2004. 80(3): p. 377385.
52
20. Parak, W.J., T. Pellegrino, and C. Plank, Labelling of cells with quantum dots. Nanotechnology, 2005. 16(2): p. R9-R25. 21. Ravindran, S., et al., Quantum dots as bio-labels for the localization of a small plant adhesion protein. Nanotechnology, 2005. 16(1): p. 1-4. 22. Derfus, A.M., W.C.W. Chan, and S.N. Bhatia, Probing the Cytotoxicity of Semiconductor Quantum Dots. Nano Letters, 2004. 4(1): p. 11-18. 23. Jeong, H., A.M. Chang, and M.R. Melloch, The Kondo Effect in an Artificial Quantum Dot Molecule. Science, 2001. 293(5538): p. 2221-2223. 24. Green, M.A., Photovoltaics: technology overview. Energy Policy, 2000. 28(14): p. 989-998. 25. Green, M.A., Crystalline silicon photovoltaic cells. Advanced Materials, 2001. 13(12-13): p. 1019. 26.
Green, M.A., Photovoltaic principles. Physica E, 2002. 14(1-2): p. 11-17.
27. Shah, A., et al., Photovoltaic technology: The case for thin-film solar cells. Science, 1999. 285(5428): p. 692-698. 28. Ringel, S.A., et al., Single-junction InGaP/GaAs solar cells grown on Si substrates with SiGe buffer layers. Progress in Photovoltaics, 2002. 10(6): p. 417-426. 29. Batzner, D.L., et al., Stability aspects in CdTe/CdS solar cells. Thin Solid Films, 2004. 451-52: p. 536-543. 30. Romeo, A., et al., Recrystallization in CdTe/CdS. Thin Solid Films, 2000. 361: p. 420-425. 31. Tiwari, A.N., et al., CdTe solar cell in a novel configuration. Progress in Photovoltaics, 2004. 12(1): p. 33-38.
53
32. Thelakkat, M., C. Schmitz, and H.W. Schmidt, Fully vapor-deposited thin-layer titanium dioxide solar cells. Advanced Materials, 2002. 14(8): p. 577-581. 33. Keis, K., et al., Nanostructured ZnO electrodes for dye-sensitized solar cell applications. Journal of Photochemistry and Photobiology a-Chemistry, 2002. 148(1-3): p. 57-64. 34. Karuppuchamy, S., et al., Cathodic electrodeposition of oxide semiconductor thin films and their application to dye-sensitized solar cells. Solid State Ionics, 2002. 151(14): p. 19-27. 35. Tennakone, K., et al., Dye-sensitized composite semiconductor nanostructures. Physica E, 2002. 14(1-2): p. 190-196. 36. Chappel, S., S.G. Chen, and A. Zaban, TiO2-coated nanoporous SnO2 electrodes for dye-sensitized solar cells. Langmuir, 2002. 18(8): p. 3336-3342. 37. Chappel, S. and A. Zaban, Nanoporous SnO2 electrodes for dye-sensitized solar cells: improved cell performance by the synthesis of 18 nm SnO2 colloids. Solar Energy Materials and Solar Cells, 2002. 71(2): p. 141-152. 38. Chen, S.G., et al., Preparation of Nb2O5 coated TiO2 nanoporous electrodes and their application in dye-sensitized solar cells. Chemistry of Materials, 2001. 13(12): p. 4629-4634. 39. Huynh, W.U., X.G. Peng, and A.P. Alivisatos, CdSe nanocrystal rods/poly(3hexylthiophene) composite photovoltaic devices. Advanced Materials, 1999. 11(11): p. 923. 40. Iijima, S., Helical Microtubules of Graphitic Carbon. Nature, 1991. 354(6348): p. 56-58. 41. Zheng, L.X., et al., Ultralong single-wall carbon nanotubes. Nature Materials, 2004. 3(10): p. 673-676.
54
42. Odom, T.W., et al., Atomic structure and electronic properties of single-walled carbon nanotubes. Nature, 1998. 391(1): p. 62-64. 43. Wilder, J.W.G., et al., Electronic structure of atomically resolved carbon nanotubes. Nature, 1998. 391(1): p. 59-62. 44. Lin, M.F. and K.W.K. Shung, Magnetoconductance of carbon nanotubes. Physical Review B, 1995. 51(12): p. 7592-7597. 45. Chico, L., et al., Quantum conductance of carbon nanotubes with defects. Physical Review B, 1996. 54(4): p. 2600-2606. 46. Yu, M.-F., et al., Strength and Breaking Mechanism of Multiwalled Carbon Nanotubes Under Tensile Load. Science, 2000. 287(5453): p. 637-640. 47. Salvetat, J.P., et al., Mechanical properties of carbon nanotubes. Applied Physics A - Materials Science & Processing, 1999. 69(3): p. 255-260. 48. Qian, D., G. Wagner, and W.K. Liu, Mechanics of carbon nanotubes. Applied Mechanics Reviews, 2002. 55(6): p. 495-533. 49. Yu, M.F., et al., Strength and breaking mechanism of multiwalled carbon nanotubes under tensile load. Science, 2000. 287(5453): p. 637-640. 50. Wong, E.W., P.E. Sheehan, and C.M. Lieber, Nanobeam mechanics: Elasticity, strength, and toughness of nanorods and nanotubes. Science, 1997. 277(5334): p. 19711975. 51. Osakabe, N., et al., Time-resolved observation of thermal oscillations by transmission electron microscopy. Applied Physics Letters, 1997. 70(8): p. 940-942. 52. Poncharal, P., et al., Electrostatic Deflections and Electromechanical Resonances of Carbon Nanotubes. Science, 1999. 283: p. 1513.
55
53. Treacy, M.M.J., T.W. Ebbesen, and J.M. Gibson, Exceptionally high Young's modulus observed for individual carbon nanotubes. Nature, 1996. 381(6584): p. 678-680. 54. Falvo, M.R., et al., Bending and buckling of carbon nanotubes under large strain. Nature, 1997. 389(6651): p. 582-584. 55. Salvetat, J.P., et al., Elastic and shear moduli of single-walled carbon nanotube ropes. Physical Review Letters, 1999. 82(5): p. 944-947. 56. Salvetat, J.P., et al., Elastic modulus of ordered and disordered multiwalled carbon nanotubes. Advanced Materials, 1999. 11(2): p. 161-165. 57. Postma, H.W.C., A. Sellmeijer, and C. Dekker, Manipulation and imaging of individual single-walled carbon nanotubes with an atomic force microscope. Advanced Materials, 2000. 12(17): p. 1299. 58. Krupke, R., et al., Separation of Metallic from Semiconducting Single-Walled Carbon Nanotubes. Science, 2003. 301(5631): p. 344-347. 59. Westwater, J., et al., Growth of silicon nanowires via gold/silane vapor-liquidsolid reaction. Journal of Vacuum Science Technology B, 1997. 15(3). 60. Zhang, Y., et al., Bulk-quantity Si nanowires synthesized by SiO sublimation. Journal of Crystal Growth, 2000. 212: p. 115. 61. Lei, Y., et al., Preparation and photoluminescence of highly ordered TiO2 nanowire arrays. Applied Physics Letters, 2001. 78(8): p. 1125-1127. 62. Liang, C.H., et al., Catalytic growth of semiconducting In2O3 nanofibers. Advanced Materials, 2001. 13(17): p. 1330-1333. 63. Nguyen, P., et al., Epitaxial directional growth of indium-doped tin oxide nanowire arrays. Nano Letters, 2003. 3(7): p. 925-928.
56
64. Ono, T., S. Tsukamoto, and K. Hirose, Magnetic orderings in Al nanowires suspended between electrodes. Applied Physics Letters, 2003. 82(25): p. 4570-4572. 65. Qi, H., C.Y. Wang, and J. Liu, A simple method for the synthesis of highly oriented potassium-doped tungsten oxide nanowires. Advanced Materials, 2003. 15(5): p. 411. 66. Yu, D.P., et al., Nanoscale silicon wires synthesized using simple physical evaporation (vol 72, pg 3458, 1998). Applied Physics Letters, 2004. 85(21): p. 51045104. 67. Yu, D.P., et al., Amorphous silica nanowires: Intensive blue light emitters. Applied Physics Letters, 1998. 73(21): p. 3076-3078. 68. Cui, Y. and C. Lieber, Functional Nanoscale Electronic Devices Assembled Using Silicon Nanowire Building Blocks. Science, 2001. 291(5505): p. 851-853. 69. Zhang, X.Y., et al., Synthesis of ordered single crystal silicon nanowire arrays. Advanced Materials, 2001. 13(16): p. 1238-1241. 70. Sunkara, M.K., et al., Bulk synthesis of silicon nanowires using a low-temperature vapor-liquid-solid method. Applied Physics Letters, 2001. 79(10): p. 1546-1548. 71. Cui, Y., et al., Diameter-controlled synthesis of single-crystal silicon nanowires. Applied Physics Letters, 2001. 78(15): p. 2214-2216. 72. Lieber, C.M., One-dimensional nanostructures: Chemistry, physics & applications. Solid State Communications, 1998. 107(11): p. 607-616. 73. Ma, D.D.D., et al., Small-Diameter Silicon Nanowire Surfaces. Science, 2003. 299(21 March 2003): p. 1874-1877. 74. Holmes, J.D., et al., Control of thickness and orientation of solution-grown silicon nanowires. Science, 2000. 287(5457): p. 1471-1473.
57
75. Wang, N., et al., SiO2-enhanced synthesis of Si nanowires by laser ablation. Applied Physics Letters, 1998. 73(26): p. 3902-3904. 76. Jiang, Y., et al., Hydrogen-assisted Thermal Evaporation Synthesis of ZnS Nanoribbons on a Large Scale. Advanced Materials, 2003. 15: p. 323. 77. Li, Q. and C. Wang, Fabrication of wurtzite ZnS nanobelts via simple thermal evaporation. Applied Physics Letters, 2003. 83: p. 359. 78. Ma, C., et al., Nanobelts, Nanocombs, and Nano-windmills of Wurtzite ZnS. Advanced Materials, 2003. 15: p. 228-231. 79. Moore, D., et al., Wurtzite ZnS Nanosaws produced by polar surfaces. Chemical Physics Letters, 2004. 385: p. 8-11. 80. Dong, L., et al., Cayalytic growth of CdS nanobelts and nanowires on tungsten substrates. Chemical Physics Letters, 2003. 376: p. 653. 81. Ma, C., et al., Single-Crystal CdSe Nanosaws. Journal of the American Chemical Society, 2004. 126: p. 708-709. 82. Ma, C. and Z.L. Wang, Road Map for the Controlled Synthesis of CdSe Nanowires, Nanobelts, and Nanosaws— A Step Towards Nanomanufacturing. Advanced Materials, 2005. 2005(17): p. 1-6. 83. Jiang, Y., et al., Zinc selenide nanoribbons and nanowires. Journal of Physical Chemistry B, 2004. 108(9): p. 2784-2787. 84. Ma, C., et al., Nanobelt and nanosaw structures of II-VI Semiconductors. International Journal of Nanotechnology, 2004. 1: p. 431-451. 85. Wang, X.D., et al., Large-scale synthesis of six-nanometer-wide ZnO nanobelts. Journal of Physical Chemistry B, 2004. 108(26): p. 8773-8777.
58
86. Gutowski, J., et al., Excitons in wide-gap semiconductors: Coherence, dynamics, and lasing. Physica Status Solidi B-Basic Research, 2002. 234(1): p. 70-83. 87. Ray, B., II-VI Compounds. 1 ed. International series of monographs in the science of the solid state, ed. B.R. Pamplin. Vol. 2. 1969, Oxford, London, U.K.: Pergamon Press. 268. 88. Jiang, X., et al., Simultaneous in situ formation of ZnS nanowires in a liquid crystal template by gamma-irradiation. Chemistry of Materials, 2001. 13(4): p. 12131218. 89. Yamaga, S., A. Yoshikawa, and H. Kasai, Electrical and Optical-Properties of Donor Doped Zns Films Grown by Low-Pressure Mocvd. Journal of Crystal Growth, 1988. 86(1-4): p. 252-256. 90. Elidrissi, B., et al., Structure, composition and optical properties of ZnS thin films prepared by spray pyrolysis. Materials Chemistry and Physics, 2001. 68(1-3): p. 175-179. 91. Duan, X.F., et al., Single-nanowire electrically driven lasers. Nature, 2003. 421(6920): p. 241-245. 92. Hu, J.T., et al., Linearly polarized emission from colloidal semiconductor quantum rods. Science, 2001. 292(5524): p. 2060-2063. 93. Tolbert, S.H. and A.P. Alivisatos, Size dependence of a first-order solid-solid phase transition - The wurtzite to rock-salt transformation in CdSe nanocrystals. Science, 1994. 265(5170): p. 373-376. 94. Murray, C.B., C.R. Kagan, and M.G. Bawendi, Self-organization of CdSe nanocrystallites into 3-dimensional quantum dot superlattices. Science, 1995. 270(5240): p. 1335-1338. 95. Colvin, V.L., M.C. Schlamp, and A.P. Alivisatos, Light-emitting diodes made from CdSe nanocrystals and a semiconducting polymer. Nature, 1994. 370(6488): p. 354357.
59
96. Peng, X.G., et al., Shape control of CdSe nanocrystals. Nature, 2000. 404(6773): p. 59-61. 97. Peng, X.S., et al., Synthesis of highly ordered CdSe nanowire arrays embedded in anodic alumina membrane by electrodeposition in ammonia alkaline solution. Chemical Physics Letters, 2001. 343(5-6): p. 470-474. 98. Jiang, X.C., et al., Direct synthesis of Se@CdSe nanocables and CdSe nanotubes by reacting cadmium salts with Se nanowires. Advanced Materials, 2003. 15(20): p. 1740. 99. Moore, D., Y. Ding, and Z.L. Wang, Crystal Orientation-Ordered ZnS Nanowire Bundles. Journal of the American Chemical Society, 2004. 126: p. 14372-14373. 100. Moore, D., Y. Ding, and Z.L. Wang, Polar ZnS Nanohelices. 2006, Georgia Institute of Technology. 101. Li, Y.Q., et al., Manganese doping and optical properties of ZnS nanoribbons by postannealing. Applied Physics Letters, 2006. 88: p. 013115. 102. Zapien, J.A., et al., Room-temperature single nanoribbon lasers. Applied Physics Letters, 2004. 84(7): p. 1189-1191. 103. King, C.N., Electroluminescent Displays. Journal of Vacuum Science & Technology A - Vacuum Surfaces and Films, 1996. 14(3): p. 1729-1735. 104. Lefebvre, P., et al., Measurement of the optical band gap and crystal-field splitting in wurtzite CdTe. Physical Review B, 1996. 53(23): p. 15440-15442. 105. Wang, Y.W., et al., Catalytic growth and photoluminescence properties of semiconductor single-crystal ZnS nanowires. Chemical Physics Letters, 2002. 357(3-4): p. 314-318.
60
106. Sharma, R. and Y.A. Chang, Thermodynamic Analysis and Phase Equilibria Calculations for the Zn-Te, Zn-Se, and Zn-S Systems. Journal of Crystal Growth, 1988. 88: p. 193-204. 107. Kong, X.Y. and Z.L. Wang, Spontaneous Polarization-Induced Nanohelixes, Nanosprings, and Nanorings of Piezoelectric Nanobelts. Nano Letters, 2003. 3(12): p. 1625-1631. 108. Hughes, W.L. and Z.L. Wang, Nanobelts as nanocantilevers. Applied Physics Letters, 2003. 82(17): p. 2886-2888. 109. Chen, G.Y., et al., Adsorption-Induced Surface Stress and Its Effects on Resonance Frequency of Microcantilevers. Journal of Applied Physics, 1995. 77(8): p. 3618-3622. 110. Fritz, J., et al., Translating biomolecular recognition into nanomechanics. Science, 2000. 288(5464): p. 316-318. 111. Wu, G.H., et al., Origin of nanomechanical cantilever motion generated from biomolecular interactions. Proceedings of the National Academy of Sciences of the United States of America, 2001. 98(4): p. 1560-1564. 112. Timon, V., et al., Theoretical adlayer surface morphology of wurtzite 2 × 2 reconstructions of the GaN(0001) surface. Journal of Physics: Condensed Matter, 2005. 17(1): p. 17-26. 113. Smith, A.R., et al., Reconstructions of the GaN(0001-bar) Surface. Physical Review Letters, 1997. 79(20): p. 3934-3937. 114. Duke, C.B., Reconstruction of the cleavage faces of tetrahedrally coordinated compound semiconductors. Festkorperprobleme - Advances in Solid State Physics 33, 1994. 33: p. 1-36. 115. Yin, L.W., et al., Self-assembled highly faceted wurtzite-type ZnS singlecrystalline nanotubes with hexagonal cross-sections. Advanced Materials, 2005. 17(16): p. 1972-+.
61
116. Arnold, M.S., et al., Field-Effect Transistors Based on Single Semiconducting Oxide Nanobelts. Journal of Physical Chemistry B, 2003. 107: p. 659-663. 117. Ohnishi, H., Electroluminescent Display Materials. Annual Review of Materials Science, 1989. 19: p. 83-101. 118. 94.
Erwin, S.C., et al., Doping semiconductor nanocrystals. Nature, 2005. 436: p. 91-
119. Topol, A.W., et al., Chemical vapor deposition of ZnS : Mn for thin-film electroluminescent display applications. Journal of Materials Research, 2004. 19(3): p. 697-706. 120. Pankhurst, Q.A., et al., Applications of magnetic nanoparticles in biomedicine. Journal of Physics D-Applied Physics, 2003. 36(13): p. R167-R181. 121. Jain, P.K., et al., Calculated absorption and scattering properties of gold nanoparticles of different size, shape, and composition: Applications in biological imaging and biomedicine. Journal of Physical Chemistry B, 2006. 110(14): p. 7238-7248. 122. Johnsen, M., et al., Chitosan-based nanoparticles for biomedicine. Journal of Biotechnology, 2005. 118: p. S34-S34. 123. Rojas-Chapana, J.A. and M. Giersig, Multi-walled carbon nanotubes and metallic nanoparticles and their application in biomedicine. Journal of Nanoscience and Nanotechnology, 2006. 6(2): p. 316-321. 124. Flahaut, E., et al., Study of the cytotoxicity of CCVD carbon nanotubes. Journal of Materials Science, 2006. 41(8): p. 2411-2416. 125. Sayes, C.M., et al., Functionalization density dependence of single-walled carbon nanotubes cytotoxicity in vitro. Toxicology Letters, 2006. 161(2): p. 135-142.
62
CHAPTER 2 METHODOLOGY AND THEORY
Because this dissertation focuses on the synthesis of one-dimensional nanostructures, a study into the synthesis mechanisms of the nanostructures is important to the understanding and controlling the nanostructures achieved. This chapter seeks to provide a theoretical framework for considering the formation of the nanostructures. Though ZnS nanostructures are the intended focus, every attempt has been made at creating a framework that is broad enough to include other one-dimensional nanostructures. It has been divided into a discussion of the different synthesis techniques, the main synthesis setup for the experiments used in this dissertation, a description of the experimental procedures used, and finally a discussion of various growth models developed to explain one-dimensional nanostructure growth. 2.1 Synthesis Techniques and Growth Mechanisms A variety of methods exist for synthesizing ZnS nanostructures. Broadly, these methods can be divided into vapor deposition techniques and solution-based chemistry techniques. Within vapor deposition, there is a physical vapor deposition and chemical vapor deposition and each method can be subdivided into more specific individual techniques. These synthesis techniques represent the majority of all techniques used for synthesizing nanomaterials, summarized in Table 2.1.[1]
63
Table 2.1 Several Methods for Deposition and Growth Physical Vapor Deposition (PVD)
Chemical Vapor Deposition (CVD)
Solution Based Chemistry (SBC)
Thermal Evaporation Electron-beam RF Induction Resistive Sputtering Focused Ion Beam Radio frequency Magnetron Pulsed Laser Deposition Thermal CVD Low-pressure CVD (LPCVD) Plasma-enhanced CVD (PECVD) Metal-organic CVD (MOCVD) Molecular Beam Epitaxy (MBE) Atomic Layer Deposition (ALD) Hydrothermal Sol-gel
2.1.1 Vapor Deposition Vapor deposition, whereby a vapor is created and is deposited on a deposition substrate, is the most important type of synthesis method. It can be divided and considered based on the method in which the depositing vapor is created. That is, vapor deposition techniques are organized based on if the vapor is created through a physical process or through a chemical process. 2.1.1.1 Physical Vapor Deposition Physical vapor deposition (PVD) is a process in which the vapor is created in a physical manner. The three most important techniques for ZnS deposition are sputtering,
64
pulsed laser deposition, and thermal evaporation. Each of these will be described below, but they share in common that the source material is the same as the intended depositing material and no chemical reactions occur throughout the process. SPUTTERING Sputtering is a physical process whereby atoms in a solid target material are ejected into the gas phase due to bombardment of the material by energetic ions. The ions for the sputtering process are supplied by an induced plasma. A variety of specific sputtering techniques are used to modify the properties of this plasma, and thus achieve different sputtering conditions, including direct current (DC), radio-frequency (RF), magnetron (which utilizes magnetic fields), focused ion-beam, and application of a bias voltage to the target. A schematic of sputter deposition is shown in Figure 2.1.
Figure 2.1 A schematic of sputtering deposition
65
In general, the simplest form of sputtering is DC sputtering, where the substrate and target material are placed inside of a vacuum chamber. An inert gas such as argon is introduced and a DC power supply is used to ionize the gas. The ions are then accelerated towards the target, breaking off the surface atoms of the target. These atoms then condense on a deposition substrate. When applied to ZnS, sputtering has been able to very successfully produce polycrystalline thin films.[2-4] An advantage of sputtering as a deposition technique is that the deposited films have the same composition as the source material. The equality of the film and target stoichiometry might be surprising since the sputter yield depends on the atomic weight of the atoms in the target. One might therefore expect one component of an alloy or mixture to sputter faster than the other components, leading to an enrichment of that component in the deposit. However, since only surface atoms can be sputtered, the faster ejection of one element leaves the surface enriched with the others, effectively counteracting the difference in sputter rates. In contrast with thermal evaporation techniques one component of the source may have a higher vapor pressure, resulting in a deposited film with a different composition than the source. PULSED LASER DEPOSITION During pulsed laser deposition (PLD), a high power laser beam is focused inside a vacuum chamber and forced to strike a target of the desired composition. This vaporizes the material from the target, producing a plume of material with a stoichiometry similar to that of the target material. The vapor plume then deposits onto a deposition a cooler 66
deposition substrate that promotes the nucleation and growth of the desired material. Though PLD is typically used to produce crystalline films, it has been used successfully to produce one-dimensional nanostructures as well. With ZnS, PLD has been used to form nanowires and nanoribbons, as well as multi-component ZnS-SiO2 thin films.[5-7] A schematic of the PLD process is shown in Figure 2.1. PLD can be performed in several different types of chambers. All that is required is a vacuum chamber, a place for the target material, the deposition substrates, and a window through which the laser beam can be transmitted.
Figure 2.1 A schematic of a typical PLD process. Other specific setups are common, but the general design principle is the same.
THERMAL EVAPORATION Thermal evaporation is one of the most common forms of forming ZnS nanomaterials. During a basic thermal evaporation process, the substrate and source
67
materials are placed inside a vacuum chamber. This vacuum can reach pressures as low as 10-9 Torr (an ultra-high vacuum). A heating source is used to heat the source material to its vapor point or above. Upon evaporation, the vapor source will deposit along the substrate in the cooler area of the vacuum chamber. The main difference in the types of Thermal Evaporation techniques have to do with the type of heating used to vaporize the source material. Some examples of heating sources are electron-beam, radio frequency (RF) induction, and resistive heating. Electron beam evaporation is based in the heat produced by high energy electron beam bombardment on the material to be deposited. The electron beam is generated by an electron gun, which uses the thermoionic emission of electrons produced by an incandescent filament (cathode). Emitted electrons are accelerated towards an anode by a high difference of potential. The crucible itself or a near perforated disc can act as the anode. A magnetic field is often applied to bend the electron trajectory, allowing the electron gun to be positioned below the evaporation line. As electrons can be focalized, it is possible to obtain a very localized heating on the material to evaporate, with a high density of evaporation power. In comparison, RF induction uses an alternating current through an induction coil to heat the source material. This current produces a magnetic field which induces eddy currents in the source material. This provides localized heating without any physical contact between the coil and the source material. Resistive heating provides heat by sending an electrical current through a resistive coil and is a nonlocalized heat source as it heats the area around it as well. Therefore, it is commonly used for furnace applications. Resistive sources of heating are the most commonly used for
68
thermal evaporation and have created a variety of ZnS nanostructures.[8-11] This form of heating will be considered in detail later in this chapter. 2.1.1.2 Chemical Vapor Deposition Chemical vapor deposition (CVD) is a process used for the synthesis of nanomaterials in which one or more volatile precursors chemically react and/or decompose on the substrate surface to produce the desired deposit. CVD processes differ from PVD in that a chemical reaction is necessary in creating the desired stoichiometry in CVD whereas in PVD the desired stoichiometry is similar to the source material. Frequently, volatile byproducts of the chemical reaction are produced. Among the more common CVD techniques used to deposit ZnS are thermal CVD, molecular beam epitaxy (MBE), and atomic layer deposition (ALD). In each of these techniques, a vacuum chamber with a gas flow is required. THERMAL CVD Thermal CVD requires pressure near 10-3 Torr and reactions occur sometimes in excess of 900 °C between the supplied gases. Thermal CVD can occur between two gas phase precursors or between a gas phase precursor and a solid phase precursor. Thermal CVD is typically used to form thin films and it is limited by its high required temperatures and the slow deposition rates. However, the method has recently been shown to be able to synthesize ZnS nanotube arrays and, at low temperatures, ZnS nanoribbons.[12, 13] MOLECULAR BEAM EPITAXY
69
In solid-source MBE, ultra-pure elements such as gallium and arsenic are heated in separate quasi-knudsen effusion cells until they each slowly begin to evaporate. The evaporated elements then condense on the wafer, where they may react with each other. In the example, this forms single-crystal gallium arsenide. The process takes place in high vacuum or ultra high vacuum. The term "beam" simply means that evaporated atoms do not interact with each other or any other vacuum chamber gases until they reach the wafer, due to the large mean free path lengths of the beams. The most important aspect of MBE is the slow deposition rate, which allows the films to grow epitaxially (see island growth). However, the slow deposition rates require proportionally better vacuum in order to achieve the same impurity levels as other deposition techniques. A computer controls shutters in front of each furnace, allowing precise control of the thickness of each layer, down to a single layer of atoms. Intricate structures of layers of different materials may be fabricated this way. MBE has been able to form a variety of ZnS nanostructures, including tetrapod nanocrystals and quantum dots.[14, 15] ATOMIC LAYER DEPOSITION ALD is a CVD process in which two complementary are alternatively introduced into the reaction chamber. Typically, one of the precursors will adsorb onto the substrate surface, but cannot completely decompose without the second precursor. The precursor adsorbs until it saturates the surface and further growth cannot occur until the second precursor is introduced. Thus the film thickness is controlled by the number of precursor cycles rather than the deposition time as is the case for conventional CVD processes. In theory ALD allows for atomic level control of thin film thickness and uniformity. For
70
ZnS, typical precursors for forming ZnS:Mn thin films are ZnI2 or ZnCl2 as the Zn source and Mn(thd)(3)(thd=2,2,6,6-tetramethyl-3,5-heptanedionato) as the Mn source.[16] 2.1.2 Solution Based Chemistry Any chemical reaction that requires a solution to occur is a form of solution based chemistry (SBC). Often, some materials with complex stoichiometries are difficult to synthesize via vapor deposition techniques. In these situations, SBC has served as a vital technique in producing these materials. SBC techniques typically provide materials with high yield and uniformity, but a major disadvantage is that there are more point, line, and planar defects than there are in vapor deposition created materials. The most important technique for ZnS synthesis is the sol-gel process. SOL-GEL Sol-Gel techniques incorporate the creation of inorganic networks through the formation of a colloidal suspension in a liquid (sol) and gelation of the solution to form a network in a continuous liquid phase (gel). Precursors for creating these colloids are metla/metalloid surrounded by various reactive ligands. Functionally, three reactions describe the sol-gel process. They are hydrolysis, alcohol condensation, and water condensation. The sol-gel process allows the fabrication of materials with a large variety of properties: ultra-fine powders, monolithic ceramics and glasses, ceramic fibers, inorganic membranes, thin film coatings and aerogels. The sol-gel process has been used to create nanoscale particles of ZnS for phosphor applications.[2]
71
2.1.3 Growth Mechanisms Nanocrystal formation from vapor deposition processes occurs via one of two means or occasionally through both. The vapor can condense directly onto the substrate into a solid state. The vapor also can condense into a liquid, typically alloying with some catalyst particle such as cold and then form a solid. For one-dimensional nanostructures, two mechanism are used to explain this nucleation and growth during vapor deposition. First, is the vapor-solid (VS) growth. The second mechanism is vapor-liquid-solid (VLS) growth. 2.1.3.1 Vapor-Solid Growth Vapor-solid growth is historically based on the formation of whiskers found in metallic samples. Whiskers are a crystalline phenomenon whereby metal grows tiny, filiform hairs on the surface of a deposited metal film. The first observation of whiskers was made in 1946 during the evaluation of electrical component failure. This failure was caused by the formation of cadmium whiskers.[17] Cadmium was the electroplated material of choice for electrical components. Soon after, these whiskers were found in tin as well.[18] Because of their excellent mechanical properties, it was proposed that whiskers were single-crystal and not compounds.[19] In 1954, it was stated that whisker growth occurred by the continual addition of material to the base of a whisker, rather than by addition of material to the tip of the whisker. This was discovered by observing a growing whisker over several weeks.[20] To explain this, dislocation theories were developed. The idea was to construct a dislocation mechanism that moved toward the film surface and deposited a layer of atoms at that surface. However, a lack of microscopic evidence confirming this existence lead to
72
the disuse of dislocation theories.[19] Also, in 1954, it was determined that whisker growth is driven by compressive stresses within the base material.[21] Much of the recent studies on whiskers have focused on the internal stresses on the films from which whiskers grow using x-ray diffraction (XRD).[22-24] Resulting from these recent studies, an Integrated Theory of whisker formation has been developed. Current theoretical approaches to whisker formation and growth integrate historical ideas with new observations. Some of the more prescient points of the Integrated Theory are as follows: (1) Whiskers do not grow from as-p l a t e d m i c r o s t r u c t u r e s . A s e p a r a t e “ w h i s k e r g r a i n ” i s f o r m e d ; ( 2 ) Whisker grains are formed by recrystallization events; (3) Atoms are transported to the whisker grain through a grain boundary network; (4) The driving force for atom transport is a positive stress gradient; and (5) Dislocation mechanisms are probably not relevant to whisker growth.[25]
Figure 2.3 The VS growth process is pictured here, showing first the impingement of the source vapor on the substrate, the formation of a seed, and finally the growth of the nanowires out of the seed.
Because of this great confusion in whisker formation, the vapor-solid growth of one-dimensional nanostructures is not terribly well understood. A portion of this chapter
73
is devoted to developing a model of vapor-solid growth of one-dimensional nanostructures, but it should be understood that the phenomenon is poorly understood in general. The vapor-solid mechanism, pictured in Figure 2.3, is a catalyst-free process whereby the sublimated vapor created by heating the source powder reaches a lower temperature zone in the furnace and deposits on the substrate forming a nanostructure. It should be noted that ultimately it is still unclear if the vapor solidifies in transit or if the vapor directly deposits onto the substrate before forming the nanostructure. However, for several reasons, it seems unlikely that the vapor solidifies in transit. For one, if it solidifies in transit, then we would see this same phenomenon with VLS growth. Also, it i s l i k e l y t h a t “ s e l f -c a t a l y t i c ” b e h a v i o r a i d s t h e g r o w t h o f t h e s e s t r u c t u r e s o n c e t h e initial deposition occurs. Structures observed via scanning electron microscope (SEM) seem to c o n f i r m t h i s , a s a n i n i t i a l “ s e e d ” i s o b s e r v e d o u t o f w h i c h t h e n a n o s t r u c t u r e s o f t e n g r o w . This encourages a weed-like growth, wherein many nanostructures of the same material grow out of the same seed. This can be seen in Figure 2.4.
74
Figure 2.4 (a) Low magnification SEM images demonstrating the weed-like growth of ZnS nanobelts; (b and c) SEM images of the seeds of two different ZnS weeds
2.1.3.2 Vapor-Liquid-Solid Growth The Vapor-Liquid-Solid (VLS) is a catalytic and site specific growth process. The metal nanoparticles become liquid droplets at the growth temperature so they can act as nucleation sites for absorbing the incoming molecular vapor. When the vapor is transported to the region in the furnace, it saturates the liquid catalyst. Since the solubility of the liquid catalyst with the desired material is much greater than the solubility of the solid substrate, the vapor preferentially deposits in the catalyst. As vapor continues to deposit in the catalyst, the liquid becomes supersaturated and a solid is rejected from the bottom. Once the growth temperature drops below the eutectic temperature of the particle
75
and/or the reactant vapor is no longer available, the growth is terminated. This process is shown in Figure 2.5.
Figure 2.5 The VLS growth process is pictured here, showing first the impingement of the source vapor on the metal catalyst, supersaturating it and the growth of the nanowires out of the seed.
The VLS growth mechanism was first proposed as a model for silicon whisker growth in 1964.[26] It was adapted to one-dimensional silicon nanostructures.[27] TEM studies have been able to view VLS growth directly, as can be seen in Figure 2.6.[28]
76
Figure 2.6 In situ TEM images recorded during the process of nanowire growth. (a) Au nanoclusters in solid state at 500 C; (b) alloying initiates at 800 C, at this stage Au exists in mostly solid state; (c) liquid Au/Ge alloy; (d) the nucleation of Ge nanocrystal on the alloy surface; (e) Ge nanocrystal elongates with further Ge condensation and eventually a wire forms (f). (g) Several other examples of Ge nanowire nucleation, (h,i) TEM images showing two nucleation events on single alloy droplet.
In particular for one-dimensional nanostructures, the VLS process works in a straightforward manner. A thin layer of gold, or pre-synthesized gold nanoparticles, are used as a catalyst. The gold catalyst forms liquid alloy droplets once the deposition the eutectic temperature of gold and, for example, zinc sulfide. With constant incoming ZnS vapor, the percentage of ZnS component in the droplet increases and ultimately supersaturates. ZnS is precipitated out at the solid-liquid interface and forms wire- or belt-like nanostructures. Usually, this causes one-dimensional nanostructures to have a solid metal ball at the growth tip. When the substrate has a crystalline surface, like sapphire, the as synthesized nanowires have roots at the substrate and point upwards with the catalyst balls on the tips, which may be a result of epitaxial growth, this has been shown in particular with ZnO.[29] If the surface of the substrate is disordered, such as polycrystalline alumina, then the catalyst balls are at the growth fronts and the nanowires
77
are randomly oriented.[30] Using the VLS growth process, randomly distributed, freestanding one-dimensional nanostructures can also be obtained by evaporating a mixture of the catalyst and source materials. In this process, the formation of the alloy droplets and the growth of the nanostructures occur during the vapor transport. The catalyst can also be introduced indirectly – such as not using a tin metal, but reducing tin oxide mixed in the source material. Because the metal particles are believed to be in a liquid state during the growth, it is believed that the solid state structure of the depositing material may have no influence on the nature of the grown nanowires and nanobelts. However, a recent study on ZnO nanowire and nanobelts using tin as a catalyst seems to indicate that the crystalline orientation of the tin particle can determine the growth direction and the side surfaces of the nanowires and nanobelts.[31] Studies on the interface relationship between catalyst tin particles and their guided zinc oxide nanostructures discover that the tin catalyst not only guides the [0001] growth of the nanowires, but also can guide the [01-10] and [2-1-10] growth of the nanobelts. The key is to minimizing the interface mismatch energy. The results reveal that the interfacial region of the tin particle with zinc oxide nanowire/nanobelt could be partially crystallized during the VLS process, even though the local temperature is much higher than the melting point of tin. This result may have an important impact on the understanding of the physical and chemical processes that fuel VLS growth. VLS growth has several attractive features that make it advantageous over VS growth. First, some level of dimensionality control over than one-dimensional nanostructure can be obtained. The diameter of the catalyst particle directly affects the
78
cross-section dimensionality of the nanostructure.[32] The volume of the solid being precipitated out of the catalyst is limited by the cross-sectional area of the catalyst. In addition to size-control, the VLS mechanism allows for easier achievement of sitespecific growth. The catalyst particles serve as preferential nucleation sites, lowering the energy required to form a nanostructure at that location. This method has led to patterned nanostructures.[33] However, the presence of a metallic catalyst particle can impact the type of growth achieved and the purity of the nanostructure formed. Most synthesis setups allow for both of these kinds of growth, as they are desired for different desired results. 2.2 Synthesis Setup All of the synthesis within this dissertation was performed using a physical vapor deposition by way of thermal evaporation technique. This section will outline the general experimental procedures, as well as the basic workings of the horizontal tube furnace used to synthesize the nanostructures. These procedures are all consistent for all the nanostructures described in later sections, however, the specifics of each individual nanostructure synthesis will be reserved for its respective section. As will be shown, slight changes in the experimental parameters, can have a significant impact on the type of nanostructure that is synthesized. 2.2.1 General Nanomaterial Synthesis The technique that is used for the experiments in this dissertation is a simple thermal evaporation technique, utilized within a single-zone horizontal tube furnace. A schematic of the experimental setup is shown in Figure 2.7. The furnace system used for synthesis consists of three components: The furnace, the tube, and the vacuum system. 79
The furnace used was a Thermolyne 79300 Tube Furnace. Within the tube furnace, eight dependent heating elements are equally spaced to provide heat. Serially-combined, the heating elements form a temperature gradient within the single-zone tube furnace, where the temperature decreases the farther away from the substrate. The elements within the furnace are made from Super Kanthal 33 molybdenum disilicide and are chosen because they form a protective oxide layer at elevated temperatures. The heating rate of the furnace is controlled by a C1 programmable controller with proportional, integral, and derivative (PID) feedback. The C1 is a digital controller with four stored programs of eight segments each possible. Each segment of the program consists of three parts: a ramp rate (ranging from 1 °C/min to 60 °C/min), a temperature set point, and a dwell time (ranging from 0.1 min to 999.9 min). An image of the furnace is shown in Figure 2.8.
80
Figure 2.7 Schematic of the furnace setup used for the synthesis of ZnS nanostructures 81
Figure 2.8 Thermolyne 79300 Single Zone Split Tube Furnace
In order to confine the vapor to a controlled volume, refractory tubes made from 99.8% alumina by Coors Tek are used. Each alumina tube measures 30 inches in length and have a 1.75 inch outer diameter and a 1.5 inch inner diameter. Because the furnace measures only 24 inches in length, the tubes protrude out of the furnace 3 inchis on either side. To prevent sagging of the tubes, braces have been constructed to support the ends of the tubes as well as the water-cooled end caps. The end caps also help deliver the flow gas into the furnace system. Because of the difference between the diameter of the furnace opening and the diameter of the alumina tube, an air gap travels inside the furnace, cooling it. To evacuate the alumina tube, monitor and control the pressure within the chamber, and introduce a carrier gas during synthesis, a vacuum system is used. The system consists of a pump, two pressure gauges, three release valves, and a mass flow controller. A BOC Edwards RV8 Hydrocarbon Rotary Vacuum Pump is used to purge
82
the system of oxygen and pull a vacuum. To reduce leakage of the system, the mechanical pump is connected to the synthesis chamber through a series of aluminum segments of t-bars, cross bars and an end cap. Figure 2.9 provides a schematic of the entire vacuum system. The two water-cooled end caps are connected to the ends of the alumina tube with rubber O-rings to promote a good seal during evacuation. Two digital gauges provide the monitoring system within the chamber. One, a convection gauge is more sensitive and accurate at lower pressures. The other is more sensitive at higher pressures and controls the automatic valve setting as shown in the figure. These valves are necessary because with only the ability to evacuate the system and monitor the pressure, the pressure inside the tube would be directly proportional to the furnace temperature through the ideal gas law. In order to assist the automatic valve in controlling the pressure of the system and help maintain a constant pressure, two more valves are incorporated into the system with coarse and fine adjustments. The coarse valve is a BOC Edwards Diaphragm Isolation Valve whose primary function is to purge the tube during evacuation. The fine adjustable valve is a Cole-Palmer Multi-Turn Needle Valve, used to control the pressure during synthesis. In contrast to the automatic pressure valve, both of these valves are controlled by hand. The gas flow rates are controlled by an Aalborg Mass Flow Controller with an operation range of 0-100 standard cubic centimeters per minute (sccm).
83
Figure 2.9 Schematic of the vacuum system used
84
The first step of any synthesis process is to clean the alumina tube. This is important because the alumina tubes are reused with experiments that use the same materials in order to save on cost. The alumina tubes are purchased from CoorsTek and cost nearly $150 each. The tube is cleaned with acetone, isopropyl alcohol (IPA), hydrofluoric acid, and de-ionized (DI) water. This helps to remove any dust and residual artifacts from previous experiments that may be left in the tube. After cleaning, the tube is dried with compressed air and, if it is stored for any amount of time, the ends are covered with parafilm in order to seal the tube from contamination. The alumina tube is placed in to the furnace before anything is placed inside the tube. Next, the source material is prepared. The source material is weighed using a Denver Instrument XE3100D mass balance and placed onto a high-temperature crucible that has been fashioned out of a piece of an unused alumina tube. This crucible is cut using a diamond cutting wheel. Again, the crucibles are reused with experiments that use the same materials. Another high-temperature crucible is fashioned for the deposition substrates. Here too, crucibles are reused, but only in experiments with similar materials. The purpose of this collection crucible is to easily position the deposition substrates inside the furnace at a particular position. Typically, silicon deposition substrates are used. However, sapphire and alumina have also been used. In some experiments, these substrates have had their surfaces altered, either physically, or by having a metallic catalyst deposited on them. The deposition substrates are placed in specific positions along the length of the collection crucible. In order to slide the source material and the collection crucible into the alumina tube, the parafilm is removed. The source material and collection crucible with the deposition substrates on it are placed in specific positions in the tube. Typically, 85
the source material is placed in the center of the tube, providing for the highest temperature during the experimental run. Once everything is in place, the synthesis chamber is sealed and prepared for evacuation. Thermal evaporation is sensitive to the partial pressure of oxygen within the system. Oxygen influences the type and quality of nanostructures that are synthesized and the volatility of the source material and the stoichiometry of the vapor phase. It has been shown that a small change in the level of oxygen can have a great impact on the nanostructure synthesized.[34] To reduce the oxygen within the chamber, the vacuum pump is turned on while monitoring the pressure through a Pirani Pressure Gauge and controlling the Diaphragm Isolation Valve. To ensure that the purging process does not move the source material onto the deposition substrates, the Diaphragm Isolation Valve is opened slowly. Once a base pressure of the vacuum chamber is acquired at around 10 mtorr (10-2 torr), the system is held for a minimum of 30 minutes to allow for maximum purging of oxygen from the system. After this time, the experimental run begins. The furnace is heated at a specific rate to reach a given temperature in the center of the furnace. This rate is typically between 20 °C/min and 50 °C/min. If the temperature being raised to is significantly above 1000 °C, then the furnace is held at 800 °C for 20 minutes in order for the resistive coils of the furnace to build a protective oxide layer around them. For each experiment a desired temperature and pressure are chosen. Prior to reaching the setpoint, an inert gas (typically either argon or nitrogen) is introduced into the chamber at a specific flow rate. This flow rate is usually around 50 standard cubic centimeters per minute (sccm). This flow gas forces the pressure of the entire system to rise and control over the diaphragm
86
valves enables precisely reaching a specific pressure and maintaining it. Once the furnace reaches its designated temperature and pressure, these conditions are maintained for a specific amount of time. It is important to note that this timing begins when the furnace thermocouple reaches the setpoint. This can be a different temperature than the source material is actually at. After this set amount of time the furnace is turned off. Immediately, the diaphragm valve is opened fully and the flow gas is turned off and the system again pulls a vacuum. Usually, a fan is directed towards the inside of the furnace to enable a speedy cooling time. 2.2.2 Temperature Gradient Measurements As will be seen, the specific temperature of the deposition substrates is important to if and what kind of nanomaterials are synthesized. Therefore, it is important to know the temperature gradient of the furnace for a variety of settings. An S-type thermocouple element (90% platinum, 10% rhodium) sheathed in an alumina sleeve was inserted into the furnace in order to measure the temperature gradient within the alumina tube. For this measurement, the temperature was measured versus distance from the center of the furnace. This was done for a variety of temperature set points. Although these measurements were done at atmospheric pressure, previously unpublished results have verified that the temperature within the alumina tube is relatively independent of the chamber pressure. Figure 2.10 shows the curves that were determined by these measurements.
87
Figure 2.10 Temperature gradient measurements of the single zone furnace
2.3 Growth Model Despite the immense amount of work that has been done in synthesizing novel one-dimensional nanostructures, a surprisingly small amount of work has gone in to developing a theoretical model of the growth and formation of the individual nanostructures. Even though some devices based on one-dimensional nanostructures have already been demonstrated,[35] their development will lag until the growth mechanism of these structures is understood more deeply and can be controlled with more precision. What follows is an effort to investigate the basic growth mechanisms of onedimensional nanostructures. Particular attention is paid to ZnS and the horizontal vacuum tube furnace system. A mass transport model is generally used and was chosen because of the possibility for generalizability to multiple materials and growth systems. This 88
effort is incomplete, but it represents a start that provides some useful insights into the design and control of one-dimensional nanostructures. 2.3.1 Growth Dependences Any intelligible discussion of the vapor phase growth process of ZnS nanostructures requires a detailed description of the process and environment inside the vacuum tube furnace. This allows for an understanding of which parameters direct and indirect control can be exerted and the parameters over which very little control can be exercised. This will allow for an analysis of the advantages and disadvantages in using the thermal evaporation system for one-dimensional nanostructure growth. It will also help determine which parts of the process are important to include in a theoretical model and which are somewhat extraneous. While it is not necessary to rehash the entire setup again, as described above, the parts important to controlling the growth of the materials, over which some control can be exercised, will be examined from that point of view. Several processing parameters, such as source material, temperature, pressure, carrier gas (including gas species and its flow rate), substrate, and evaporation time period, can be controlled and properly need to be selected before and/or during the thermal evaporation process. The source temperature selection mainly depends on the volatility of the source materials and what is needed to vaporize the source. Usually, it is a decent estimate to select a temperature slightly lower than the atmospheric melting point of the source material. For example, ZnS has an atmospheric melting point of 1718 °C. A temperature as low as 950 °C is sufficient to evaporate ZnS inside the tube furnace in lower pressure environments. It is possible to vary this by using different source materials to reach the same deposited material (for example, beginning with Zn and S
89
sources separately). The pressure within the tube furnace should be decided according to the evaporation rate or vapor pressure of the source material and the carrier gas. As shown above, the deposition substrate temperature drops as the distance from the center of the furnace and this position must also be chosen carefully. A change of 25 °C can have a large impact on the synthesized product. It has also been noticed (and will be shown later in this dissertation) that evaporation time can have a large impact on the growth achieved. All of these have been observed experimentally as having an impact on the growth achieved. It is important to determine what control is able to be exerted over the main factors within the system in order to develop an understanding of the growth of individual nanostructures. These main factors are the temperature, the pressure, and the concentration of growth species. 2.3.1.1 Temperature Dependence Because the process is driven by thermodynamics, exploring the dependence on temperature of the growth of one-dimensional nanostructures is vital to understanding the system as a whole. It is sufficient to consider the temperature at two physical points within the system: the source material temperature – the point at which the solid is vaporized – and the deposition substrate temperature – the point at which the vapors condenses and helps form the new solid nanostructure. As shown above, in looking at the temperature gradient of the furnace, these two temperatures are dependent on each other. It may seem somewhat unlikely that the temperature of the source material is directly important to the type of deposition achieved. The source material is raised to a specific temperature of the sole purpose of sublimating the solid into the vapor phase. The extra kinetic energy that the gaseous phase may have due to temperatures increased
90
over this sublimation temperature is probably an insignificant addition to the overall pressure of the system. However, the increased temperature may succeed in altering what type of vapor phase the solid sublimates into and this can have a major effect on the type of structure that is deposited. For example, for ZnS there are two different types of vapor phases that can occur: the stoichiometric phase and a separate dissociated phase. The latter consists of two separate species of zinc and sulfur vapors. These are shown in Figure 2.11. This is an nontrivial difference. Several experiments have been performed to examine the vapor phase and have led to inconclusive evidence.
Figure 2.11 Schematic showing the two possible outcomes of ZnS vaporization – dissociated vapor phases and stoichiometric vapor phases
To begin, results with ZnO have suggested that the materials dissociate only at elevated temperatures. Figure 2.12 illustrates the findings. They show that when the source temperature is elevated beyond what is normally needed, an area of purely zinc nanowires forms (at higher deposition temperatures and closer to the source) and an area of ZnO nanowires also forms. This is not seen at lower temperatures for ZnO. What this 91
suggests is that at normal (lower temperature) synthesis parameters, ZnO does not dissociate into its constituent elements in the vapor phase. However, because zinc metal could simply oxidize to form the ZnO nanowires, this experiment could suggest that elevated deposition temperatures could allow nanowires to form without oxidation.
Figure 2.12 (a) An optical image of a single ZnO synthesis run containing (b) Zn nanowires and (c) ZnO nanowires. (d) The XRD pattern confirming the Zn nanowires
Some experiments have been done with ZnS to determine whether or not dissociation is taking place. Similar experiments to that done with ZnO were attempted and never was a separate zinc nanowire region observed. Another type experiment was necessary in order to shed light on this question. If ZnS is, in fact, forming a zinc vapor and sulfur vapor separately, then the separate evaporation of the two constituents should have the same effect and form the same structures, if all other parameters are the same.
92
So, an experiment was run with the setup shown in Figure 2.13. This experiment was inspired by previous work done with zinc and sulfur.[36] In this, the sulfur and zinc constituent elements are separated, so they form a separate vapor phase. Because zinc and sulfur have much lower melting points than ZnS (419.53 °C and 115.21 °C), a lower central temperature was used – 550 °C. Notice that the zinc powder is placed at this temperature and the sulfur powder is placed at a temperature of about 200 °C.
Figure 2.13 Experimental setup with the Zinc and Sulfur separated, attempting to determine the vapor species that deposits onto the deposition substrates
The results of this experiment are shown in Figure 2.14. In this case, the product revealed is ZnO nanostructures doped with sulfur. Because ZnS is not produced by the separation of the zinc and sulfur sources, this suggests that, when ZnS is the source, dissociation does not occur. However, this experiment also has its flaws. Because of the need to have the zinc powder and sulfur powder so far separated (essentially 20 cm apart), several conditions in the original experiments are not replicated. First, the zinc vapor may deposit long before the sulfur powder does and have more than enough time to oxidize with the residual oxygen in the system. This may block the sulfur atoms from being incorporated into the growing nanostructure. Second, the concentration of the
93
sulfur atoms may be so low at the deposition substrate positions that there is nowhere near enough needed to form a crystal structure with the zinc atoms.
Figure 2.14 SEM image of sulfur doped ZnO nanowires synthesized with the setup in Figure 2.13
What is needed is a way to measure the vapor while the system is running. The best way to accomplish this would be a mass spectrometer. This option was explored in order to answer this question and was eventually abandoned as too expensive and not worth the effort. Because most mass spectrometers require very high vacuums to work (on the order of 10-9 torr), the vapor phase in the tube furnace would have to be sampled out and routed to the mass spectrometer. This is a common process when dealing with room temperature vapor phases. However, the information about the vapor phase in the vacuum tube furnace system is only interesting for elevated temperatures and the probability of separate vapor phases condensing on the side of the sampling tube and not
94
reaching the mass spectrometer for measurement renders the entire sampling useless. A laser based way of measuring the vapor inside the tube furnace could also be of use. However, this too would require a revamping and redesign of the entire vacuum system in order to provide a glass window on both sides of the tube. This also is not worth the expense. As such, the question of whether the vapor dissociates or remains stoichiometric is unsolved. The deposition substrate temperature is extremely important to the actual growth of the nanomaterial (as will be shown later in this chapter). It has been seen that the deposition substrate temperature has a direct effect on the type of nanostructure that is synthesized. Chemical reactions at the deposition substrate tend to follow an Arrhenius relationship, characterized by an activation energy, Ea, especially at the temperature regions that we see with the deposition substrates. The importance of the deposition substrate temperature has been shown by independently heating deposition substrate to selectively allow nanomaterial growth. Most recently, this has been shown with carbon nanotube growth, the resulting growth is shown in Figure 2.15.[37] The effect of deposition substrate temperature will be treated in full during the model.
Figure 2.15 Scanning electron microscope image showing carbon nanotubes growing on the heated portion of an atomic force microscope cantilever. 95
2.3.1.2 Pressure Dependence As stated above, remarkably different structures can be synthesized with relatively little change in the pressure of the system. As will be considered in a later chapter in this dissertation, it has been systematically shown with CdSe that the growth of nanowires, nanobelts, or nanosaws depends greatly on the pressure.[38] In fact, pressure seems to be the main factor controlling what type of growth is obtained (but not controlling whether or not growth of any kind is obtained). Determining optimal measure for each specific nanostructure, it has been determined that secondary growth on the nanostructure, growth perpendicular to the main crystallographic growth direction occurs a t h i g h e r p r e s s u r e s w i t h t h e g r o w t h o f n a n o s a w s a n d n a n o c o m b s w h i l e “ c l e a n e r ” g r o w t h of nanowires and nanobelts occurs at lower pressures. This will be considered in detail below. 2.3.1.2 Concentration Dependence Also of utmost importance is the concentration of the vapor species in the atmosphere as it interacts with the deposition substrate. Typically, the growth of ZnS one-dimensional nanobelts and nanowires results in very few imperfections in the crystal structure. This occurs because the inclusion of the incoming molecules into the crystal structure and the impingement rate of the growth species onto the nanostructure are comparable. However, if the vapor concentration is high enough and the gas-phase supersaturtion is high, the impinging molecules adsorb onto the crystal too fast to be incorporated into the forming structure and defects and stacking faults can be formed within the crystal. 96
The vapor concentration is affected by two things. First, it is the result of a high pressure used in the system. Higher pressure is obtained because of the presence of more molecules. This means that the vapor concentration of the growth species is higher than if we maintained a lower pressure in the system. Second, the vapor concentration is affected by the carrier gas. Within a single experiment, there is a varying gas-phase supersaturation throughout the tube funace. This is illustrated in Figure 2.16.
Figure 2.16 The impact of having a carrier gas present on the concentration of the growth species in the vapor
2.3.2 Atomic Scale Growth Process Using our knowledge of this system, a qualitative model of the growth of ZnS nanostructures on an atomic scale can be developed. The growth of one-dimensional nanostructures is an example of anisotropic growth of a material. Several mechanisms are known to be the cause of anisotropic growth in crystals. They are different growth rates for different facets of a crystal, caused by different surface energies, the presence of
97
imperfections in specific crystal directions such as stacking faults or dislocations, and the accumulation of impurities on specific surfaces.[39] Vapor phase growth is a form of spontaneous growth of one-dimensional nanostructures, sometimes assisted by a catalytic particle. This means that it is a process driven by the reduction of Gibbs free energy of chemical potential. Commonly, reduction of Gibbs free energy is associated with phase transformations or release of stress. However, for the formation of one-dimensional nanostructures, it can lead to anisotropic growth where the crystal grows along certain orientations faster than others. The reduction of Gibbs free energy in the growth of ZnS one-dimensional nanostructures a r i s e s m a i n l y f r o m t h e v a p o r ‟ s r e c r y s t a l l i z a t i o n a s a s o l i d a n d f r o m t h e r e d u c t i o n i n supersaturation of the vapor. Crystal growth can be generally seen as a heterogeneous reaction, proceeding in a general sequence. The steps that are of particular concern are those steps that can be rate-limiting steps (i.e. steps that can effectively slow or stall the growth of the nanostructure), because these steps will determine the growth rate of the nanostructure. These steps, typical in crystal growth processes are displayed in Figure 2.17.
Figure 2.17 A schematic showing the typical steps in crystal growth
98
First, the material diffuses from the source material to the deposition substrate in form of a vapor carried by the carrier gas through the tube. In general, this process is considered to occur fast enough that it is not a rate-limiting process. Then, the vapor species adsorbs and desorbs onto and from the growing surface. The vapor species can also dissociate while it is on the growth surface. Depending on the vapor species and the surface, this may even be an energetically favorable occurrence.[40] Here, the growing surface is at first the deposition substrate but then is the surface of the growing nanostructure. This process can be rate-limiting, especially if the concentration of the vapor species is low. Next, the adsorbed growth species undergoes surface diffusion in which it is either included into a growth site and continue the growth of the nanostructure or it escapes from the surface. This is not considered a rate-limiting step. Then, the surface grows by including the adsorbed species into the crystal structure. This step is irreversible and, when a high concentration of growth species or supersaturation is present, this step is rate-limiting. Finally, by-product chemicals either diffuse or desorb from the growth surface. Please note that this process has been outlined in general for all crystal surface growth without the aid of a metallic catalyst process. In order to add the catalyst particle to this process, and thus account for the VLS process, it is necessary only to add a step before the second step allowing for diffusion of the source species through the liquid droplet. This forces the ideal case of VLS, whereby growth occurs only at the interface between the metal particle and the nanowire. This will be considered in detail later.
99
2.3.2.1 Rate-limiting Steps and the Accommodation Coefficient The rate-limiting steps noted above are the inclusion of the adsorbed species into the crystal structure (surface growth limited) and the adsorption and desorption onto and from the growth surface (adsorption limited). In the case of surface-growth limited nanostructure growth, there is growth driven mainly by the energies of the different crystal surfaces. This can lead to different growth mechanisms and different growth rates on different surfaces. When the growth is adsorption limited, the growth rate is determined in large part by the impingement rate of the growth species onto the growth surface of the nanocrystal. This is directly proportional to the concentration of the growth species in the vapor. Theoretically, the growth of the nanostructure should be surfacegrowth limited with high concentration of the growth species and should be adsorption limited with low concentration of the growth species. In practice, a combination of these two steps provide for the limiting and permitting of growth of the nanostructure. Before continuing, it is useful to define a particular surface specific coefficient k n o w n a s t h e a c c o m m o d a t i o n c o e f f i c i e n t . T h e a c c o m m o d a t i o n c o e f f i c i e n t α i s e x t r e m e l y important to the growth rate of the surfaces of the nanostructure. It is a measure of the average efficiency of the energy exchange that occurs when a gas molecule encounters a solid surface. In the vapor deposition growth model, this is the extent to which the excess energy of the impinging gas molecule is lost in a single collision with the growing surface of the nanostructure. Because this energy is stored thermodynamically, we can define the accommodation coefficient in terms of temperature. '
T
T
T
Ts
100
(Eq. 2.1)
H e r e , T i s t h e t e m p e r a t u r e o f t h e i m p i n g i n g m o l e c u l e , T ‟ i s t h e t e m p e r a t u r e o f m o l e c u l e s that are not accommodated into the crystal structure, and Ts is the temperature of the surface. We can model the encounter using a hard-spheres model pictured in Figure 2.18.[41]
Figure 2.18 The hard-spheres model for the accommodation coefficient
Through an angle average of the encounter, we can get a average value for the accommodation coefficient, 2 1
2
(Eq. 2.2)
w h e r e μ i s t h e r a t i o o f M g to Ms. Though it was developed for monatomic gases, this result gives some good qualitative results for our setup. It shows that the accommodation coefficient depends on the mass differences between the impinging gas molecule and the surface atom it interacts with. This helps to explain the differences in the growth rates of the differing planes as the impinging molecules would interact with a different ratio of the different types of atoms. The closer to 1 the ratio of the two masses is, the higher the
101
accommodation coefficient and, thus, the faster the growth rate. For a more complete d e r i v a t i o n o f t h i s , p l e a s e s e e G o o d m a n ‟ s p a p e r . [ 4 1 ] 2.3.2.2 Growth Rate Determination When the adsorption of the growth species is rate limiting, the growth of the nanostructure is determined by the condensation rate of the vapor, J (atoms/cm2-sec), which is a function of the number of growth species adsorbed onto the growth surface and directly proportional to the vapor pressure (or concentration), P, of the growth species in the vapor.
J
side
P0
2 mkT
(Eq. 2.3)
H e r e , α i s t h e a c c o m m o d a t i o n c o e f f i c i e n t , σ i s t h e s u p e r s a t u r a t i o n ( ( P -P0)/P0) of the growth species in the vapor, P0 is the equilibrium vapor pressure of the growth crystal at temperature T, m is the molecular weight of the impinging growth species and k is the Boltzmann constant. The accommodation coefficient is defined as the fraction of the impinging growth species that is accommodated on the growing surface. It is a surface specific (not a material specific) property. Because it is a surface specific property, it is likely that is has a significant impact on faceted growth and on preferred growth directions of nanostructures. A surface with a higher accommodation coefficient will have a higher growth rate than other surfaces and significant difference in the coefficients between different facets would result in the anisotropic growth seen in nanowires and nanobelts.
102
When the growth of the nanowire is surface growth limited, the picture is more complex and requires a more developed discussion. Much of this theory is adapted from previous studies of MBE growth of thin films. The pioneering BCF theory for nearequilibrium crystal growth on stepped surfaces is a good source to begin this exploration with.[42] Though one-dimensional nanostructure growth is far from equilibrium conditions, the basic findings of BCF theory can be used for insight. When adapted for explaining island growth in thin films, BCF theory approaches the sort of nonequilibrium conditions necessary for studying one-dimensional nanostructure growth.[43, 44] The growth rate is first independent of the concentration of the growth species, though a high vapor concentration will increase the defect formation, such as interstitials and staking faults and may result in a secondary nucleation on the growth surface. Because we wish to determine the growth rate of the one-dimensional nanostructure, it is valuable to consider the steps for surface growth in turn. When a vapor species impinges on a surface, it will condense with an efficiency close to one. As noted in the diagram above, the adsorbed species will then diffuse along the surface for some time and either be included into the growing crystal structure or desorb from the surface. Recent studies have shown that a multi-component adsorbed species can also dissociate while on the surface in an energetically favorable fashion.[40] We can describe the adsorbed molecule in terms of the time it is on the surface and the surface diffusivity before leaving the surface. This will give us the mean diffusion distance,
Ds
, from the site of incidence.
103
1
exp
E des kT
2
Ds
Es
exp 2
kT
(Eqs. 2.4, 2.5)
12 w h e r e ν i s t h e v i b r a t i o n a l f r e q u e n c y o f t h e s p e c i e s o n t h e s u r f a c e ( t y p i c a l l y a r o u n d 1 0
Hz, Edes i s t h e d e s o r p t i o n e n e r g y r e q u i r e d f o r t h e s p e c i e s t o e s c a p e t o t h e v a p o r , Ω i s t h e size of the adsorbed molecule, and Es is the activation energy for surface diffusion. The species diffuses via an Arrhenius process. This gives us a mean diffusion distance of 0
exp
E des
Es
2 kT
2
(Eq. 2.6)
It generally holds that Es≈ 0 . 1 E 5 / 6 Δ H w h e r e Δ H des and Edes≈ evap, evap is the evaporation enthalpy. So we have
exp 2
H evap 2 . 667 kT
(Eq. 2.7)
Because the evaporation enthalpy is lower for low-index, close-packed planes, the diffusion distance will be smaller. It has been shown that the diffusion distance for a (100) plane in a FCC crystal is about 1 order of magnitude higher than for the (111) plane in the same crystal.[45] Furthermore, the dislocation (and growth site) density on the surface of the low-index planes will be lower. The conclusion is that the higher the free energy of the plane, the faster the growth velocity of the plane.
104
Figure 2.19 Coordinate system used in the calculations. The domains s (substrate surface) and w (nanowire side wall), where the two diffusion equations are solved, are indicated, the radius and the height (z = L) of the nanowire.
From the literature we can express the length growth rate of the nanostructure as the contribution from the adatom flux from the nanostructure side to the growth front, tempered by the ratio of the atomic volume of the growth species and the radius of the nanostructure.[46] Using Figure 2.19 as our coordinate system, we have the following: dL side dt
D side
n side L z
rside
(Eq. 2.8)
where rside is the radial size of the one-dimensional nanostructure, nside is the area number d e n s i t y o f a d a t o m s o n t h e s u b s t r a t e s u r f a c e , a n d Ω i s t h e m o l e c u l a r ( o r a t o m i c ) v o l u m e o f the growth species. This equation makes a lot of sense. The rate of growth of a given side of the nanostructure is governed by the rate of impinging atoms and the rate at which the impinging atoms can create an entire layer of the nanostructure. Please note that these 105
equations are for a side of the nanostructure. Typically we think of this as the main growth front of the nanowires, but this formulation could as easily apply to the side facets, should they exist. Also we have that nside is governed by the equation
D side
2
n side
n side
n side
R side
t
(Eq. 2.9)
side
where Dside i s t h e s u r f a c e d i f f u s i v i t y o f a d a t o m s o n t h e s i d e , τ side is the average diffusion time per adatom, and Rside is the effective impingement rate of adatoms on surface. In typical growth, incorporation of the species into the crystal structure dominates d e s o r p t i o n , a s w e s a w a b o v e . S o τ s can be considered to be the average time before incorporation. The explicit expression for the adatom flux from the substrate surface to the nanostructure is given by the following (note: a complete derivation of these results is included in Appendix A; here, the highlights only are given): rside
K1 Js
Rs
side
s s
rside
K0
(Eq. 2.10)
s
So we have,
dL dt
R side
side
Js
side
sinh
L
tanh
L
This gives us the following limit:
106
Js
side
cosh
L rside
(Eq. 2.11)
L dL
D side
dt
side
side
R side
R side
side
rside
rside
(Eq. 2.12)
The first term is the effective diffusion distance of all the adatoms. This is multiplied by the second term, which compares the size of the adatom with the size of the surface on which it is depositing. It is these two factors that determine the growth rate of the nanostructure. It is interesting to note that when the length gets sufficiently large, the Jsside
term falls out, implying that, as expected, the farther the structure grows away from
the substrate, the less important the substrate is in growth. Astute observers will notice that this consideration accounts for only growth of one-dimensional nanostructures without a catalyst particle assisting the growth. However, this consideration can easily be extended to that situation by adding, in Equation 2.9 the term for the contribution from direct impingement on the metal particle. This derivation is shown in full in Appendix A. The resulting limit is as follows: L dL dt
2
R side (1
side
rside
)
(Eq. 2.13)
This result too implies that the farther from the substrate the nanowire grows the less important the substrate is in the growth. It should also be noted that growth with a metallic catalyst particle proceeds much faster than without (that is, VLS growth is faster than VS growth). This is as expected and very consisted with experimental results.
107
F u r t h e r , i f w e t a k e λ a n d J , a s a b o v e , a n d s e t t i n g J e q u a l t o R side in Equation 2.12, as in the steady state, we get the following:
dL dt
side
P0
R side
rside
2
H evap
exp
mkT
2 . 667 kT
rside
(Eq. 2.14)
Grouping the terms that relate to the vapor together and the terms that relate to the substrate and growing nanostructure together, we get
2
dL dt
2
P0
exp rside
mkT
H evap 2 . 667 kT
(Eq. 2.15)
Here, the first term contains factors that are specific to the adsorbed species, size, mass, and super-saturation. Physically, this says that the growth rate of the one-dimensional nanostructure, once a steady state has been reached, increases linearly with the supersaturation of the species in the vapor and with the square of the size of the species. The second term contains factors that are specific to the surface of the nanostructure on which the species impinges. Physically, it means that the growth rate of the one-dimensional nanostructure increases linearly with the accommodation coefficient and the supersaturation of the vapor. It is inversely related with the size of the plane on which the vapor species deposits. It also is inversely related to the temperature. Attempting a similar formulation with VLS growth gives the following:
dL
2
P0
dt
2 mkT
1
exp 2 rside
108
H evap 2 . 667 kT
(Eq. 2.16)
This is not as easily separated into vapor and surface terms as for VS growth, but the general physical meanings still hold. 2.3.2.3 Discussion of the Model The presented above shows that, for growth limited by surface growth and not by adsorption of the growth species, the important controllable factors to the growth rate of the one-dimensional nanostructure are supersaturation of the vapor species and the local temperature of the furnace at the deposition substrate. Neither of these factors are directly controlled in the horizontal tube furnace setup, but both of them can be altered. The concentration of the vapor species can be affected by the distance the deposition substrate is from the source material, the flow gas speed, and the overall pressure of the system. The local temperature is affected by the temperature of the center of the furnace and the distance the deposition substrate is from the center. A competition for the capture of the impinging molecules by different surface planes helps determine the final morphology of the one-dimensional nanostructures. With low vapor concentration, only the fastest growth direction can proceed. Thus, nanowires, with no side facets, are created in this condition. A medium level of super-saturation allows for other directions and planes to develop, thus synthesizing nanobelts. A higher level of vapor concentration allows for an "over-inclusion" of adatoms into the crystal structure. This creates defects, stacking faults, and other such imperfections within the growing nanostructure. These sites serve as preferable nucleation sites for new growth creating nanosaws, nanocombs, and other one-dimensional nanostructures exhibiting secondary, or so-called SPA (Spontaneous Polarization-induced Asymmetric), growth.
109
This theoretical-based analysis and conclusions are consistent with published results. With ZnS, the growth of nanosaws was reported at higher pressure levels and in furnace zones that would correlate to higher vapor concentrations that the growth of ZnS nanowires or ZnS nanobelts [8, 9, 47, 48]. In the first systematic study of its kind on the growth of one-dimensional nanostructures, similar results were reported with CdSe nanostructures.[38] 2.3.3 Other Models of Nanostructure Growth Other models of nanostructure growth do exist and have been explored. One such model is a kinetic evolution model, explored in conjunction with Xiangxing Xu at Fudan University.[49] This model involves a kinetic model for studying the evolution of the morphology of the nanocrystal. This model will not be given a full treatment here in this dissertation, but certain aspects of it will be considered for completeness. It is, as the name suggests, an evolutionary model. This means that it uses an iterative process to determine the morphology of the nanocrystal that is being formed. In it, the concept of relative growth rates in the length (RL) and diameter (RD) directions of the nanowires is introduced. These are defined as the ratio of the growth rate to the overall length of that direction (that is, the growth that has already occurred). It should be apparent that this value is time dependent and monotonically decreasing because the growth rate is relatively constant for a given surface. This can help us look at several stages of growth. In the early stage, when RL>RD, we have clear one-dimensional growth along the length of the nanowire. The aspect ratio can be defined as L/D. Converting this in to terms of time, the growth rates, and RL,D we have that
and also
because
this is an iterative process, we can take L(t)=L0+gLdt where L0 is some starting value and 110
dt is some arbitrary increment of time. So we get that
. After some time
the initial conditions will become so small as to be negligible so that we have that . W h a t t h i s i m p l i e s , i n t h e t e r m s o f X u ‟ s f o r m u l a t i o n , i s t h a t i n s h o r t time (the time to make the initial seed length negligible) the concept of Relative Growth Rates becomes irrelevant as all nanostructures will resort to an aspect ratio that reflects the surfaces actual growth rates. Also, this implies that the larger the seed the more important it is. As this model can begin its application at anytime within the growth after a seed matching the stoichiometry of the finishing product is created, it can begin when this seed is arbitrarily large. Thus, it can explain why rectangular nanowires stay rectangular, why round disks stay disks, etc. However, it is difficult to use it to explain how these seeds gained the shape they have from true starting conditions. This is not meant to imply that this model has no uses for experimentalists. One of the most useful p a r t s o f t h e m o d e l i s t h e a n a l y s i s o f d i f f e r e n t “ i n j e c t i o n s c h e m e s ” i n t u n i n g n a n o c r y s t a l morphology. In this the model can be used to examine delayed introduction of other species (or perhaps just increased concentration of the same species) into the system. Because this would occur after a significant growth (or seeding) of the nanocrystal, initial conditions that determine the shape of the nanocrystal up until that point need not be considered. For example, if it is known, for whatever reason, that a certain starting configuration creates nanorods of a specific aspect ratio, then the model can possibly be used to predict what changes in the system would do to the next stages growth. The biggest drawback of this model is that it is an evolutionary model. Evolution does not describe the beginnings of things but merely how they develop after they have begun. To
111
provide a more complete picture of the entire one-dimensional nanostructure growth, this model could be combined with the one developed earlier in this chapter.
2.4 Summary This chapter began with a description of the various synthesis techniques that are used for creating one-dimensional nanostructures. It then focused on the particular synthesis setup that is used for the synthesizing of the nanomaterials in this dissertation. Next, a growth model based in part on BCF vapor growth of thin films and subsequent thin film growth theory was developed to help explain the anisotropic growth of the onedimensional nanostructures, especially in explaining the various growth rates of the different surfaces. This model was developed with ZnS one-dimensional nanostructures in mind, but has some applicability to other nanostructures as well. Many of the insights into the growth process are qualitative in nature, due to the inexact method of nanomaterial synthesis, but they are nonetheless very important in helping explain different growth types of different nanostructures. Some drawbacks of the model and alternative approaches were discussed.
112
2.5 References
1. Gao, P., Piezoelectric Nanostructures of Zinc Oxide: Synthesis, Characterization, and Devices, in Materials Science and Engineering. 2005, Georgia Institute of Technology: Atlanta, GA. 2. Chander, H., Development of nanophosphors - A review. Materials Science & Engineering R-Reports, 2005. 49(5): p. 113-155. 3. Mandal, S.K., S. Chaudhuri, and A.K. Pal, Optical properties of nanocrystalline ZnS films prepared by high pressure magnetron sputtering. Thin Solid Films, 1999. 350(1-2): p. 209-213. 4. Varitimos, T.E. and R.W. Tustison, Ion-Beam Sputtering of Zns Thin-Films. Thin Solid Films, 1987. 151(1): p. 27-33. 5. Zapien, J.A., et al., Room-temperature single nanoribbon lasers. Applied Physics Letters, 2004. 84(7): p. 1189-1191. 6. Hayden, O., A.B. Greytak, and D.C. Bell, Core-shell nanowire light-emitting diodes. Advanced Materials, 2005. 17(6): p. 701-707. 7. Liu, B., H. Ruan, and F.X. Gan, Characteristics of ZnS-SiO2 film used as phasechange optical disk dielectric layer. Journal of Inorganic Materials, 2003. 18(1): p. 190194. 8. Moore, D., Y. Ding, and Z.L. Wang, Crystal Orientation-Ordered ZnS Nanowire Bundles. Journal of the American Chemical Society, 2004. 126: p. 14372-14373. 9. Ma, C., et al., Nanobelts, Nanocombs, and Nano-windmills of Wurtzite ZnS. Advanced Materials, 2003. 15: p. 228-231.
113
10. Li, Q. and C. Wang, Fabrication of wurtzite ZnS nanobelts via simple thermal evaporation. Applied Physics Letters, 2003. 83: p. 359. 11. Kar, S., S. Biswas, and S. Chaudhuri, Nanometre to micrometre wide ZnS nanoribbons. Nanotechnology, 2005. 16: p. 3074-3078. 12. Zhang, Z.X., et al., Low-temperature growth and photoluminescence property of ZnS nanoribbons. Journal of Physical Chemistry B, 2005. 109(39): p. 18352-18355. 13. Shen, X.P., et al., Template-based CVD synthesis of ZnS nanotube arrays. Chemical Vapor Deposition, 2005. 11(5): p. 250-253. 14. Zhu, Y.C., et al., Nanocable-Aligned ZnS Tetrapod Nanocrystals. Journal of the American Chemical Society, 2003. 125(52): p. 16196-16197. 15. Zhang, J.Z., et al., Fabrication, structural characterization and photoluminescence of Q-1D semiconductor ZnS hierarchical nanostructures. Nanotechnology, 2006. 17(10): p. 2695-2700. 16. King, J.S., et al., High-filling-fraction inverted ZnS opals fabricated by atomic layer deposition. Applied Physics Letters, 2003. 83(13): p. 2566-2568. 17. Cobb, H.L., Cadmium Whiskers. Monthly Review of the American Electroplaters Society, 1946. 33(28): p. 28-30. 18. Compton, K.G., A. Medizza, and S.M. Arnold, Filamentary Growths on Metal Surfaces - Whiskers. Corrosion, 1951. 7(10): p. 327-334. 19. Galyon, G.T. and L. Palmer, An integrated theory of whisker formation: The physical metallurgy of whisker formation and the role of internal stresses. IEEE Transactions on Electronics Packaging Manufacturing, 2005. 28(1): p. 17-30. 20. Koonce, S.E. and S.M. Arnold, Metal Whiskers. Journal of Applied Physics, 1954. 25(1): p. 134-135.
114
21. Fisher, R.M., L.S. Darken, and K.G. Carroll, Accelerated Growth of Tin Whiskers. Acta Metallurgica, 1954. 2(3): p. 368-&. 22. Xu, C., et al., Driving force for the formation of Sn whiskers: Compressive stress Pathways for its generation and remedies for its elimination and minimization. Ieee Transactions on Electronics Packaging Manufacturing, 2005. 28(1): p. 31-35. 23. Zhang, B., et al., Synthesis of mullite whiskers using salt flux method. Chinese Journal of Inorganic Chemistry, 2005. 21(2): p. 277-280. 24. Chen, D.Y., et al., Synthesis of beta-Si3N4 whiskers by SHS. Materials Research Bulletin, 2002. 37(8): p. 1481-1485. 25. Galyon, G.T. and L. Palmer, The Structure and Kinetics of Tin-Whisker Formation and Growth on High Tin Content Finishes, in Handbook of Lead-Free Solder Technology for Microelectronic Assemblies, K.J. Puttlitz and K.A. Stalter, Editors. 2004: New York. p. 851-914. 26. Wagner, R.S. and W.C. Ellis, Vapor-liquid-solid mechanism of single crystal growth. Applied Physics Letters, 1964. 4(5): p. 89. 27. Morales, A.M. and C.M. Lieber, A Laser Ablation Method for the Synthesis of Crystalline Semiconductor Nanowires. Science, 1998. 279(5348): p. 208-211. 28. Wu, Y.Y. and P.D. Yang, Direct observation of vapor-liquid-solid nanowire growth. Journal of the American Chemical Society, 2001. 123(13): p. 3165-3166. 29. Huang, M.H., et al., Room-temperature ultraviolet nanowire nanolasers. Science, 2001. 292(5523): p. 1897-1899. 30. Huang, M.H., et al., Catalytic growth of zinc oxide nanowires by vapor transport. Advanced Materials, 2001. 13(2): p. 113-116.
115
31. Ding, Y., P. Gao, and Z.L. Wang, Catalyst-nanostructure interfacial lattice mismatch in determining the shape of VLS grown nanowires and nanobelts: A case of Sn/ZnO. Journal of the American Chemical Society, 2004. 126(7): p. 2066-2072. 32. Cui, Y., et al., Diameter-controlled synthesis of single-crystal silicon nanowires. Applied Physics Letters, 2001. 78(15): p. 2214-2216. 33. Wang, X. and C. Summers, Large-Scale Hexagonal-Patterned Growth of Aligned ZnO Nanorods for Nano-optoelectronics and Nanosensor Arrays. Nano Letters, 2004. 4(3): p. 423-426. 34. Song, J.H., et al., Systematic study on experimental conditions for large-scale growth of aligned ZnO nanwires on nitrides. Journal of Physical Chemistry B, 2005. 109(20): p. 9869-9872. 35. Cui, Y. and C. Lieber, Functional Nanoscale Electronic Devices Assembled Using Silicon Nanowire Building Blocks. Science, 2001. 291(5505): p. 851-853. 36. Shen, G., et al., Synthesis and Optical Properties of S-Doped ZnO Nanostructures: Nanonails and Nanowires. Journal of Physical Chemistry B, 2005. 109(12): p. 5491-5496. 37. Sunden, E.O., et al., Room-temperature chemical vapor deposition and mass detection on a heated atomic force microscope cantilever. Applied Physics Letters, 2006. 88(3): p. 033107-3. 38. Ma, C. and Z.L. Wang, Road Map for the Controlled Synthesis of CdSe Nanowires, Nanobelts, and Nanosaws— A Step Towards Nanomanufacturing. Advanced Materials, 2005. 2005(17): p. 1-6. 39. Cao, G.Z., Nanostructures and Nanomaterials: Synthesis, Properties and Applications. 1 ed. 2004, London, U.K.: Imperial College Press. 433. 40. Rempel, J.Y., et al., Properties of the CdSe(0001), (000-1), and (11-20) Single Crystal Surfaces: Relaxation, Reconstruction, and Adatom and Admolecule Adsorption. Journal of Physical Chemistry B, 2005. 109(41): p. 19320-19328.
116
41. Goodman, F.O., Thermal Accommodation Coefficients. Journal of Physical Chemistry, 1980. 84(12): p. 1431-1445. 42. Burton, W.K., N. Cabrera, and F.C. Frank, The growth of crystals and the equilibrium structure of their surfaces. Philosophical Transactions of the Royal Society of London, A, 1951. 243(866): p. 299-358. 43. Joyce, B.A., et al., Growth of III-V compounds on vicinal planes by molecular beam epitaxy. Semiconductor Science and Technology, 1990. 5(12): p. 1147-1154. 44. Myers-Beaghton, A.K. and D.D. Vvedensky, Nonlinear diffusion equation for crystal growth on stepped surfaces. Journal of Physical Mathematics A, 1990. 23: p. L995-L1001. 45. Burton, W.K., N. Cabrera, and F.C. Frank, Role of Dislocations in Crystal Growth. Nature, 1949. 163(4141): p. 398-399. 46. Johansson, J., et al., Mass Transport Model for Semiconductor Nanowire Growth. Journal of Physical Chemistry B, 2005. 109(28): p. 13567-13571. 47. Ma, C., et al., Nanobelt and nanosaw structures of II-VI Semiconductors. International Journal of Nanotechnology, 2004. 1: p. 431-451. 48. Moore, D., et al., Wurtzite ZnS Nanosaws produced by polar surfaces. Chemical Physics Letters, 2004. 385: p. 8-11. 49. Xu, X. and D. Moore, A kinetic model for nanocrystal morphology evolution. 2005.
117
CHAPTER 3 CADMIUM SELENIDE
Though the main thrust of the research for this dissertation was on Zinc Sulfide one-dimensional nanostructures, some preliminary work was done on Cadmium Selenide (CdSe) one-dimensional nanostructures. Much of this work was undertaken in collaboration with other researchers and has been presented in much more detail elsewhere.[1] Therefore, this chapter will contain a brief summary of the work done and an analysis of how that work relates both to the model presented in the previous chapter and to later research performed with Zinc Sulfide. 3.1 Introduction Cadmium Selenide is an important II-VI semiconducting material. As stated in the first chapter of this dissertation, CdSe quantum dots are the most extensively studied quantum nanostructure. Because of their size-tunable properties, CdSe has been used as a model system for investigating a wide range of nanoscale chemical, electronic, optical, and optoelectronic phenomena.[2] CdSe was an early material used to form selfassembled nanocrystal superlattices.[3] With a direct bandgap of 1.8 eV, CdSe quantum dots have been used for laser diodes, nanosensing, and biomedical imaging.[4-6] Also, like ZnS, CdSe can have the wurtzite structure. Prior to research being done that is included in this dissertation, there were relatively few reports on the synthesis and one-dimensional CdSe nanostructures and most of these consisted of polycrystalline and nano-sized grains of CdSe. Shape
118
controlled synthesis of CdSe nanorods, template assisted synthesis of CdSe nanowires, and nanotubes have been demonstrated through several electrochemical and chemical techniques.[7-9] Polycrystalline materials can degrade the optoelectronic performance. Because of this void in the literature of single crystal CdSe one-dimensional nanostructures, this research was undertaken to develop CdSe nanobelts. Nanobelts are not only single crystals, they are also faceted. Due to this geometry, it is possible to synthesize a nanobelts in such a way that only the thickness would be nanoscale, achieving quantum confinement in only one dimension. 3.2 CdSe Nanostructures The procedure for synthesizing cadmium selenide nanostructures is outline in the previous chapter. Commercial grade cadmium selenide (99.995% purity) was used as the source material for all of the experiments. During preliminary studies of the system, a pressure of 225 torr was used in the system, with a source temperature of 750 °C. Nitrogen (N2) was used as the carrier gas for this synthesis setup and the deposition substrates used were single crystal (100) silicon substrates. A vapor-liquid-solid growth method was encouraged by the deposition of gold onto the silicon substrates. Much of this research was presented in two separate papers and was featured in Nature.[10-12] As a result of various experiment with somewhat varying pressures and temperatures, three types of morphologies were observed in deposited material. These were nanobelts, nanocombs/nanosaws, and nanowires. All three of these exhibit the wurtzite crystal structure. 3.2.1 Cadmium Selenide Nanowires
119
The synthesized CdSe nanowires were single crystal and had their major growth direction along the [0001], corresponding to the c-axis of the wurtzite crystal structure. Because of the presence of the gold deposited on the substrate, a gold particle is typically found at the end of the nanowire. However, many times this particle could be broken off in transferring the sample from the furnace to the microscopes or the gold could entirely have diffused through the nanowire during the growth. Because the intention of the initial synthesis runs were to synthesize nanobelt structures, relatively little analysis was performed on the nanowires.
Figure 3.1 SEM images of CdSe nanowires on single-crystal silicon substrate.
120
3.2.2 Cadmium Selenide Nanobelts The nanobelts studied in this investigation demonstrate a rectangular cross-sections, are single-crystals, have a low-defect concentration, high flexibility without fracture, and can be grown to lengths that extend t o o v e r 1 0 0 μ m ( s e e F i g u r e 3 . 2 ) , a l l s i m i l a r c h a r a c t e r i s t i c s to the nanobelts synthesized from other types materials. Like the CdSe nanowires, all of the nanobelts have the wurtzite crystal structure. A TEM study reveals that the nanobelts consistently grow along the [01-10] with side facets of (0001) and top and bottom surfaces of (2-1-10).
Figure 3.2 (a) SEM and (b,c) TEM images of CdSe nanobelts
Figure 3.2 illustrates a commonly observed characteristic of the VLS-grown nanobelts. The nanobelts, although having uniform thickness, can grow in width as we move along the longitudinal axis and away from the catalyst. This is believed to be due to a secondary VS growth, as demonstrated in the previous section. Although often considered separately, it is entirely possible (and common) for the VLS and the VS
121
growth processes to occur at the same time, if temperatures are high enough to encourage non-catalyzed growth of the material. This could lead to one explanation for the expanding nanobelt structure that is seen in some cases. Growth initially occurs through the VLS mechanism, whereby the nanobelt grows in length all the while being confined by the catalyst in its lateral direction. If the conditions are right, a secondary VS growth process occurs, where material is deposited on the sides of the nanobelt, making the belt wider. Growth in the longitudinal direction continues, as does the secondary VS growth, leading to the almost triangular shape of some nanostructures. If this is indeed what is happening, then this triangular shape for the nanobelts can be eliminated by reducing the deposition temperature and thereby not permitting VS growth. As such, lowering the temperature for deposition can allow for uniform cross-section nanobelts to grow. For those nanobelts that do have a uniform cross-section, the aspect ratio for the CdSe nanobelts has been measured on average to be ~13. 3.2.2 Cadmium Selenide Nanosaws/Nanocombs Another type of morphology observed is the nanosaw or nanocomb growth. What this consists of is a nanobelt-like morphology that has secondary growth off of one (and only one) of its edges. This growth is encouraged by a number of factors including the polarity of the surface structure (as described earlier), the different chemical activities of the different surfaces, and the rate of growth species impinging on the structure. A TEM investigation reveals that the saw- and comb-like structures are both singlecrystals, and have the (0001) polar planes as their side facets. This can be seen in Figure 3.3. The asymmetry of the nanostructures side surfaces, one jagged and the other smooth, is believed to be due to their differing chemical compositions. The orientation of
122
the crystal planes in the nanobelt results in the side surfaces terminating in either all cadmium cations or selenium anions. The teeth of the nanosaws and nanocombs lie along the [01-10] with their top facets being the same as the nanobelt top and bottom surfaces, the (2-1-10) planes. For CdSe, the basal planes are the positively charged Cdterminated (0001) and the negatively charged Se-terminated (000-1). It is believed that the more chemically active Cd-terminated polar surface results in the asymmetric growth.
Figure 3.3 (a) SEM image of CdSe nanosaws and (b) TEM analysis of a nanocomb/nanosaw structure showing the growth direction
As stated previously, many of the bulk or thin films of II-VI semiconductors can exist in both the zinc blend and wurtzite structure. High-resolution TEM image recorded near the root of the nanoteeth of the CdSe nanosaws indicates a change from wurtzite CdSe to zinc blend CdSe that is several atomic layers in thickness. This is shown in Figure 3.4. This same phenomenon was observed in the ZnS nanosaws and nanocombs. Just as with ZnS, the energies for the two CdSe phases are quite closeError! Bookmark not defined.
123
and it is relatively easy to stimulate a phase transformation. As small islands of zinc blend CdSe corresponding to the ±(011) zinc blend phase, are nucleated on the flat (0001) Cd-terminated surface, the growth of the zinc blend islands is impinged due to the high surface energy associated with the ±(011). Therefore, the width of the zinc blend strip is limited in order to reduce the surface energy. However, a continuous growth is driven by the catalytic active Cd-terminated (0001) surface and tends to re-nucleate the wurtzite phase, giving a series of teeth along the (0001).
Figure 3.4 (a) TEM image of CdSe nanocomb; (b) Image of boxed area at root of secondary growth showing the zinc blende layers; (c) Image of root and side of the secondary growth
124
3.3 Statistical Determination of the Effects of Temperature and Pressure on Cadmium Selenide Growth With all of these different types of morphologies being formed out of the same material (and this is the case with other materials such as ZnS – this will be shown in the next chapter), it becomes important to be able to determine what the outcome of a given experimental run is going to be and what impact two of the major components of the system, temperature and pressure, have on the outcome. A colleague has performed a systematic investigation on the growth of the different one-dimensional nanostructures by varying the pressure and the temperature and observing the outcome.[1, 13] The results of this investigation will be summarized here and some consideration will be to their consistency with the growth model presented in chapter 2 and their generalizability to other materials. 3.3.1 Findings The investigation focused on VLS growth and determined, as expected, that local temperature and system pressure are the two most important factors in determining the synthesized morphology. It looked at the total deposited material and compared the percentage of nanowires, nanobelts, and nanosaws in order to find the conditions under which each was encouraged the most. The basic results are shown in Figure 3.5. It is clear that the growth of nanowires is preferred above all other types of growth. This occurs at all distances, temperatures, and pressures. Nanosaws are generally preferred second, and nanobelts are the least preferred of the morphologies. Though a more detailed study should be used to determine this exactly, all the growth morphologies
125
appear least dependent on the source temperature and most dependent upon the distance from the source.
Figure 3.5 Statistical findings of CdSe nanowire, nanobelt, and nanosaw growth studies are presented with respect to (a) source temperature, (b) system pressure, and (c) distance from the source. (d) The predicted concentration of the vapor species based on distance from Figure 2.16 is presented for comparison.
Also, from this work, some qualitative descriptions of growth can be determined. First is that the temperature at the source stimulates the vaporization of the source materials, but the growth is dominated by the local conditions at the deposition substrate. Second is that the growth of nanowires is less restrictive and can be carried out at a wider range of temperatures and pressures than that of nanobelts and nanosaws. Third is that high source temperature favors the growth of nanowires rather than nanosaws and nanobelts. 126
3.3.2 Consistency with the Growth Model The generalizability of these findings depends almost entirely on whether the qualitative descriptions determined from the purely statistical technique can be explained by a model based in materials properties on a molecular scale. Sadly, the only data and conclusions given are qualitative in nature so a more rigorous test cannot be applied. However, these conclusions do have some explanation in the model presented in Chapter 2 of this thesis. The first conclusion was that the growth is dominated by the local conditions of temperature and pressure. In Section 2.3.2, it was found that the growth rate of the nanostructures was determined by the supersaturation of the growth species (directly related to the local pressure – decreasing the pressure of the system increases the supersaturation of the growth species) in the atmosphere and the local temperature, almost exclusively among experimentally controlled variables. The second conclusion from work with CdSe is that the growth of nanowires is less restrictive and can be carried out at a wider range of temperatures and pressures than that of nanobelts and nanosaws. In Section 2.3.2, several qualitative descriptions of growth achieved according to the model developed were given based solely on differing vapor concentrations. It was stated that with low vapor concentration, nanowire growth would be preferred as only the fastest growth direction can proceed. With increasing vapor concentration, nanobelts and then nanosaws would be produced. How does this mesh with the findings from the CdSe report? Very well. Of particular interest is the graph in Figure 3.5 associated with the growths based on the distance from the source. As will be remembered, distance from the source determines the deposition temperature according to the determination of the temperature gradients shown in Figure 2.10. Distance from the
127
source also determines the vapor concentration, as is illustrated in Figure 2.16. These two factors have been shown to be key in the growth of the nanostructures (see Section 2.3.2). It was found, with the CdSe, that nanowires are preferred in all situations. This would suggest that nanowires can form with the lowest vapor concentration necessary for growth to occur. The second most preferred growth of CdSe is the growth of nanosaws. This may seem to contradict the findings in Section 2.3.2, but a closer look shows that it does not. The profile of nanosaw growth shown in Figure 3.5 follows closely the profile of vapor concentration with distance from the source material in Figure 2.16. This suggests, as was determined in discussing the model, that the growth of nanosaws occurs with the highest vapor concentration. Further suggesting this is that the growth of nanobelts is encourage as that vapor concentration diminishes farther away from the source. The third conclusion drawn from the CdSe research is that the growth of nanowires is encouraged more and more with increasing source temperature. As we have seen, the source temperature has a direct relationship with the deposition substrate. Further, with higher deposition temperatures, it is probable that more nanowires are able to be nucleated on their surface and less material is available for each growth. As we have seen, less material available for growth encourages nanowire growth over nanobelt or nanosaw growth. The major conclusions that are drawn from the research on CdSe can be explained qualitatively by the growth model presented in Chapter 2. The next step in determining the validity and usefulness of the results is in examining how generalizable they may be to other materials, particularly other II-VI semiconductor materials, and seeing where
128
other materials might deviate from the CdSe example. One issue that may entangle attempts to generalize these findings is the presence of oxygen in the system. CdSe shows little tendency towards oxidizing in the tube furnace system. However, the percentage of oxygen in the system has been shown to have a great impact on the growth of other materials.[14] This can be controlled and it only serves to highlight the importance of removing as much residual oxygen from the system as possible before beginning an experimental run. Another distinguishing factor may be the bonding mechanism that exist between the two elements of the II-VI semiconductors. The tetrahedral lattice sites inside the wurtzite crystal structure suggest that homopolar bonding is present. A homopolar bond is a bond between atoms of the same polarity, such as the covalent bond. This bond is more simply understood in terms of a tetravalent atom where the electronic wave functions are sp3hybridized and can combine in four independent ways to give the directional character of the bond, directed towards the corners of a tetrahedron. The sp3-hybridization requires that the s2p2 state which normally exists in the group four atoms is modified to the sp3 state. In the formation of the crystal, the energy required for hybridization and binding is lost. In II-VI compounds, with an average of four valence electrons per atom available for bonding, the same basic mechanism can occur. However, this is modified in the final result, since the ions which occupy the lattice sites differ in charge. There is also the possibility that instead of the electron spin pairing and creating the covalent bond that there is an exchange of electrons, resulting in an ionic bond. For example, an ionic bond in CdSe would give the two ions Cd2+ and Se2- occupying the lattice sites. However, it is clear from the wurtzite structure that the covalent bond is
129
present to a considerable degree, though the ionic bond is also present in varying degrees amongst the II-VI semiconductors. It has been found that the ionic character increases as the atomic weight decreases, i.e. from HgTe to ZnS. The ionic bond has the effect of strengthening the lattice, raising the melting point and increasing the energy band gap. Different radii can be assigned to the atoms concerned based on the covalent compound and the ionic compound. These values can be compared with experimental value. These values are shown in Table 3.1.[15] Table 3.1 Comparison of calculated radii with experimental
Atom Zn Cd Hg S Se Te Si Ge Sn Pb
At. No. 30 48 80 16 34 52 14 32 50 82
Covalent radii, A 1.31 1.48 1.48 1.04 1.14 1.32 1.17 1.22 1.40 1.46
Ionic Radii, A 0.74 0.97 1.10 1.84 1.98 2.21 -
Compound ZnS ZnSe ZnTe CdS CdSe CdTe HgS HgSe HgTe
Nearest neighbor separation, A Covalent Ionic Lattice compoun Compoun parameter d d observed experimentall y 2.35 2.42 2.38 2.45 2.55 2.46 2.63 2.76 2.64 2.52 2.63 2.52 2.62 2.76 2.62 2.80 2.98 2.79 2.52 2.75 2.53 2.62 2.89 2.63 2.80 3.11 2.80
A comparison of the experimental and theoretical values tend to suggest that most of the II-VI compounds have a strong covalent bond. ZnS is the most glaring exception to this. However, measurements of electrical properties have indicated that a certain amount of ionic character is necessary to explain reduced carrier mobilities.[16] Some work suggests that a quantitative estimate of the bond character can be given.[17] This is briefly described below. Covalent bonding of two nearest neighbors A and B is described by the combination of the sp3 h y b r i d w a v e f u n c t i o n υ A,B of the two atoms.
130
(Eq. 3.1)
If ionic bonding occurs, the equation becomes (Eq. 3.2) w h e r e λ i s t h e i o n i c i t y o f t h e b o n d . T h e effective ionic charge of the two atoms is o b t a i n e d u s i n g λ . T h e e l e c t r o n s p e n d
of its time on atom A and
upon atom B. Since there are on average 4 electrons per atom, then the charge due to
these electrons on atom A is
, and thus the effective charge on A is
(Eq. 3.3)
O f c o u r s e , t h e e f f e c t i v e c h a r g e o f a t o m B i s t h e o p p o s i t e o f a t o m A . λ v a r i e s f r o m 1 t o 0 and hence
for covalent bonding and
for ionic bonding. Please note
that for covalent bonding the CdSe atoms can be characterized by Cd2-Se2+ (ZnS is Zn2S2+) and for ionic bonding they can be represented as Cd2+Se2- (Zn2+S2-). Table 3.2 provides the values determined by the method of linear combination of atomic orbitals (LCAO) for this.
131
Table 3.2 Calculation of effective charge of various II-VI compounds Compound ZnO ZnS CdS ZnSe CdSe
0.60 0.47 0.49 0.47 0.49
Notice that among the non-oxide compounds, ZnS has one of the lowest covalent characteristic and CdSe has among the highest. It is these differences that may lead to some variation with other II-VI materials from the findings of the CdSe statistical study. However, these variations amongst the basic properties of the II-VI semiconductors are not too large and it is predicted that the statistical findings of CdSe will be able to be generally applied to other non-oxide II-VI materials, such as ZnS. 3.4 Summary This chapter has included some highlights of research that the author has performed with colleagues on the compound Cadmium Selenide. It does not include all of the work, but merely has meant to draw attention to the more relevant parts of the research. It focused on the growth of nanowires, nanobelts, and nanosaws. Then it followed a systematic analysis of the experimental conditions necessary to synthesize each of these. Using the data compiled from that effort, several conclusions were drawn: first, the growth is dominated by the local conditions at the deposition substrate; second, the growth of nanowires can be carried out at a wider range of temperatures and pressures than that of nanobelts and nanosaws; third, a high source temperature favors the growth of nanowires rather than nanosaws and nanobelts. These conclusions were then compared and
132
discussed in relation to the model presented in the previous chapter and they were found to qualitatively have a good agreement with the model. The implications for generalizability to other structures were also discussed.
133
3.5 References
1. Ma, C., Systematic Investigation on the Growth of One-Dimensional Wurtzite Nanostructures, in Materials Science and Engineering. 2005, Georgia Institute of Technology: Atlanta, GA. p. 205. 2. Tolbert, S.H. and A.P. Alivisatos, Size dependence of a first-order solid-solid phase transition - The wurtzite to rock-salt transformation in CdSe nanocrystals. Science, 1994. 265(5170): p. 373-376. 3. Murray, C.B., C.R. Kagan, and M.G. Bawendi, Self-organization of CdSe nanocrystallites into 3-dimensional quantum dot superlattices. Science, 1995. 270(5240): p. 1335-1338. 4. Chan, W.C. and S. Nie, Quantum Dot Bioconjugates for Ultrasensitive Nonisotopic Detection. Science, 1998. 281(5385): p. 2016-2018. 5. Colvin, V.L., M.C. Schlamp, and A.P. Alivisatos, Light-emitting diodes made from CdSe nanocrystals and a semiconducting polymer. Nature, 1994. 370(6488): p. 354357. 6. Tran, P.T., et al., Use of Luminescent CdSe-ZnS Nanocrystal Bioconjugates in Quantum Dot-Based Nanosensors. Physica Status Solidi B, 2002. 229(1): p. 427-432. 7. Jiang, X.C., et al., Direct synthesis of Se@CdSe nanocables and CdSe nanotubes by reacting cadmium salts with Se nanowires. Advanced Materials, 2003. 15(20): p. 1740. 8. Peng, X.G., et al., Shape control of CdSe nanocrystals. Nature, 2000. 404(6773): p. 59-61. 9. Peng, X.S., et al., Synthesis of highly ordered CdSe nanowire arrays embedded in anodic alumina membrane by electrodeposition in ammonia alkaline solution. Chemical Physics Letters, 2001. 343(5-6): p. 470-474.
134
10.
Ball, P., Nanomaterials - Jagged edge. Nature, 2004. 427(6974): p. 497-497.
11. Ma, C., et al., Single-Crystal CdSe Nanosaws. Journal of the American Chemical Society, 2004. 126: p. 708-709. 12. Ma, C., et al., Nanobelt and nanosaw structures of II-VI Semiconductors. International Journal of Nanotechnology, 2004. 1: p. 431-451. 13. Ma, C. and Z.L. Wang, Road Map for the Controlled Synthesis of CdSe Nanowires, Nanobelts, and Nanosaws— A Step Towards Nanomanufacturing. Advanced Materials, 2005. 17(21): p. 2635-2639. 14. Song, J.H., et al., Systematic study on experimental conditions for large-scale growth of aligned ZnO nanwires on nitrides. Journal of Physical Chemistry B, 2005. 109(20): p. 9869-9872. 15. Pauling, L., The Nature of the Chemical Bond. 3 ed. 1960, New York City, New York: Cornell University Press. 16. Ray, B., II-VI Compounds. 1 ed. International series of monographs in the science of the solid state, ed. B.R. Pamplin. Vol. 2. 1969, Oxford, London, U.K.: Pergamon Press. 268. 17. Coulson, C.A., L.B. Redei, and D. Stocker, Electronic Properties of Tetrahedral Intermetallic Compounds 1. Charge Distribution. Proceedings of the Royal Society of London Series a-Mathematical and Physical Sciences, 1962. 270(1342): p. 357-372.
135
CHAPTER 4 ZINC SULFIDE
The main thrust of the research for this dissertation focused on Zinc Sulfide onedimensional nanostructures. In an attempt to provide a rational outline and discussion of the nanostructures, first a discussion of the basic crystallographic properties of ZnS will be presented. Because one-dimensional nanostructures are an example of anisotropic growth, a consideration of the causes of anisotropy in Zinc Sulfide will be presented second. Third, various nanostructures that have been synthesized will be discussed, along with their characterization. The nanostructures will be considered with respect to the growth model that was produced in chapter 2 of this dissertation. Fourth, multicomponent systems and applications will be discussed. 4.1 Introduction ZnS is a direct wide band gap (3.91 eV) compound semiconductor with a high index of refraction and a high transmittance in the visible range and is one of the more important materials in photonics research.[1-5] As a one-dimensional nanostructure, ZnS has been synthesized as nanowires, nanobelts, and nanocombs.[5-20] Recently, ZnS nanobelts have been doped with manganese, by postannealing, without changing the crystallography of the ZnS nanobelts.[19] Also, optically pumped lasing has been shown in single ZnS nanobelts.[9]
136
4.1.1 Zinc Sulfide Crystal Structures In its bulk form, ZnS is typically found in the zinc blend crystal structure at room temperature.[21, 22] The zinc blend structure is cubic, with four sulfur anions per unit cell located at the corners and centers of each face and with four zinc cations situated in half of the tetrahedral sites (the ¼, ¼, ¼ positions). At elevated temperatures, bulk ZnS can undergo a phase transformation from the cubic zinc blend structure to a hexagonal crystal structure known as the wurtzite structure. This transformation has been shown to occur at 1020º C. The zinc blend and wurtzite structures are very similar. The stacking sequence of the close-packed planes of zinc blend (the (111) planes) is represented by the ABCABCABCABC repeating pattern. However, if the close-packed planes stack themselves in the ABABABABAB repeating pattern, they would form the (0001) planes of the wurtzite structure. Both the zinc blend and the wurtzite structure are shown in Figure 4.1.
Figure 4.1 The zinc blende (left) and wurtzite (right) crystal structures of ZnS
137
The vast majority of one-dimensional nanostructures formed are the wurtzite crystal structure. In fact, this is a common characteristic that II-VI semiconductors share, given the right conditions.[23] Wurtzite is the most stable structure for CdS and CdSe and the other II-VI semiconductors have previously been observed to exhibit the wurtzite crystal structure.[13, 24, 25] The wurtzite structure has a hexagonal unit cell (space group P63mc). The structure of wurtzite ZnS can be described as a number of alternating planes composed of tetrahedrally coordinated S2– and Zn2+ ions, stacked alternatively along the c-axis. The tetrahedral coordination in ZnS results in non-central symmetric structure and piezoelectricity. Another important characteristic of ZnS is the polar surfaces. The most common polar surface is the basal plane. The oppositely charged ions produce positively charged Zn-(0001) and negatively charged S-(000-1) polar surfaces, resulting in a normal dipole moment and spontaneous polarization along the c-axis as well as a divergence in surface energy. Structurally, wurtzite ZnS has three-types of fast growth directions: <2-110>(±[2-1-10], ±[-12-10], ±[11-20]); <01 1 0> (±[01-10], ±[10-10], ±[1-100]); and ±[0001]. Together with the polar surfaces due to atomic termination, ZnS exhibits a wide range of novel structures by tuning the growth rates along these directions. This is an important characteristic for these materials, because the intrinsic asymmetric nature of wurtzite gives rise to a piezoelectric phenomenon.[26] This piezoelectric property in nanobelts lends them to applications such as nanocantilevers in scanning probe microscopy.[27] The use of nanobelt cantilevers could increase the sensitivity ~35– 1800 times that of conventional cantilevers. The nanocantilevers could be used in mass, biological, force, thermal, pressure, and chemical sensing applications.[28-30] Through
138
the successful synthesis of II-VI semiconductors in a nanobelt form, a wide range of mechanical and optoelectronic application may be possible for these materials. This is why II-VI semiconductors and ZnS remain a fast developing area of research. 4.1.2 Applications of ZnS It is worth noting some of the applications that motivated the studies of Zinc Sulfide. Zinc Sulfide has many applications. Rutherford and others first used zinc sulfide in the early years of nuclear physics as a scintillation detector. A scintillation detector measures ionizing radiation. Zinc Sulfide does this because it emits lights on excitation by x-rays or electron beam. Utilizing this aspect, ZnS is used in x-ray screens and cathode ray tubes. Recently, ZnS scintillation detectors have even been used in the potential detection of dark electric matter objects (DAEMONS).[31] These objects can catalyze the fusion of light nuclei, suggesting new ways for solving the problem of deficiency of solar neutrinos and of solar energetic as a whole. ZnS is also an important phosphor host lattice material used in electroluminescent devices (ELD), because of the band gap large enough to emit visible light without absorption and the efficient transport of high energy electrons. Electroluminescent display devices consist of several layers. The central layer is a phosphor which emits light when an electric field on the order of 1.5 MV/cm is applied across it. Because of this high field lever, current limiting insulating layers are placed on either side of the phosphor. Finally, electrodes on the top and bottom of the device form the basic capacitive structure. Of course, in order to view the emitted light, at least one of the electrodes must be transparent.[32] This setup is shown in Figure 4.2. ZnS phosphors are also used in light-emitting diodes (LEDs). 139
Figure 4.2 Schematic of an electroluminescent display (ELD) device with ZnS as the phosphor material
4.2 Synthesis The synthesis of the one-dimensional nanostructures presented here generally follows along the lines presented in chapter 2. Though for each structure synthesized the synthesis parameters will be given, it is useful first to look at the main commonalities between the different synthesis runs. First, all ZnS nanostructures were synthesized using (100) oriented silicon substrates. These were carved into approximately 1 cm by 1 cm squares from commercially available silicon wafers. The catalyst used was gold evaporated from a thermal evaporator designed within the research group. A physical vapor deposition method with commercially available ZnS was used for all experiments. This was the typical synthesis setup. However, alternative synthesis setups are available. Some of them will be explored briefly here. In section 2.3.1, the possibility of the dissociation of zinc and sulfur from the ZnS source in the vapor phase was considered. The setup of the zinc and sulfur source provided an
140
outlet to explore that possibility. Though this exploration was inconclusive in that measure, it provided a nice alternative setup for synthesis. Using a separate zinc and sulfur source has several distinct advantages. First, it allows for much lower temperatures to be used as both Zinc and Sulfur have much lower melting points than the ZnS compound. Second, it allows for more control over the concentration gradient of the constituent elements. The disadvantage is in the resulting deposition. The deposition is very dependent on the amount of oxygen in the system. As zinc has a high likelihood of oxidizing and forming ZnO, unless oxygen is purged from the system ZnS will not form.[33] The system and experiments used to synthesize the ZnS nanostructures in this dissertation was not setup to purge the chamber of enough oxygen. Another setup is using a chemical vapor deposition (CVD) method for synthesizing ZnS nanostructures. A typical example of this would use a Zinc metal source and include a HS2 gas in the flow gas. The hydrogen reacts with the residual oxygen instead of the zinc and the sulfur reacts with the zinc and forms Zinc Sulfide. Other methods have used diethylzinc and HS2 or zinc bis(diethyldithiocarbamate).[34, 35] CVD methods, again, have the benefit of using lower temperatures to perform the experiment. However, reports of CVD synthesized ZnS nanostructures have had a large number of defects, perhaps due to oxygen incorporation.[34] 4.3 Anisotropy in Zinc Sulfide Anisotropy is the property of being directionally dependent. In crystallographic sense, it is intended to refer to properties which are dependent on the crystallographic direction in which they are being measured. Anisotropy in nanomaterials can lead to many interesting
141
growth properties and morphologies. This is especially true when the crystal structure contains anisotropy not only due to different surface plane energies but also due to electric polarity and chemical activity. It is important to look at the growth of one-dimensional nanostructures as a form of anisotropic growth. This is especially true in the case of ZnS morphologies, as they tend to prefer one crystallographic direction over another. As we saw in chatper 2, the growth rate of a nanostructure depends on surface specific properties, namely, the accommodation coefficient. This, it will be recalled, is the average efficiency of the energy exchange that occurs when a gas molecule encounters a solid surface. It is the extent to which impinging vapor species are incorporated into a growing crystallographic surface. The growth rate of a crystallographic surface was determined to ideally be linearly related to the accommodation coefficient. This accommodation coefficient is dependent on specific surface properties and, thus, is an anisotropic property. Anisotropic growth in wurtzite ZnS nanostructures occurs because of its crystallographic structure. Wurtzite ZnS produces several different causes of anisotropic growth. One cause of anisotropic growth is that certain planes are terminated with different species and exhibit surface polarity. Another is caused by transitions from the wurtzite to the zinc blend crystal structure inside of the nanostructure. 4.3.1 Anisotropy Due to Polarity and Differently Terminated Surfaces The ZnS wurtzite crystal also has the interesting feature of having several different lowindex planes that terminate with either a positively charged Zn cation or, on the opposite side, a negatively charged S anion. This characteristic of the crystal structure creates
142
polarized surfaces, resulting in a dipole moment and spontaneous polarization along the axis perpendicular to the plane. One plane is the basal plane - (0001). This is also the close-packed plane of the crystal. Though in the bulk this dipole and divergence in surface energy is compensated for by creating facets or massive surface reconstruction, it can be a significant contributor to asymmetric growth in nanostructures.[36-38] By projecting the wurtzite ZnS crystal along the [1-210] direction we can see that another polar surface is present in the (01-11) family of planes. This is seen in Figure 4.3. This surface, like the (0001) plane, can also contribute to the final morphology of nanostructures because of its polarity.
Figure 4.3 Projection of the wurtzite crystal structure along [1-210]. The (0001) and (0111) polar planes are evident
143
In addition to the contribution that polarity makes, these surfaces also contribute to anisotropic growth because of the different terminating species that they contain. Zn and S have different chemical potentials and opposite surfaces can have very different growth reactions occur on them.[6, 39, 40] At a nanoscale regime, especially with the single crystals that get produced, these differences get amplified and have a large impact on the anisotropic growth. It has already been seen with CdSe in Chapter 3 that Cadmium terminating surfaces can catalyze secondary growth on the original nanostructure. This is also true with ZnS in that the more chemically active zinc terminating surface can catalyze secondary growth under certain conditions.[41] This will be shown later in this chapter. 4.3.2 Effect of Defects in the Growth Material As presented in Chapter 2, once a adatom from the vapor reaches a surface of the growing ZnS nanostructure, it requires a site on which to be incorporated into the crystal structure in order continue the growth. Steps typically can provide such a site. However, point defects, dislocations, stacking faults, and impurities in the crystal can also provide growth sites. Dislocations are rarely seen inside of one-dimensional nanostructures. This is because the strain energy that is associated with them is too great for the nanocrystal to hold. However, stacking faults are commonly seen. Stacking faults are particularly common inside of ZnS, where they occur anisotropically along the [0001] (for wurtzite, [111] for zinc blend) direction. Recall that the stacking sequence of the close packed planes of the wurtzite crystal structure is ABABABABAB. A stacking fault would have to force a plane into the C-position, forming a stacking sequence of ABABAB|C|ABAB. This creates a region of the crystal that has the stacking sequence of ABC. However, this 144
stacking sequence is the same as having a region of the crystal that takes the crystal structure zinc blend (ABAB | ABC | ABAB). The reason that these are more common in the nanostructures of the ZnS material is that the zinc blend structure is actually the more energetically favorable crystal structure for ZnS in bulk. The wurtzite nanostructures created represent merely a metastable phase of ZnS. As will be seen, wurtzite ZnS nanostructures can be transformed into zinc blend structures with the right amount of energy insertion. 4.4 Zinc Sulfide Nanostructures The one-dimensional nanostructures that are synthesized are only one type of ZnS morphology that has been formed from the physical vapor deposition process. Typically, one-dimensional growth represents a form of heterogeneous growth, with each individual nanostructure indicating a separate growth site beginning. This is especially true when a catalyst particle is used, such as gold, that forms a liquid droplet setting a specific site for growth. However, it is also possible to have another type of growth with physical vapor deposition. This is an epitaxial growth and it usually occurs on substrates that have a very low concentration of ZnS in the vapor phase, that is, deposition substrates that are farther away from the source material. An example of this type of growth is seen in Figure 4.4.
145
Figure 4.4 Epitaxial growth of ZnS at very low vapor concentration. This forms a rough layer of ZnS
In the basic theory of epitaxial growth, three growth modes are traditionally distinguished. They are Frank-van der Merwe (FM), Volmer-Weber (VW), and StranskiKrastanow (SK) growth modes.[42-44] They may be described as layer-by-layer growth, island growth, and layer-by-layer plus islands. These are illustrated schematically in Figure 4.5. The growth mode here is governed by the interface and surface energies only. I f t h e s u m o f t h e e p i l a y e r s u r f a c e γ n d o f t h e i n t e r f a c e e n e r g y γ 2a 12 is lower than the energy of the substrate surface, i.e. if the deposited material wets the substrate, the FM mode occurs. A change in the sum alone drives a transition from the FM to the VW growth mode. For a strained epilayer with small interface energy, initial growth may occur layer-by-layer, but a thicker layer has a larger strain energy and can lower its energy by forming isolated island in which strain is relaxed. In this way, the SK growth
146
mode occurs.[45] Though these theories were adopted for MBE systems and the layer by layer growth of thin film systems, the qualitative lessons they offer can bring about some insight and help explain some of the basic growth seen in ZnS PVD systems. As it is clear that the deposited material does not wet the substrate, a VW or SK type of growth c a n h e l p e x p l a i n s o m e o f t h e “ b a c k g r o u n d ” g r o w t h t h a t is seen in most of the synthesis runs.
Figure 4.5 Schematic diagrams of the three growth modes for epitaxial systems: Frankvan der Merwe (FM), Volmer-Weber (VW), and Stranski-Krastanow (SK)
It is important to keep in mind the hexagonal crystal structure of the wurtzite ZnS in looking at this type of growth, as it asserts itself in larger structures in fairly obvious ways. In the PVD growth system, the formation of island (as formulated in epitaxial growth) is influenced by the crystal structure. An example of this is evident in the synthesis of ZnS columns. The ZnS columns were synthesized using 1.5 grams of ZnS as a source. <100>-oriented Silicon with about 2 nm of gold deposited uniformly on the surface was used for deposition substrates. The temperature of the source was raised to
147
1100 °C at a rate of 50 °C/min. The deposition substrates on which the columns formed, then, reached a temperature of about 650 °C. The pressure in the system was maintained at a relatively low 10 torr, in order to have a low vapor concentration. A flow gas of nitrogen (N2) was used at a rate of 50 standard cubic centimeters per minute (sccm). The resulting deposition is shown in Figure 4.6.
Figure 4.6 Hexagonal ZnS columns grown by vapor deposition.
148
As is seen, the columns synthesized maintain the six-fold symmetry of the wurtzite crystal structure. There is also a high density of growth. Many of the columns are capped with a pyramid like top. This growth probably occurred when the furnace was shut down and the system was pulled to a vacuum, purging the environment of growth species. Interestingly, it is possible to see the growth process arrested in the middle. Figure 4.7 shows a series of structures where you can see the growth process occurring. In Figure 4.7 (b) and (c), the layer-by-layer growth of the columns is evident as one layer grows upon another. A couple of things are noticeable. First, each layer grows with a hexagonal profile individually. This helps to create the hexagonal column. Second, each layer is approximately 50 nanometers thick. Each layer grows within the profile of the layer below it, implying that it grows by having the incoming vapor species deposit onto the layer and incorporates into the crystal structure at a growth site such as a step or dislocation.
149
Figure 4.7 (a) Hexagonal ZnS columns whose growth ahas been arrested so the growth process can be seen; (b and c) The hexagonal layer-by-layer growth of the columns can be seen.
A number of other morphologies that are not one-dimensional nanostructures have been synthesized and characterized. They include ZnS tubes, spheres, and a wide range of other materials. Some of these are shown in Figure 4.8. However, as analyzing these was not the main thrust of the research for this dissertation, they will not be discussed in length.
150
Figure 4.8 Various other ZnS nanostructures synthesiszed using the simple vapor deposition process
4.5 Non-Polar Surface Dominated Zinc Sulfide Nanostructures The original report of one-dimensional ZnS nanostructures was released in 2003 in Advanced Materials.[7] Later, it was featured by Thomson, a company that tracks scientific journals worldwide and is well-known for its scitation index and ranking of j o u r n a l s b y t h e i r “ i m p a c t f a c t o r , ” a s a “ F a s t M o v i n g F r o n t . ” [ 4 6 ] What this means is that
151
the paper is a core paper in a research front that is having the largest percentage increase in the number of papers from one period to the next. The reason the paper is so highly cited is twofold. First, it showed the ZnS can from the nanobelt morphology as it was the first report of its kind. Second, it showed that ZnS nanobelts and other structures can form the wurtzite rather than zinc blend structure. This is in contrast to thin films or bulk ZnS. It is useful to divide one-dimensional ZnS nanostructures into two different categories, depending on the type of growth that is seen. The first category is non-polar s u r f a c e d o m i n a t e d n a n o s t r u c t u r e s . T h e s e a r e m o r e “ n o r m a l ” m o r p h o l o g i e s , s u c h a s a plain wire or belt shape. The second category is the polar surface dominated nanostructures. When the polar crystal surface that is present in the wurtzite crystal structure dominates some aspects of the growth, some interesting growth phenomena can occur. 4.5.1 Nanowires, Nanobelts, Nanosaws, and Nanowindmills The original paper reported the success of synthesizing stable wurtzite-structured nanobelts, nanocombs, and nanowindmills using a simple catalyst-free thermal evaporation technique. The structures of these characteristic shapes have been fully characterized. The synthesis technique was based on thermal evaporation and a vaporsolid growth mechanism. Commercial grade zinc sulfide was used as the source material for all of the experiments. There were two forms of ZnS that were used as the source material, a powder consisting of small ZnS particulates and a sintered or pressed powder forming
152
pellets of ZnS. Chemically the two forms were identical and even the purity (99.9%) was equivalent. In the investigation of the as-deposited material, no appreciable difference in the morphology could be detected. The chamber pressure and source temperature for synthesis were 300 mbar and 1050 °C, respectively. Although primarily all of the experiments were run at a source temperature of 1050 °C, a brief investigation demonstrated the possibility of successfully synthesizing ZnS nanostructures using a source temperature as low as 950 °C. Argon was chosen as the carrier gas for this synthesis setup due to its nobility. The substrates used to grow these ZnS nanostructures were polycrystalline alumina (99.7% purity) cut into 1-3 cm long rectangular substrates which lined the inside of the chamber. Although the original intent in studying ZnS was to synthesize this material into the nanobelt morphology, an unexpected result was observed when four types of morphologies were collected in the as-deposited material: nanobelts, nanocombs/nanosaws, nanowindmills and nanowires. The length and width of each of these morphologies could be several microns in length, however the thickness of the structures is consistently in the nanometer range. For this reason, all of these structures are classified as one-dimensional ZnS nanostructures.
153
Figure 4.9 ( a ) L o w m a g n i f i c a t i o n S E M i m a g e d e m o n s t r a t i n g t h e “ w e e d ” g r o w t h c a u sed b y t h e V S m e c h a n i s m ; ( b ) S E M i m a g e o f t h e “ s e e d ” c r y s t a l o f t w o d i f f e r e n t Z n S w e e d s .
The as-synthesized sample is composed of several types of structures. The most typical structure observed is ZnS nanobelts. These are shown in Figure 4.9. The nanobelts have a uniform cross-section along their length, with a typical width of 2 - 3 0 μ m a n d e x t e n d t o o v e r 1 0 0 μ m i n l e n g t h . T h e s i t e g r o w t h o f t h e n a n o b e l t s d o e s n o t s h o w a n y specific pattern. Instead, they are nucleated and grown as bunches randomly distributed o n t h e s u b s t r a t e c o v e r e d b y a t h i n l a y e r o f Z n S g r o w t h . T h i s “ w e e d -l i k e ” g r o w t h w a s described briefly in Chapter 2. It was first suggested by this vapor – solid synthesis. An examination at the root of the group of the nanobelts were grown from a site which is the “ s e e d ” f o r t h e n u c l e a t i o n o f t h e n a n o b e l t s . N u m e r o u s b e l t - and saw-like structures grow from a single nucleation site. Several other types of shapes have also been identified. The comb-like structure is found in the product and also large sheets have als been identified. These are seen in Figure 4.10. The structures are single-crystalline. Further, shrinkage in
154
thickness significantly reduces their flexibility, so the structure can bend without fracture. This sheet-type structure has been previously observed for Ga2O3 and CdO.[47, 48]
Figure 4.10 SEM images of (a) ZnS comb-like structure and (b) sheet-like structure
Electron diffraction and x-ray diffraction (XRD) techniques have been used to determine the crystal structure of the ZnS nanostructures. An effort to characterize the structures by XRD alone was made. The samples have a wurtzite crystal structure. The systematica analysis using electron diffraction indicates that all three types of structures are single-crystalline with the wurtzite ZnS structure (a = 3.82 A, c = 6.26 A). The comblike, saw-toothed belts, and the regular belt structures were found in the same growth temperature range. Bright-field transmission electron microscopy (TEM) images of these 155
structures are shown in Figure 4.11. The ripple-like contrast observed in the TEM images is due to the strain resulting from the bending of the nanobelts. The growth characteristics of these structures show some consistency. The TEM studies reveal that one side has the saw-tooth structure. The nanobelt grows along [0001], with side surfaces (01-10) and the top surfaces (2-1-10). The extrusive saw-teeth point along [01-10], and their top surfaces are (2-1-10). The saw teeth are defined by facets close to (01-13) and (0-113). It should be noted that this plane is a common twin plane for wurtzite crystal structures. A common feature observed is that (0001) stacking faults are usually present between the teeth and the nanobelt. The comb-like fingertip structure is formed by the formation of low-energy facets of (0001) and (01-10), while the top surfaces are still (2-1-10).
156
Figure 4.11 (a) TEM image and the corresponding electron diffraction pattern from a saw-like ZnS nanostructure; (b) TEM image of the comb-like ZnS nanostructure. The inset is an EDS spectrum showing the existence of sulfur and zinc atoms in the specimen, while the copper signal comes from the TEM grid used.
Another structure observed is the six-fold windmill structure, shown in Figure 4.12, in which the axis is [0001] and the six wings are along ±[10-10], ±[0-110], ±[1100], as shown schematically. The six wings can grow laterally and interconnect to form a faceted structure like the one shown. Here, the side facets are (10-11), (-1011), (01-11), (0-111), (-1101), and (1-101). This type of faceted three-dimensional structure is common in the synthesized material.
157
Figure 4.12 (a) SEM image of the windmill structure; (b) Image of the polyhedral structure of ZnS; (c) structural model of the growth of the windmill structure
As stated in the previous section, the wurtzite structured ZnS is unstable and it may transform to the zinc blend structure with the insertion of enough energy. Shown in Figure 4.13 are two images recorded from the same area before and after the sample was exposed for about 10 minutes under 200 keV electrons inside of the TEM. The after picture shows a significant increase in the density of planar defects. The electron diffraction pattern recorded from the area shows the coexistence of the hexagonal
158
wurtzite structure and the cubic zinc blend structure. The relationship between these two was discussed in the previous section. The orientation relationships between the two phases are: [2-1-1 0 ] ║ [ 0 1 -1 ] a n d ( 0 0 0 1 ) ║ ( 1 1 1 ) . T h e t w o p h a s e s c o e x i s t b y s h a r i n g t h e same (0001) or (111) plane. It is also known that the cubic phase of ZnS typically has (111) twins. The existence of twins is indicated by the electron diffraction pattern. The diffraction spots and the corresponding indices from the hexagonal phase, the cubic phase, and its twin are illustrated.
Figure 4.13 TEM images of a ZnS nanosaw (a) before and (b) after illumination by an electron beam; (c) Electron diffraction pattern recorded from the area which can be
159
indexed as the coexistence of the hexagonal and cubic phases with the presence of twins in the cubic phase; (d) Theoretical diffraction pattern that corresponds to the experimental pattern
The presence of the two phases in the nanostructures can be directly identified by high-resolution TEM. Figure 4.14 shows a TEM image recorded from the hexagonal phase that is oriented along [2-1-10], which matches fairly well to the projected position of the Zn atoms in the unit cell, as shown in the inset. The sulfur atoms are too light to be resolved by the TEM used for this study. Also shown is a [01-1] projected image of the cubic phase and the projection of the unit cell is marked by a rectangular frame. The projected position of the Zn atoms in the cubic phase, shown in inset as well, match well to the bright contrast observed in the image. The relationship between the wurtzite and zinc blend structure was described significantly in the previous section. It was also described how stacking faults in one of the crystal structures forms the other structure. Figure 4.15 shows the coexistence of the wurtzite, zinc-blend, and the twinned zinc-blend structures. The corresponding structure model is shown also. Although the position of the S atoms cannot be determined from the image, the projected positions of the Zn atoms is directly determined.
160
Figure 4.14 (a) Unit cell models for the hexagonal and cubic phases; (b) [2-1-10] high resolution TEM image of the wurtzite ZnS; (b) [0-11] Image of the zinc blende ZnS
Nanostructures of wurtzite-structured ZnS, which is unlikely to be stable under conventional conditions for the bulk, have been synthesized by a simple physical vapor deposition process. Morphologies with belt-, saw-, comb-, and windmill-like nanostructures have been observed. These structures are formed by adjusting the growth directions between [0001] and <01-10> and the sizes of the (0001), (01-10), and (2-1-10) facets. Electron diffraction and high-resolution TEM have revealed the phase transformation between the hexagonal and cubic phases and their orientation relationship as well as the presence of stacking faults and twins.
161
Figure 4.15 HR-TEM showing the coexistence of the wurtzite, zinc blende, and the twinned zinc blende structure. The model shows the transformation among the structures that occurs by adjusting the stacking sequence of the atomic layers
This was the first reported successful synthesis of wurtzite one-dimensional zinc sulfide nanostructures. At the time, it was not fully recognized that the separate chemical activities of the (0001) and (000-1) surfaces of wurtzite ZnS contributed to the growth of the nanostructures. The second report of ZnS nanostructures explored this contribution to the growth of the morphology.[6] This report was published in Chemical Physics Letters in 2004. To date, the paper has been cited 31 times according to the ISI Web of Knowledge. The synthesis was altered in order to encourage the growth of ZnS nanosaws so that they could be examined in more detail.
162
Synthesis of ZnS nanostructure was achieved using a simple thermal evaporation process. Commercially available zinc sulfide (Alfa Aesar, 99.9% purity, metals basis) are placed in the center of an alumina tube inside of a horizontal tube furnace, where temperature, pressure, and evaporation time is controlled. The temperature is then raised to 1000 °C, as determined based on the melting temperature of zinc sulfide (1700 °C); the tube chamber pressure was kept at 300 mbar with a nitrogen flow gas at 50 sccm. The evaporation time was ~10 min at the peak temperature. This shorter evaporation time was used to discourage the growth of the larger windmill and sheet structures that were achieved in the previous experiment.
Figure 4.16 SEM image of the as-synthesized ZnS nanostructures. The inset is an energy dispersive X-ray spectrum recorded from the sample. The Zn and S peaks are due to the nanostructures, while the silicon and oxygen peaks are due to the silicon substrate.
The sample was first analyzed by scanning electron microscope to determine the morphology of the deposited nanostructures. Figure 4.16 shows a typical SEM image of the polar growth structures. Chemical analysis using the energy dispersive X-ray
163
spectroscopy (EDS) shows the stoichiometric phase of ZnS, while the oxygen and silicon signals come from the silicon substrate and silica surface layer on the substrate. There are two distinct classes of structures observed. One is the ribbon-like flat structure with onesided teeth, named nanosaw. The second structure observed is a 3D structure, with feathers propagating off the main axis and separated circumferentially by 120°. Both of these samples were analyzed by TEM. A low magnification TEM image of the saw structure is shown in Figure 4.17 along with the dark field image. The onesided teeth structure of the saws is clearly seen. Electron diffraction reveals that the saws are single crystalline throughout the entire length. The diffraction also shows that the saw ribbon grows along [2-1-10] (the a-axis) and the teeth of the saw grow along the [0001] direction. The teeth of the saw are different sizes, which indicate that they grow at different rates. The widths of the teeth range from 5 to 20 nm. It is important to note that the teeth grow out of the (0001) facet.
Figure 4.17 (a) Bright field TEM image of a ZnS nanosaws. The polar growth occurs mainly on one side of the belt. (b) Dark field TEM image of the saw structure
164
The saw-teeth structure is suggested to be a direct result from the difference in surface chemical activities as determined by surface termination. The Zn-terminated surface is chemically active, while the S-terminated surface is relatively inactive, resulting in the growth of the saw-teeth along [0001]. A powerful technique that can be applied to directly prove the termination of the surface is the convergent beam electron diffraction (CBED), but this technique requires the crystal being relatively thick. The CBED pattern recorded from a ribbon is shown in Figure 4.18, but the diffraction disks are featureless because the fact that the ribbon is thinner than the extinction distance for the ZnS (0002) reflection, so that the dynamic diffraction effect is weak.
Figure 4.18 (a) Diffraction pattern shows the saw ribbon is along [01-10] and the sawteeth are along [0001]; (b) CBED pattern recorded from the sample; (c) High-resolution TEM image recorded from the ZnS nanosaw
165
Also, a high-resolution TEM image recorded from the ribbon of the nanosaw is shown. The (0001) lattice spacing is measured to be 0.61 nm, which is in agreement with bulk values of c = 0.626 nm. Based on the structural data presented here, the asymmetric growth features of the saw apparently result from the different growth rates on the (0001)-Zn and the (000-1)-S-terminated surfaces. The nanosaw is formed by a two-step process: a fast growth along [2-1-10] forms the ribbon of the saw; a subsequent slower growth along [0001] by a self-catalyzed process creates the teeth. The second structure observed is the three dimensional feather structures. Figure 4.19 shows a low magnification SEM image of the structure and a TEM image of the structure as well. Electron diffraction pattern recorded from one side of the feather shows that the wing grows along [0001], and the center shaft is parallel to [01-1-1]. The other feathers are produced possibly because of bi-crystal growth.
166
Figure 4.19 ( a ) „ F e a t h e r ‟ s t r u c t u r e o f Z n S ; ( b ) A T E M i m a g e o f t h e f e a t h e r s t r u c t u r e a n d the corresponding growth directions
In short, this study determined the growth characteristics of the nanosaw (or, perhaps more aptly named, nanobelts with saw-teeth). The nanosaw is formed by a twostep growth process: a fast growth along the a-axis forms the body of the saw and a subsequent growth along the positive c-axis creates the teeth. The one-sided teeth structure is suggested to be the self-catalyzed growth of the Zn-terminated (0001) surface, while the sulfide-terminated (000-1) surface is relatively chemically inactive. The growth of feather-like structure of ZnS is also reported. This study supports the proposal that surface chemistry plays an important role in controlling the shapes of nanostructures in the wurtzite family.
167
4.5.2 Catalyst Assisted Growth Though one-dimensional Zinc Sulfide nanostructures grow nicely without a catalyst, it is useful to see what impact the presence of a catalyst has. It has been predicted that the presence of a catalytic particle increases the likelihood of the growth of individual nanostructures at that location, reduces so called weed growth, and would allow for lower deposition temperatures for the synthesis. In order to experimentally identify if the Vapor-Liquid-Solid (VLS) growth mechanism would indeed allow more control over various aspect of the nanostructures, a substrate was partially coated with a metal catalyst, while another section of the substrate was left void of any catalyst. This experimental setup directly allows for the comparison of Vapor-Solid (VS) grown ZnS nanostructures with VLS-grown ZnS nanostructures under the same experimental conditions. To distribute catalysts onto the substrate a solution of 3 nm gold particles were dispersed on to a silicon substrate. The experimental parameters for this synthesis were exactly same as the experiment in the previous section. These parameters were used in order to ensure that both the VLS and VS mechanisms would occur for this synthesis. The results are shown in Figure 4.20.
168
Figure 4.20 Low magnification SEM of substrate partially coated with a catalyst to promote VLS growth and partially left void of catalysts for VS growth
The line in the figure demarcates the area where gold catalysts were present with the area where they were not. The difference between the two types of growth is striking. Three characteristics become apparent. The first concerns the density of the nanostructures. In VLS growth, the gold catalyst particles act as site-specific nucleation points. In VS growth, a seed or defect in the substrate acts as the nucleation site. It is expected that VLS growth will lead to a more dense forest of nanostructures. The second characteristic observable in this image is the dimensionality of the structures. The VS-grown nanostructures are considerably larger than the VLS-grown nanostructures. The reduced dimensionality of the VLS-grown nanostructures comes about from the size confinement induced by the catalyst that was described in chapter 2. As the supersaturated catalysts precipitate the solid in order to maintain a eutectic composition, the solid being produced immediately at the nanowire-catalyst boundary is limited to the diameter of the catalyst. It is this property that allows some control over dimensionality of the nanostructures to be
169
achieved. However, in examining the VLS-grown structures more closely, it is evident that the width of the nanobelts are larger than the catalysts. This can be seen in Figure 4.21.
Figure 4.21 SEM image of a single nanobelt growing from a gold catalyst
The third characteristic of these structures is the catalyst to nanostructure ratio. As seen from Figure 4.21, only one nanostructure grows from the catalyst. It has been shown with zinc oxide (ZnO) that this number could be higher.[49] This is in stark contrast from the VS-grown nanostructures were not only did multiple types of nanostructures, i.e. belt, saws, wires, but it was common to observe 10-20 ZnS nanostructures growing from a s i n g l e “ s e e d ” c r y s t a l . B y c o n t r o l l i n g t h e s i z e o f t h e c a t a l y s t s , i t i s p o s s i b l e t o h a v e a single nanostructure grow from one catalyst. The results from the VLS-grown ZnS nanostructures indicate that in order to attain more control over the synthesis process that the vapor-liquid-solid mechanism must be employed. The use of a catalyst enables manipulation of key parameters like dimensionality, positioning, and concentration density of the nanostructures.
170
4.6 Polar Surface Dominated Zinc Sulfide Nanostructures Because of the polarity of some of the low energy surfaces of the wurtzite crystal, nanostructures that are dominated by those surfaces can show some very unique characteristics. This has been studied extensively in ZnO.[50] Similar effects show up in ZnS nanobelts.[6]
Figure 4.22 Two specific cases of nanobelt crystallographic configurations that can lead to significant differences in growth
In essence there are two main cases where the polar surface can have a large impact on the nanostructure morphology. Both of these cases are diagrammed in Figure 4.22. The first is when the polar surface is on the smaller face of the nanobelt (the side defined by the thickness of the belt), as in the first picture below. Because of the polar surface and the different chemical reactivity of Zn and S, this can result in asymmetric secondary growth off of the nanobelts. The second case is when the polar surface is on the larger face of the nanobelts (the side defined by the width of the belt). Here, because of the immense electrical potential that must be compensated for, the entire morphology of the nanobelt can be altered.
171
4.6.1 Polar Growth in Other Nanomaterials
Figure 4.23 Some examples of (a and b) ZnO nanohelices and (c) nanobow, another polar dominated ZnO nanostructure
Recently, helical/spring/ring nanostructures have begun to gather interest. The helical structure is a particularly interesting variant of one-dimensional nanostructures as the helix is the most fundamental structural configuration for proteins, RNA, and other biomolecules. Such structures have been synthesized using other wurtzite materials, such as ZnO[26, 51-53] and AlN[54]. Also, recent reports have shown SnO2 nanohelices, with the rutile structure[55]. Examples of the ZnO nanohelices are shown in Figure 4.23. All of these materials have in common that they form helices or rings due mainly to the polar
172
surface domination that their crystal structures allow. With ZnO and other materials that have formed rings or helices, the structures typically form cleanly, with no secondary growth off the main axis of the nanostructure. 4.6.2 Helical and Ring-like Morphologies of Zinc Sulfide Nanostructures For the first time ZnS nanohelices, which have the wurtzite structure, were synthesized for the research reported in this section. The ZnS nanohelices have significant secondary growth occurring always towards the inner radius of the helix. A model is presented for this growth along with some explanation. The synthesis procedure of the ZnS nanohelices follows a simple vapor deposition process. Commercially available ZnS powder (Alfa Aesar, 99.99% purity, metal basis) was placed in the center of a single-zone horizontal tube furnace, where the temperature, pressure, atmosphere, and evaporation time are controlled. Single-crystal silicon substrates with 1.5 nm of Au deposited with a thermal evaporator on them were placed “ d o w n s t r e a m ” a n d a t a l o w e r t e m p e r a t u r e r e g i o n i n t h e f u r n a c e . T h e s e w e r e u s e d t o collect the deposited material. Using a rotary vacuum pump, a vacuum was pulled into the tube for several hours to purge oxygen from the chamber. After evacuation to a pressure of about 2×10⁻³ torr, the temperature in the center of the tube was elevated to 1000° C at a rate of 50°C/min. A N2 gas flow was introduced into the system at a rate of 50 standard cubic centimeters per minute (sccm). The inert N2 gas acted as a carrier for transporting the sublimated vapor to cooler regions within the tube furnace for deposition onto the silicon substrates and also to help increase the pressure. The pressure was allowed to increase to a value of 20 torr (about 25 mbar). The silicon substrates reached a temperature of about 750° C. During evaporation, the products deposited onto the silicon
173
substrates. After maintaining these conditions for two hours, the nitrogen gas flow was turned off and a vacuum was pulled. At this time, the furnace was allowed to cool to room temperature.
Figure 4.24 (a) Low magnification SEM image showing the high yield of ZnS nanohelices on the silicon substrate; (b) a very long, very densely branched nanohelix; (c) a more typical moderately branched nanohelix; (d) a densely branched nanohelix that has fallen in on itself and loosely formed a ring-like structure
The synthesized samples were analyzed using x-ray diffraction (XRD) and on a scanning electron microscope (SEM, LEO 1530). The XRD data (not shown) confirmed that the as-synthesized sample was wurtzite ZnS. Optically, it appears yellowish white and covers the silicon deposition substrate. The synthesized material has relatively high yield on the substrate and shows a high degree of reproducibility. The deposited material has a dominant morphology consisting of helices of ZnS nanowires. Some SEM images of the
174
sample are shown in Figure 4.24. As can be seen, there is a large amount of the helical structures in the deposition. Also, there are several different types of nanohelices. There is a very long, densely branched nanohelix, a helix that has curled up on itself, forming a ring-like structure, and a helix that is long and moderately branched. This last is by far the most commonly observed nanohelix, though the others are common as well. The helices grow with varying radii, pitches, and density of branch growth, but the branches always grow towards the inside of the helical loop. This can be seen in even greater detail in Figure 4.25. This suggests that there is a specific crystallographic direction along with the branches and the spine of the loop grow.
Figure 4.25 (a) A lightly branched nanohelix. The branched secondary growth always grows towards the inside of the helix as seen particularly in the two boxed areas. The nanohelices consist of a spine which coils in a helical shape. On the inner side of the spine there is Y-shaped secondary growth which all grow to the same length along an individual nanohelix; (b) another typical, moderately branched nanohelix. The Y-shaped branches always point towards the inside of the coil, regardless of the handedness of the nanohelix, suggesting that the inner face is the chemically active Zn-terminated face.
Statistical data was taken on a wide range of aspects of the helices. Analyzing nearly one hundred separate helices, recording pitch, radius, and handedness of the helix, no direct relationship is found between pitch and radius and no preferences towards handedness is
175
noticed (of the helices able to be measured about 60% were right-handed and about 40% were left-handed). Figure 4.26 shows some nanohelices and some of the helical properties measured. The nanohelices are made up of two main parts. The first is the spine, which coils in a helical shape. The second is the secondary growth, which consists of Y-shaped branches that, for each nanohelix, all grow to the same size. This branched secondary growth always grow towards the inside of the helix. Because of the equal length of the secondary growth, it is believed that that growth occurs after the growth of the spine growth and that the branches all begin growth at around the same time. The alternative is that there is a mechanism limiting the size of the branch growth. However, branches on different nanohelices are sized differently and no significant relationship can be determined between the size of the secondary growth and other aspects of the nanohelix. Previous models for helical growth of wurtzite structures examine the change in electrostatic energy it would take to bend a non-coiled one-dimensional nanostructure. These have provided values for a maximum thickness-to-radius ratio based on the bending modulus, the dielectric constant, and the charge density,[26, 53, 56] t R
*
2
24 0
Y
(Eq. 4.1)
For wurtzite ZnO, this critical ratio is about (t/R)* = (3.8 ± 0.2)×10-2. The dielectric constant of ZnS i s ε = 8 . 9 . [ 5 7 ] T h e c h a r g e d e n s i t y o f Z n S i s a b o u t 0 . 1 8 a n d t h e v a l u e f o r -1 t h e b e n d i n g m o d u l u s o n t h e o r d e r o f 7 5 G P a t h e n w e g e t α ≈ ( 1 . 3 1 × 1 0 ).[58, 59] The
shaded area in the figure indicates the energetically favorable values for forming a nanohelix. A statistical study conducted on the wurtzite ZnS nanohelices show that they have a maximum t/R ratio of nearly 0.1 and an average ratio of about .05. A diagram indicating how the pitch and diameter of each nanohelix were determined is also shown. 176
Figure 4.26 (a) The branched secondary growth always grows towards the inside of the helix. The nanohelices consist of a spine which coils in a helical shape. On the inner side of the spine there is Y-shaped secondary growth which all grow to the same length along an individual nanohelix (the scale bar is 5 μ m); (b) Plot of the thickness of the spine (or initial growth) of the helix vs. the radius of the helix. Values were obtained on nearly one hundred separate helices on pitch, radius, and handedness of the helix and on thickness of the spine and length and density of secondary branch of growth. While no direct relationship between pitch and radius can be determined, there does appear to be a critical thickness-to-radius ratio below which the helices form; (c) Another moderately branched nanohelix showing how the pitch and diameter of the nanohelices were determined (the scale bar is 2 μ m) The sample was also characterized using a transmission electron microscope (TEM, Hitachi Field Emission 2000 and JEOL 4000) in order to determine its crystallographic character. In Figure 4.27 we see some typical examples of the sample under TEM. During the transfer of the sample from the deposition substrate to the TEM grids, the helices were typically cut and broken. This is why much of the deposit seen on the TEM
177
is not the full helix, but only a part of it. The parts, however, maintain their curvature. Similar to the recently discussed ZnO nanohelices that maintained their helical shape after being cut by a focused ion beam (FIB), this implies that there is minimal stored elastic energy in the nanohelix.[51] We also see an example of a full helical turn of the ZnS on the TEM. As seen in the SEM images, the nanohelices consist of a spine (or backbone) which coils in a helical shape. On the inner side of the spine, a Y-shaped, or three pronged, secondary growth appears. Both the spine and the secondary growth were examined extensively with the TEM.
Figure 4.27 (a) A typical TEM image of the ZnS nanohelix. It has been broken due to transfer from the silicon deposition substrate to the TEM sample holder. (b) An SEM closeup of the secondary Y-shaped branches growing towards the inside of the helix. The rough growth surface is visible
The two outer branches, that form the top of the Y-structure, together form the (01-13) twin structure. For wurtzite crystals, the possible twin boundaries are defined by (01-11), (01-12), and (01-13)[60]. Theoretically, the lowest energy twin boundary is (01-13) and, though there has been no direct evidence of it in bulk crystals, it has been seen in nanobelts of ZnO and CdSe.[61] Figure 4.28 shows a typical branch growth. Its SAED pattern is shown and it is composed of two sets of diffraction spots that have a
178
symmetrical geometrical layout. The common spot is the twin boundary plane (01-13) and the incident beam direction is [-2110]. In the dark field image of the twin plane, we also see a large number of stacking faults. This indicates a large amount of local strain in the crystal. Using this electron diffraction pattern, we determine that the growth of the secondary branches is along the [0002] direction. This is the c-plane and a high energy growth direction.
Figure 4.28 (a) Top down view of a typical branch growth, its SAED pattern shows (c) the (01-13) twin structure and the growth direction of the branch is along the [0002] direction; (b) The dark field image of the branch growth and the twin plane revealing a large number of stacking faults, indicating a large amount of local strain in the crystal
The primary growth (spine) of the nanohelix appears to be rough, but single crystal according to the diffraction pattern shown in Figure 4.29. Here, the incident beam direction is the [0001] direction. The major growth direction of the spine is the [0-110] direction, or the (2-1-10) family of planes as the growth front. This is consistent with previous findings that the a-direction is a fast growth direction for wurtzite crystals.[7, 39, 48] The high-resolution image is used in measuring the lattice spacing along the spine of the nanohelix. The d-spacing for the (2-1-10) planes is measured to be .372 nm and the
179
spacing for the (01-10) planes is measured to be .369 nm. These values are close to the literature bulk value of .382 nm for each plane.
Figure 4.29 (a) A bright field TEM image with the beam direction along the length of one of the secondary growth branches (inset); the SAED pattern of the spine is shown in (b) it shows that the growth plane of the spine is the (2-1-10) plane; (c) Dark field image highlighting the growth of the spine and the branched growth. A high-resolution image is taken from (d) the spine of the nanohelix and (e) the rough secondary growth
Determining the plane of the spine off of which the secondary growth occurs is somewhat less direct. By looking at SEM images of the ZnS nanohelices, it is determined that the angle between the secondary growth branches is 120°. This is also confirmed in that the angle of the (01-13) twin that determines the growth of the branches is 120°. Further, we know that the growth plane of the spine of the nanohelix is the (2-1-10) plane. Using this we can apply a schem a t i c s u c h a s t h e o n e i n F i g u r e 4 . 3 0 . T h e a n g l e α i s e q u a l t o t h e a n g l e that the (0001) plane of the Y-branch makes with the (01-13) plane, or 60°. Looking at 180
the calculated (2-1-10) diffraction pattern of a hexagonal crystal, we see that that the plane that is about 60° off is the (01-11) plane. This tells us that the secondary growth grows off of the spine from this plane and, as the secondary growth is inwards towards the center of the nanohelix, the (01-11) plane is the center facing plane of the nanohelix. As stated above, previous studies on nanoscale helical structures have argued that it is the polar plane that causes the curling up of the nanostructure into a helix. By projecting the ZnS wurtzite structure along the [2-1-10] direction, we see that there are several polar surfaces. There are the typical ±(0001) polar surfaces and there are also the ±(10-11) and ±(10-1-1) surface. This is consistent with finding that the mechanism for the spine curling up in a helical structure is electrostatic relaxation. Also shown is an electrostatic model for the spine of the nanostructure, with a positive or negative charge on the inside of the helix and the opposite charge on the outside.
181
Figure 4.30 (a) A schematic showing the various planes and growth directions of the nanohelix. The main spine of the nanohelix is oriented along the (2-1-10) plane, with the polar (01-11) plane towards the inside of the helix. Off of this polar plane, the secondary growth occurs; (b) A projection of the ZnS wurtzite lattice along the (2-1-10) showing key planes. The {0001} and {01-11} families of plane are polar, terminating in Zn+ cations and S- anions. The {0-113} plane is also shown, as it is the side plane of the initial secondary growth off of the nanohelix spine
Using this data, the following model for the growth of the branched ZnS nanohelices works. The spine grows first, under typical conditions and forming the helical shape because of the electrostatic forces. The helix forms because of the simultaneous rolling of the nanostructure while it continues to grow along the [0-1-10] direction. Similar to earlier reports on ZnO nanohelices,[52] the inner surface is the polar (01-11) surface. This polarity, along with the surface roughness, provides the sites for secondary growth.
182
The secondary growth is Y-shaped, in which the two top branches form the (01-13) twin structure. For any given nanohelix, the secondary growth is all the same length, implying that its growth occurs for an equal amount of time and begins at the same time – after the growth of the spine. Previous studies of helix structures have presumed that the main cause of helix or spiral formation. This, in the paper reported for ZnS nanohelices, was also presumed to be the cause of the helix formation of the spine of the ZnS nanostructures.[62] However, there are some aspects of the growth that suggest that something different is contributing to the formation of the nanohelices. When electric polarization is the cause of the formation of the helical shape, then the nanowire is equally likely to coil with the negatively charged plane on the inside of the helix or with the positively charged plane on the inside of the helix. This model has been shown and tested with ZnO.[63] It was discussed earlier how secondary growth on ZnS nanostructures of all types occurs off of the Zn-terminated planes because of the higher chemical activity of these planes. These correspond with the positive terminated planes. With the ZnS nanohelices, the secondary growth (the Y-shaped structure), is seen only on the inside of the helical structure. This indicates that the ZnS helices form only with the positively charged Znterminated plane on the inside of the helix. It seems that some other factor is contributing to the formation of the helix. An alternative explanation has been determined for the spontaneous bending. In early work, a theory was presented for explaining the spontaneous bending of thin III-V semiconducting crystals which have alternatively terminated surfaces.[64] This model is based on the difference in surface tensions and
183
energies between the surfaces. According to this model, the Zn-terminated surfaces would be preferred as the inner surface of the nanohelix. 4.7 Multi-Component Systems The integration of nanotechnology with biological systems and use in medical applications is expected to produce major advances in molecular imaging, biology, and bioengineering.[65-68] ZnS has a good recent history of use in multi-component systems, particularly in use of ZnS/CdSe quantum dot materials. The optical properties of ZnScapped CdSe nanocrystals make them useful for optical coding of biomolecules.[69] Hybrid CdSe/ZnS nanostructures have shown great use because of their luminescence properties and enhanced quantum effects. ZnS-capped CdSe nanocrystals exhibit a strong and stable band-edge luminescence at room temperature.[70] CdSe/ZnS core/shell quantum dots have also been suggested for biomedical tagging. For example, CdSe QDs coated with a ZnS layer are very luminescent at room temperature.[71] Their emission wavelength has also been shown to be tunable with both size and composition gradient.[72] When individual QDs are bioconjugated with certain proteins, for example, t h e y c a n t h e n b e u s e d t o “ t a g ” ( b y c o u p l i n g ) v a r i o u s b i o m o l e c u les (such as proteins and nucleic acids).[65] In general, ZnS is useful for a lot of applications that require biocompatibility.[73] 4.7.1 Zinc Sulfide Nanowires on Cadmium Selenide Crystals ZnS nanowires and nanorods are similar enough so as to be able to consider them together. ZnS nanowires have been synthesized several times.[8, 10-12, 14] Meng et al have grown ultrafine ZnS nanowires on gold-coated silicon substrates that have diameters between 10-20 nm.[12] However, one of the more interesting processes has been using
184
CdSe as a substrate upon which to grow orientation aligned bundles of ZnS nanowires.[14] With these, the synthesis of CdSe-based, epitaxially grown, size-controlled, orientationaligned ZnS nanowire bundles was achieved. Previous reports of such bundles, with materials such as TiO2, had required an etching process to form the wires.[74] The method presented with this research forms the nanowires without etching. As will be discussed, this method provides a pathway to the site specific and size-controlled growth of these bundles for use in hybrid-semiconducting nanotechnologies. The orientation-aligned ZnS nanowire bundles were synthesized through a two-step thermal evaporation process in a horizontal tube furnace. Commercially available CdSe powder (Alfa Aesar, 99.995% purity, metal basis) was placed in the center of a single zone tube furnace (Thermolyne 79300). A vacuum was pulled in the tube for several hours to purge oxygen from the chamber. After evacuation, the temperature in the center of the tube was elevated to 750° C. A nitrogen (N2) gas flow was introduced into the system at a rate of 50 sccm. The gas acted as a carrier to transport the sublimated vapor to cooler regions within the tube furnace for deposition. The pressure was maintained at 300 mbar. After one hour, the furnace was allowed to cool. Then, the CdSe powder was replaced in the center of the furnace by commercially available ZnS powder (Alfa Aesar, 99.99% purity, metal basis). The temperature in the center of the tube was elevated to 1050° C. Again, a nitrogen gas flow was introduced at 50 sccm and the pressure was maintained at 300 mbar. The system was held in this condition for a period of 60 minutes. Single crystal silicon substrates were used for synthesizing the nanostructures. These
185
substrates were placed downstream from the source material to collect the deposited nanostructures. The sample was analyzed on a Scanning Electron Microscope (SEM). The deposited material has an extremely high yield on the substrate and shows very easy reproducibility. This deposit is shown in Figure 4.31. The deposited material in the ass y n t h e s i z e d s a m p l e h a s a d o m i n a n t m o r p h o l o g y c o n s i s t i n g o f “ b u n d l e s ” o f w i r e -shaped ZnS nanostructures epitaxially grown on CdSe crystals. Within the bundles, the nanowires show a high degree of size uniformity and a large density.
Figure 4.31 (a) SEM image of ZnS nanowire bundles grown on a CdSe substrate that was first deposited on Si(111). The CdSe is a solid film, but the ZnS is bundles of aligned nanowires; (b) Side view of the ZnS nanowire bundles; (c) Enlarged SEM image of a ZnS bundle showing traces created due to fluctuation in growth condition, presenting the equal growth rate of all of the nanowires; (d) Fractured surface of the sample showing the direct growth of ZnS nanowires on the CdSe crystals and the preservation in the ZnS nanowire bundles of the surface morphology of the CdSe crystal; (e) Enlarged top view of the aligned ZnS nanowires
186
Transmission electron microscopy shows that the individual nanowires are single-crystal wurtzite ZnS, with trace amounts of CdSe interspersed within the lattice. This is shown in Figure 4.32. Each individual wire is relatively dislocation-free. From the diffraction pattern of the bundles, we can see that the wires grow along the [0001] direction, or the close-packed c-direction of the wurtzite crystal. It is most notable that the all of the wires in the bundle, when the bundle is examined as a whole, show the same growth direction – the [0001] direction. This means that the ZnS nanowires are orientationally aligned, with the fast growth direction being the [0001] direction. High resolution images of an individual wire confirm that it is single crystal and that the c-direction is the fastest growth direction. Also, an EDS pattern taken in the TEM shows that the wires are ZnS with negligible CdSe. The orientational alignment of the nanowires may allow for greater ease in manipulation and for the development of novel electronic and sensing devices.
187
Figure 4.32 (a and b) Low-magnification TEM images of bundles of aligned ZnS nanowires and the corresponding electron diffraction patterns from the bunches showing orientation ordering among the [0001] nanowires; (c) High-resolution TEM image of a nanowire showing uniform lattice structure; (d) EDS of ZnS nanowires showing the chemical composition
The optical properties of the synthesized sample were characterized by a UV photoluminescence (PL) system using a N2 pulse laser with an excitation wavelength of 337nm. As compared to the PL spectrum obtained from both the source CdSe powders and the ZnS powders, whose luminescence peaks are at 735 nm and 463 nm, respectively, the deposited sample shows a peak at 699 nm, shifted toward blue for 36 nm from bulk CdSe and 12 nm from CdSe nanobelts. This proximity to CdSe is possibly due to the relatively small amount of ZnS nanowires as compared with the CdSe crystals.
188
The nanowire bundles are formed by a two step growth process that occurs in sync with the two-step synthesis procedure. In the first phase, the CdSe crystals grow epitaxially on the silicon (111) substrate. Without the presence of a catalyst such as gold to guide the growth of the CdSe material, the crystals form ubiquitously on the substrate. Then, when the furnace is elevated to a higher temperature, the CdSe nanocrystals provide a site for the uniform growth of the ZnS wires. The uniformity of height among the wires indicates that the ZnS wires grow at a constant rate. Because of the common crystallographic orientation of the individual nanowires, the wires have a common growth rate. So, because the wires within a single bundle all begin synthesis at roughly the same time, the topographical shape of the CdSe nanocrystal is maintained as the wire-bundle grows. The bundles also maintain the width and depth profile of the CdSe crystal upon which the wires fare originated. The end result is that the nanowire bundles exhibit some of the same morphology characteristics as a larger wurtzite nanocrystal would, including the six-fold symmetry along the [0001] direction. This growth is shown schematically in Figure 4.33.
Figure 4.33 Schematic showing the growth of the ZnS nanowire bundles. First the CdSe crystals form on the silicon surface (left); Second, the ZnS nanowires grow on the top surface of the CdSe, thus forming the bundles
189
Above, it was stated that this synthesis method could provide a pathway to site-specific and size-controlled growth of nanowires for use in semiconducting nanotechnologies. The method would be as follows. A uniform layer of CdSe is deposited onto a substrate, in a desired pattern at desired sites. Then, the ZnS nanowires are synthesized onto the CdSe layer producing an array of uniformly sized ZnS nanowires. Because the CdSe layer is uniform across the substrate and the ZnS growth mimics the layout of the CdSe substrate, the nanowires will all be the same height. By patterning the CdSe, some degree of site specificity should also be able to be obtained. By using conjugation and surface modification techniques, this array of ZnS nanowires could be used in a variety of nanotechnology devices. This line of research was not followed, however, as it was determined that using a metal catalyst particle was a better path for site specific growth. However, the synthesis of CdSe-based, epitaxially grown, size-controlled, orientationaligned ZnS nanowire bundles was achieved. The formation of these occurs by a two step process, whereby the ZnS nanowires grow epitaxially from CdSe nanocrystal surfaces. These nanowires are aligned and all grow at the same rate. This also marked the first production of multi-component II-VI semiconductor systems with one-dimensional nanostructures. 4.7.2 Core-shell ZnS-SiO2 Ultra-long Nanowires One-dimensional nanostructures – nanowires – have been reported extensively in recent years. In particular, semiconducting and II-VI nanowires have drawn large interest because the ability to synthesize them in numerous configurations, under varying conditions, and their potential use in many different applications. However, the extensive
190
reports of the growth of one-dimensional nanostructures have revealed several challenges that remain. One of these challenges arises with the difficulty in producing very long nanowires so that they may be used in more applications and manipulated post-synthesis through simple methods. Another challenge is the need to synthesize a large quantity of aligned nanostructures that can also be manipulated easily post-synthesis. Meeting both of these challenges would move the development of one-dimensional nanostructures a long way towards their industrial use. In the research for this dissertation, the large scale synthesis of laterally aligned, ultralong ZnS nanowires with a SiO2 shell was achieved. ZnS/SiO2 structure are desirable in some r e s p e c t s b e c a u s e o f t h e s i l i c a s h e l l ‟ s a b i l i t y t o s h i e l d t h e w u r t z i t e Z n S n a n o s t r u c t u r e f r o m damage and to suppress the surface chemical reactivity of the different facets of the nanostructure.[7, 75] The synthesis of the ZnS/SiO2 nanowires is based on a very simple vapor deposition process. Commercially available ZnS powder (Alfa Aesar, 99.99% purity, metal basis) is placed in the center of a single-zone horizontal tube furnace (Thermolyne 79300), where the atmosphere, evaporation time, pressure, and temperature are controlled. Single-crystal silicon substrates with 20 nm of gold deposited with a thermal evaporator are placed “ d o w n s t r e a m ” a t a l o w e r t e m p e r a t u r e r e g i o n i n t h e f u r n a c e . U s i n g a r o t a r y v a c u u m p u m p , a vacuum was pulled in the tube for several hours to purge oxygen from the chamber. After evacuation to a pressure of about 2×10⁻³ torr, the temperature in the center of the tube is elevated to 1000 °C at a rate of 50 °C/min. A N2 gas flow was introduced into the system at a rate of 50 standard cubic centimeters per minute (sccm). The pressure in the
191
system is allowed to increase to a value of 20 torr and is held there. The silicon substrates reach a temperature of about 750 °C. After maintaining these conditions for between one and two hours, the N2 gas flow is turned off and a vacuum with a pressure around 2×10⁻³ torr is achieved. At this time, the furnace is allowed to cool to room temperature. The as-synthesized samples were analyzed initially using x-ray diffraction (XRD) and scanning electron microscopy (SEM). The samples were also examined using transmission electron microscopy (TEM). The XRD data confirmed that the synthesized sample contained wurtzite ZnS and amorphous SiO2. Optically, it appears as a very thick deposition of white powder covering the silicon deposition substrate.
Figure 4.34 (a and b) SEM images of the laterally aligned ultra-long ZnS nanowires; (c) The EDS shows Zn, S, Si, and O elements
SEM images determined that the growth consists of nanowires that are aligned laterally to the substrate and in the direction of the N2 gas flow in the tube furnace. These can be
192
seen in Figure 4.34. It can be seen that the deposit consists of aligned nanowires on the top layer. The EDS taken in the SEM reveals that the elements Zn, S, Si, and O are present. Because silicon is used as the deposition substrates in the experiment, the Si and O elements were originally interpreted to be the silicon and oxidation layer on the silicon. The original x-ray diffraction (XRD) showed peaks that matched up very well with the ZnS wurtzite structure. It also showed peaks that matched the amorphous SiO2. Again, these were thought to be associated with the oxidation layer on the silicon substrates.
Figure 4.35 (a) A composite SEM image showing the growth of the ultra-long aligned nanowires across the entire silicon deposition substrate; (b) An optical image of a typical synthesis shows the high density and yield of the synthesis run. Note that the nanowires begin from the (c) upstream side of the substrate and are so long that they continue off of the (d) downstream side of the substrate
This experiment showed a high degree of repeatability. Figure 4.35 shows a composite SEM image taken across the entire 1 cm length of the deposition substrate. It was attempted to follow an individual nanowire across the entire length of the substrate. However, every time this was attempted the nanowire was lost about two-thirds of the way through because of the shifting of the image in the SEM. Optical images show that
193
the nanowires in fact grow longer than the substrate. SEM images confirm this. The nanowires align along the direction of the flow gas.
Figure 4.36 (a) A TEM image of the nanowire, revealing the core-shell structure; (b and c) Electron diffraction patterns taken from the shell and core respectively. Note that the shell reveals a typical amorphous pattern while the core reveals the wurtzite pattern, with growth proceeding in the [0001] direction; (d and e) The corresponding EDS spectra taken from the shell and core respectively. Here, the shell is made of only Si and O, where as the core is determined to be ZnS
Though originally thought to be merely ultra-long nanowires of ZnS, TEM images reveal a different story. These are seen in Figure 4.36. The TEM images reveal a core-shell structure, with wurtzite ZnS as the core and amorphous SiO2 as the shell. The core and shell are visible using a low-resolution TEM image. By electron diffraction and EDS, the crystal structure and makeup were determined. It was also determined that the ZnS core of the nanowire grows along the [0002] direction, the fast growth direction of wurtzite ZnS. In order to determine the growth mechanism of these core-shell nanowires, synthesis at different time lengths was also performed in order to see the evolution of the growth of
194
the nanowires structures. Synthesis runs were performed where the synthesis temperature was maintained for 15 minutes, 30 minutes, 45 minutes, 60 minutes, 90 minutes, and 110 minutes. All of these experiments also show a high degree of repeatability. The SEM images of this are shown in Figure 4.37. Though ZnS/SiO2 nanowires were synthesized with growth times as short as 15 minutes, the alignment of the nanowires was not observed in growth times shorter than 45 minutes.
Figure 4.37 Synthesis runs were performed where the peak temperature was maintained for a variety of times in order to obtain a picture of the growth of the nanowires. Typical SEM images of the run time are shown, with their corresponding times above
In order to understand the synthesis and properties of these nanowires, several different time-based studies were performed. First, a TEM-based study of the various widths of the ZnS core and the SiO2 shell. This consisted of measuring, via TEM images, the widths of both the core and the shell and comparing them over time.
195
Measuring over 30 nanowires from each section, raw data shown in Appendix X, the average widths of the core and the shell for each time section was determined.
Figure 4.38 (a) The average shell and core widths are shown as determined by a TEM study. The trendlines are added to emphasize that while the shell size increases dramatically, the core size decreases only slightly with longer synthesis times; (b) The ratio of the core volume to the shell volume as it changes over time. This was determined based on the TEM studies. This data differs with what was determined from the XRD studies
196
This was determined by measuring the width of the core (the diameter) and then determining the width of the shell by measuring the total width of the nanowire and subtracting the core width. The graph of this data is shown in Figure 4.38. Not included on this graph are the measurements for the 30 minute synthesis time. This is done so as to make the graph more accessible. For completeness, it should be noted that these measurements confirm the overall trend, showing an average ZnS core size of 13.84 nm and a silica shell width average of 1.59 nm. Even though these data confirm the general trend of decreasing core size and increasing shell size, they were determined to be outliers first by noticing their distortion of the graph and second through a typical statistical analysis in that both values are more than one standard deviation away from the value closest to them. As can be seen, the ZnS core tends to get smaller with longer synthesis times (although, not by a lot) while the SiO2 shell grows larger with longer synthesis times. Because the shell and core have a constant width along their entire length, their relative volumes should be able to be determined from their respective widths according to the following equation: (Eq. 4.2) where
is the radius of the ZnS core and ws is the width of the SiO2 shell. The
results of this are also shown. However, the human measurement error when measuring the width of the two parts. This error is compounded when determining the volume ratio. While TEM analysis supplied detailed information regarding the nature of a small subset of nanowires in the sample, X-ray diffraction (XRD) techniques were utilized to provide a better understanding of the global nature of the nanowires. In particular, we sought to investigate the overall changes in relative core and shell thickness with respect to
197
synthesis time. Six samples were examined, each differing only according to experimental reaction time. These times were: 30 min., 45 min., 60 min., 75min., 90min., and 110 min. X-ray diffraction measurements were performed on each sample using a PANalytical X-Pert Pro MRD with Copper K-alpha radiation. As-grown samples previously affixed to aluminum SEM stubs with carbon tape were loaded into the Sample Holder for Solid Samples affixed to the MRD Cradle. Alignment was then performed via manual scans to check the sample position with respect to the 2theta, Z, and Omega axes. (Beam attenuators were used to reduce risk of harm to the detector in the case of a direct hit from the source.) Sample offsets were input into the system to calibrate zero positions for each axis. In this way, the sample was aligned parallel to the beam without the necessity to perform otherwise potentially harmful sample preparation.
Figure 4.39 Full scan XRD diffraction patterns from each sample with corresponding reaction times. Broad humps at low 2theta most likely correspond to amorphous alumina shell. Disappearance of peaks in some patterns most likely due to variation of sample a l i g n m e n t i n X R D m a c h i n e w i t h r e s p e c t t o t h e s a m p l e ‟ s o r i e n t a t i on
198
For the measurements, the radiation beam emitted from an x-ray tube set to line focus, coupled with a parabolic mirror and 1/8o fixed divergence slits was directed toward the unmodified nanowire coated substrate. After interacting with the sample, a 0.27 degree parallel plate collimator with a flat graphite crystal diffracted beam monochromator helped refine the signal before reaching the Miniprop large window point detector. 2theta-omega measurements were taken with a tube power of 45 kV and 40 mA, from 5o 120o 2 θ w i t h a 0 . 0 1 step size and a 2 hour and 23 minute total scan time. The results of
scans from each sample are shown in Figure 4.39. Note that while intensities vary, scans show similar peak profiles for each sample. This result confirms that the experimental design and sample preparation were such that phases remained consistent, and no contamination occurred. Variations in intensity may occur for many reasons, including instrumental effects, sample alignment, nanowire density, relative phase concentration, crystallite size, and preferred sample orientation, among others. Phase identification of the diffraction pattern in Figure 4.40 using PANalytical X-Pert HighScore Plus software yielded three known phases: Au (PDF#893697,) the Wurtzite phase of ZnS (PDF#75-1547) and SiO2 (PDF#79-1914). MDI Jade7.5 software was later used to confirm phase results. To determine relative ZnS and SiO2 core and shell thickness from the XRD data we utilized both semi-quantitative phase analysis and crystallite size analysis for the ZnS phase. HighScore and Jade software was utilized to perform semi-quantitative and crystallite size analysis, respectively. The XRD pattern is made up of a set of peaks that can be identified based on position and intensity. Peak positions provide information regarding the crystal structure and symmetry of each phase contained within the sample,
199
w h i l e i n t e n s i t i e s r e f l e c t t h e t o t a l s c a t t e r i n g f r o m e a c h p l a n e i n t h e p h a s e ‟ s c r y s t a l structure.[76, 77] The diffraction intensity for peak hkl in ph a s e α h a s b e e n c a l c u l a t e d a s : (Eq. 4.3) where the terms are defined as the following: Ih = Intensity of reflection of hkl in phase k l α α ; I0 = incident beam intensity; r = d i s t a n c e f r o m s p e c i m e n t o d e t e c t o r ; λ = X -ray wavelength; (e2/mc2)2 = square of classical electron radius; µs = linear absorption coefficient of the specimen; Vα = v o l u m e f r a c t i o n o f p h a s e α ; Mhkl = multiplicity of reflection hkl o f p h a s e α ; vα= v o l u m e o f t h e u n i t c e l l o f p h a s e α ; 2θ m = diffraction angle of the monochromator; F(hkl)a = s t r u c t u r e f a c t o r f o r r e f l e c t i o n h k l o f p h a s e α ( i . e . , t h e vector sum of scattering intensities of all atoms contributing to that reflection); The next to last term on right represents the Lorentz-polarization and monochromator correction. Noting that many of explain features of the experimental setup, these can be combined into an experimental constant, Ke. We can also combine structure factor terms into a constant, which we will call Khkl. Further simplifying the equation, we substitute the weight fraction for the volume fraction, phase density rather than volume, and the s p e c i m e n m a s s a d s o r p t i o n c o e f f i c i e n t ( µ / ρ ) f o r t h e l i n e a r a d s o r p t i o n c o e f f i c i e n t . T h i s produces the following equation:
(Eq. 4.4) The semi-quantitative analysis in X'Pert HighScore works on basis of reference intensity r a t i o ( R I R ) v a l u e s w h i c h d i v i d e s t h e i n t e n s i t y o f t h e p h a s e t o b e d e t e r m i n e d ( α ) b y a t h e i n t e n s i t y o f a s t a n d a r d m a t e r i a l ( β ) , o f t e n c o r u n d u m ( A l 2O3). Using this method, it is not
200
necessary to know the mass fraction of the investigated phase explicitly. The most general definition the RIR equation is in the following form:[78]
(Eq. 4.5) The Irel term allows for cases in which only some of the peaks in each phase are utilized for analysis. If 100% of the peaks in both phases are used, the second term will reduce to one. The above equation compares intensities of two phases at a time. To perform analysis on a sample containing multiple phases, we use the Normalized RIR Method, developed and published by Chung et al. which allows for writing a system of n equations to solve for n weight fractions. This form of the equation
(Eq. 4.6) is employed by the HighScore software. The scale factor and the RIR values from the database are used to perform the calculation. This method determines the estimated mass fractions of the identified phases. The normalization used in this method assumes that the sum of all identified phases is 100%. This means that unidentified or amorphous phases will reduce the meaning and accuracy of this analysis.[79, 80] In the case of this sample, TEM found the SiO2 shell to be mostly amorphous in nature, which was validated through broad peak signatures in the XRD pattern. In such cases, the result is still a good estimate of the relative mass fractions of the identified phases. Since our investigation seeks to simply find the relative differences between ZnS and SiO2 in the sample, rather than actual empirical values for these, we believe this method is reasonable for our purposes. Figure 4.41 below shows a graph illustrating the relative concentration of ZnS versus SiO2 for each of our samples, as reaction time increases. 201
Figure 4.40 Graph of the XRD determined ratio of ZnS to SiO2 with different synthesis times. According to the XRD studies, the amount of ZnS compared with SiO2 peaks with the 75 minute synthesis run
As shown in the graph, the percentage of ZnS in the samples seems to start at a lower value, then rise to a peak around 75 minutes reaction time, and then decrease again at longer reaction times. Note again that due to the amorphous nature of the SiO2 in the sample, these values must be regarded as indicative of a trend, rather than as stand-alone empirical values. To ensure that the trends exhibited by the semi-quantitative analysis were valid, we employed another method to determine relative core-shell thickness values in our samples. TEM results have shown the ZnS core material in the ultral-ong nanowires to be crystalline. Therefore, determination of the size of this ZnS crystal at various reaction
202
times should provide useful information regarding the size variation of the core in our ZnS/SiO2 core-shell nanowires as the reaction progresses. Crystallite size analysis is a common XRD technique that exploits changes in peak width due to variations in the p e r i o d i c i t y o f a c r y s t a l . T h i s t e c h n i q u e i s o f t e n r e f e r r e d t o a s “ g r a i n s i z e a n a l y s i s ” however, this term is not exactly correct, as a single grain may contain one or more twins, however, each orientation of the crystal will contribute to the total number of “ c r y s t a l l i t e s ” i n t e r a c t i n g w i t h t h e x -ray beam. The diffraction pattern of a perfect crystal appears as a very sharp peak with very high intensity. This is because for a perfect crystal, there is only one orientation of the beam, the sample, and the detector, such that the Bragg condition for perfectly constructive phase shifts is met: (Eq. 4.7) w h e r e λ = t h e w a v e l e n g t h o f t h e i n c i d e n t r a d i a t i o n ; d = s p a c i n g b e t w e e n p l a n e s o f a t o m s i n t h e s a m p l e ; n = a n y p o s i t i v e i n t e g e r ; θ = t h e a n g l e b e t w e e n t h e i n c i d e n t r a y a n d t h e scattering planes. Any deviation from this perfectly sharp peak pattern is termed “ p e a k b r o a d e n i n g . ” P e a k broadening can be the result of material defects such as residual stresses within the sample and finite grain size (as well as instrumental broadening neglected here). Smaller grain or crystallite sizes usually produce broader peaks. This makes sense on an intuitive level, since smaller grains are less similar to the case of a perfect crystal realtive to larger grains. For x-ray reflections that are out of phase by only a small fraction of the integral wavelength, the corresponding planes that produce complementary destructive interference may lie deep within the crystal. For the case of nanometer-sized crystallites,
203
these may not exist. This causes peak broadening in fine crystallite samples. This broadening condition is given by the Sherrer equation:
(Eq. 4.8) where t = t h e s i z e o f t h e p a r t i c l e s ; θ = t h e p e a k p o s i t i o n i n r a d i a n s ; λ = t h e x -ray wavelength. In addition to crystallite size broadening, peak broadening can also be caused by residual stresses in the material. Stresses within the crystal cause corresponding strains, which result in a change of planar spacing, shifting the peaks. Often residual stresses produce a combination of compressive and tensile strains. These shifts in the diffraction peaks in either direction will be observed in the pattern as broadening described by:
(Eq. 4.9) w h e r e Δ d / d = i s t h e v a l u e g i v e n f o r t h e s t r a i n . The effects of the crystallite size broadening and strain broadening combine to produce the total peak broadening seen in the diffraction pattern. Adding the two equations together and rearranging yields the following equation for total peak broadening:
(Eq. 4.10) This equation can be considered as the y = mx +b form of an equation for a straight line. Here, the B can be substituted with the full-width at half-maximum (FWHM) value of each peak, meaning the width of the peak at the point of half the vertical intensity. The sample size and strain are determined by m e a s u r i n g B f o r e a c h p e a k a n d p l o t t i n g B c o s θ v s . s i n θ . I n t h i s “ W i l l i a m s o n -H a l l ” p l o t , t h e n , t h e s t r a i n i s o n e -half of the slope of the line, and the particle size is a function of the intercept.[81, 82]
204
Figure 4.41 Results of the XRD study determining the ZnS crystallite size. This assumes that the ZnS core is single crystal
For our measurements, we utilized Jade software to refine the pattern to a Pseudo-Voigt peak profile and create a Williamson Hall plot for each sample using only peaks that corresponded to the ZnS Wurtzite phase. This produced a value for the average crystallite size of ZnS in each sample. The results are plotted in Figure 4.41 above. This plot shows a similar trend to the previous figure, which plotted relative concentrations of ZnS in the samples, though here the peak is shifted a little toward shorter reaction times. While in this analysis the amorphous nature of SiO2 does not increase the degree of error, there are several factors that may skew results. One is the oriented nature of the sample, which if not loaded with precise consistency into the sample holder, can cause deviations in relative intensity. Also, the equations described above assume a perfectly spherical crystallite geometry, which is a good approximation in bulk samples, however, as seen in the TEM and SEM images, the nanowires in our sample possess more cylindrical geometries. Further, we are assuming a crystalline (not polycrystalline) ZnS core. If this is an inaccurate assumption, changes in crystallite size
205
may be descriptive only of variations in grain size, rather than the core itself. TEM analysis showing fully crystalline the ZnS core material, however, makes us confident that this assumption is valid. Finally, due to difficulty in the omega alignment for these samples, some diffraction patterns exhibited rather low intensities, making accurate profile fitting more difficult. For these reasons, we believe that this plot provides a strong validation of our previous conclusions regarding ZnS core thickness changes, yet again with values more correctly interpreted as indicative of a trend, rather than as accurate quantitative data. Through the use of semi-quantitative phase analysis and crystallite size analysis on XRD diffraction patterns produced by samples created at varying reaction times, we have been able to show a clear trend in the variation of core thickness in the ZnS/SiO2 core-shell ultra-long nanowires as reaction time progressed in our experiments. At short reaction times, both the relative percentage of ZnS in the nanowires and the average size of the ZnS Wurtzite crystal begins at a low base value. As the reaction progresses, there the ZnS core grows larger, and a larger proportion of ZnS is present in the nanowires, relative to the SiO2 amorphous shell. As the reaction continues, however, the size of the core reaches a maximum value, and then the ZnS core material again decreases, both in size and concentration. Because XRD measures information from a much larger footprint than TEM, we can be more confident that these results are indicative of overall changes in sample characteristics, having direct correlation to the reaction dynamics, rather than in just a few individual nanowires which may or may not be typical.
206
Figure 4.42 The photoluminescence spectra from six different synthesis times are shown. Note that each spectrum has two major peaks, one at 340 nm and one at 532 nm. The legend refers to series number. They correspond as follows, Series1 = 30 min, Series2 = 45 min, Series3 = 60 min, Series4 = 75 min, Series5 = 90 min, Series6 = 110 min
Lastly, the synthesized samples had their photoluminescence spectra taken and compared with each other based on the synthesis time. The resulting graphs are shown all together in Figure 4.44. All of the spectra show two peaks. One is at 340 nm and the other is at around 532 nm. The lower one is explained by the pure ZnS PL peak. In a literature search it is somewhat rare to see the 340 nm ZnS peak. This 340 nm peak is associated with about 3.65 eV, a good match for the theoretical wurtzite band gap of 3.91 eV. The 532 nm peak is significantly more common. This translates into 2.33 eV. It is associated with Zn defects, vacancies, and interstitials in the ZnS crystal. In the lowest growth time measured, that of 30 minutes, a peak is also seen at 375 nm. This corresponds with 3.30 eV. This peak has been shown to exist in studies of pure silica.[83]
207
Figure 4.43 A comparison of the photoluminescence peak intensities as they change over time. The 340 nm peak stays virtually the same with longer synthesis runs where as the 532 nm peak increases initially and then at the longest synthesis time it disappears completely
It is interesting to compare the intensities of the peaks and how they change with longer synthesis times. This is shown more clearly in Figure 4.43. Focusing on the 532 nm peak an interesting phenomenon occurs. The intensity of the peak increases with increasing synthesis times from 30 up until 90 minutes. However, at the 110 minute point, the peak all but disappears. Also, the ratio between the two major peaks increases with longer synthesis times from 30 up until 90 minutes. Again, at the 110 minute measurement, the ratio drops dramatically. So what is happening here? We know from TEM studies that the size of the silica shell is increasing over time, while the ZnS core is remaining relatively the same, with a slight
208
decrease in size. This data supports that conclusions that ZnS nanowires form first and the silica shell forms around them. Because of the large amount of gold deposited and used as a catalyst, there are many sites for the formation of the ZnS nanowires and they form very quickly. The elevated synthesis temperature allows for two things to happen. First, the gold particles that are formed are small and enable the limited radius of the ZnS nanowires. Second, the gold forms a eutectic alloy with the silicon substrate enabling the formation of the shell on the ZnS nanowires, oxidized by the residual oxygen in the vacuum chamber. The formation of this shell prevents the further deposition of ZnS on the core nanowire, thus limiting the direct growth of the ZnS core any further. However, some minor growth of the ZnS core could occur by diffusion through the amorphous SiO2 shell. This mechanism could also lead to some of the already grown core of ZnS and might explain some of the reduction in size of the ZnS core. This last explanation is supported strongly by the XRD data which shows an initial increase in the ZnS core size and then a later decrease. This growth model is shown in Figure 4.44.
Figure 4.44 A suggested growth model for the core-shell nanowires The photoluminescence data is a little more difficult to explain. Some studies have shown that SiO2 passivation layers on Si have the effect of increasing the intensity of the photoluminescence peaks received. In fact, the intensity of the emission is correlated to
209
the degree of surface passivation on the films.[84] It is possible that the SiO2 shell is having the same effect on the ZnS c o r e ‟ s l u m i n e s c e n c e . T h i s , a l o n g w i t h t h e X R D suggesting that the ZnS core is increasing initially, would explain the increase in intensity of the 532 nm peak. What remains unexplained is the complete disappearance of this peak at very long synthesis run times. Several explanations are plausible. It is possible that ZnS core is so reduced that the intensity of the 532 nm peak is greatly reduced. Because this peak is associated with defects in the crystal structure, it could be that the defects are too energetic to remain in the ZnS core. It is also possible that the SiO2 shell is so large that it is eclipsing the effective luminescence of the much smaller ZnS core. In summary of this study, Core-Shell ZnS-SiO2 nanowires were synthesized through a simple vapor deposition process. The nanowires were aligned as-synthesized along the direction of the gas flow in the system. They are also considered to be ultra-long, at least o n t h e o r d e r o f 1 0 0 μ m , p e r h a p s o n t h e o r d e r o f a c e n t i m e t e r . T h e i r g r o w t h w a s a n a l y z e d using synthesis time differential studies and examining the subsequent growth using SEM, TEM, and XRD. Also, their photoluminescence was examined and some of the phenomena seen were explained. 4.8 Biocompatibility Biocompatibility is the ability of a material to perform with an appropriate host response in a specific application.[85] The biocompatibility of a long-term implantable medical device refers to the ability of the device to perform its intended function, with the desired degree of incorporation in the host, without eliciting any undesirable local or systemic effects in that host. As such, biocompatibility is a two-way process that evolves over time, with host affecting material and material affecting host. With such definitions of
210
biocompatibility, it is difficult to imagine a single test that will determine the biocompatibility of a material. In short, however, these definitions lead to some specific conclusions about what ought to be determined about a material that is used in biological applications. The first test is to make sure that the material does not injure the biological material in any way. Second, it needs to be determined what impact the host environment will have on the material. If the host dissolves the material or otherwise degrades its properties, then the material is not very useful for long term devices.
Figure 4.45 (a) Before and (b) after SEM images of placing the core-shell ZnS-SiO2 Nanowires into a phosphate buffer solution for 30 minutes. No damage is done to the nanowires by the PBS
With this in mind, a series of experiments has begun on the core-shell ZnS-SiO2 nanowires to determine what degree of biocompatibility they may have. ZnS separately have been used in potential biological applications.[86] Crystalline silica is are highly toxic and produce crystal-induced inflammation.[87] However, amorphous SiO2 is
211
considered non-toxic. Therefore, it is turned to determining what impact a host will have on the nanowires. Figure 4.45 shows the before and after SEM images of placing the nanowires into a buffer solution for 30 minutes. As can be seen, the ZnS with amorphous SiO2 shell was not dissolved in the buffer solution. This bodes well for future studies of biocompatibility of the structure. 4.9 Summary This chapter has included some highlights of research that the author has performed on the compound Zinc Sulfide. It does not include all of the work; instead it calls attention to the research highlights. Comments on anisotropic growth in ZnS was included as well as a discussion of the synthesis of several different morphologies of ZnS. These included nanowires, nanosaws, helical ZnS nanowires with secondary growth, and multicomponent systems such as ZnS nanowires grown on CdSe crystals and core-shell ZnSSiO2 ultra-long nanowires. A brief analysis of biocompatibility of ZnS nanowires was included. All of this synthesis was discussed in the framework of the theory of onedimensional growth presented in Chapter 2 and it was determined that much of the growth can be explained by the model.
212
4.10 References
1. Kao, Y.H., Probing the microstructure in semiconductor layer materials using synchrotron radiation. Chinese Journal of Physics, 1997. 35(4): p. 353-364. 2. Odom, T.W., et al., Optical properties of surface-patterned nanostructures. Talanta, 2005. 67(3): p. 507-513. 3. Prabhu, R.R. and M.A. Khadar, Characterization of chemically synthesized CdS nanoparticles. Pramana-Journal of Physics, 2005. 65(5): p. 801-807. 4. Sorel, R.A., Silicon-based group IV heterostructures for optoelectronic applications. Journal of Vacuum Science & Technology a-Vacuum Surfaces and Films, 1996. 14(3): p. 913-918. 5. Zhu, Y.C., et al., Oriented assemblies of ZnS one-dimensional nanostructures. Advanced Materials, 2004. 16(9-10): p. 831. 6. Moore, D., et al., Wurtzite ZnS Nanosaws produced by polar surfaces. Chemical Physics Letters, 2004. 385: p. 8-11. 7. Ma, C., et al., Nanobelts, Nanocombs, and Nano-windmills of Wurtzite ZnS. Advanced Materials, 2003. 15: p. 228-231. 8. Rosenberg, R.A., et al., Effects of in situ vacuum annealing on the surface and luminescent properties of ZnS nanowires. Applied Physics Letters, 2005. 86(26): p. 263115. 9. Zapien, J.A., et al., Room-temperature single nanoribbon lasers. Applied Physics Letters, 2004. 84(7): p. 1189-1191. 10. Radovanovic, P.V., et al., General Synthesis of Manganese-Doped II-VI and III-V Semiconductor Nanowires. Nano Letters, 2005. 5(7): p. 1407-1411. 213
11. Barrelet, C.J., et al., Synthesis of CdS and ZnS Nanowires Using Single-Source Molecular Precursors. Journal of the American Chemical Society, 2003. 125(38): p. 11498-11499. 12. Meng, X.M., et al., Structure- and size-controlled ultrafine ZnS nanowires. Chemical Physics Letters, 2003. 382(3-4): p. 434-438. 13. Wang, Y.W., et al., Catalytic growth and photoluminescence properties of semiconductor single-crystal ZnS nanowires. Chemical Physics Letters, 2002. 357(3-4): p. 314-318. 14. Moore, D., Y. Ding, and Z.L. Wang, Crystal Orientation-Ordered ZnS Nanowire Bundles. Journal of the American Chemical Society, 2004. 126: p. 14372-14373. 15. Ma, C., et al., Nanobelt and nanosaw structures of II-VI Semiconductors. International Journal of Nanotechnology, 2004. 1: p. 431-451. 16. Gong, J., et al., Rapid synthesis and visible photoluminescence of ZnS nanobelts. Chemical Communications, 2005. 3: p. 351-353. 17. Jiang, Y., et al., Hydrogen-assisted Thermal Evaporation Synthesis of ZnS Nanoribbons on a Large Scale. Advanced Materials, 2003. 15: p. 323. 18. Li, Q. and C. Wang, Fabrication of wurtzite ZnS nanobelts via simple thermal evaporation. Applied Physics Letters, 2003. 83: p. 359. 19. Li, Y.Q., et al., Manganese doping and optical properties of ZnS nanoribbons by postannealing. Applied Physics Letters, 2006. 88: p. 013115. 20. Kar, S., S. Biswas, and S. Chaudhuri, Nanometre to micrometre wide ZnS nanoribbons. Nanotechnology, 2005. 16: p. 3074-3078. 21. Shakin, C. and J. Birman, Electronic Energy Bands in ZnS: Preliminary Results. Physical Review, 1958. 109(3): p. 818-819.
214
22. Joannopoulos, J.D. and M.L. Cohen, Electronic Charge Densities for Zns in Wurtzite and Zincblende Structures. Journal of Physics C - Solid State Physics, 1973. 6(9): p. 1572-1585. 23. Ray, B., II-VI Compounds. 1 ed. International series of monographs in the science of the solid state, ed. B.R. Pamplin. Vol. 2. 1969, Oxford, London, U.K.: Pergamon Press. 268. 24. Jiang, Y., et al., Zinc selenide nanoribbons and nanowires. Journal of Physical Chemistry B, 2004. 108(9): p. 2784-2787. 25. Lefebvre, P., et al., Measurement of the optical band gap and crystal-field splitting in wurtzite CdTe. Physical Review B, 1996. 53(23): p. 15440-15442. 26. Kong, X.Y. and Z.L. Wang, Spontaneous Polarization-Induced Nanohelixes, Nanosprings, and Nanorings of Piezoelectric Nanobelts. Nano Letters, 2003. 3(12): p. 1625-1631. 27. Hughes, W.L. and Z.L. Wang, Nanobelts as nanocantilevers. Applied Physics Letters, 2003. 82(17): p. 2886-2888. 28. Chen, G.Y., et al., Adsorption-Induced Surface Stress and Its Effects on Resonance Frequency of Microcantilevers. Journal of Applied Physics, 1995. 77(8): p. 3618-3622. 29. Fritz, J., et al., Translating biomolecular recognition into nanomechanics. Science, 2000. 288(5464): p. 316-318. 30. Wu, G.H., et al., Origin of nanomechanical cantilever motion generated from biomolecular interactions. Proceedings of the National Academy of Sciences of the United States of America, 2001. 98(4): p. 1560-1564. 31. Drobyshevski, E.M., In searches for daemons. Physics of Atomic Nuclei, 2000. 63(6): p. 1037-1041.
215
32. King, C.N., Electroluminescent Displays. Journal of Vacuum Science & Technology A - Vacuum Surfaces and Films, 1996. 14(3): p. 1729-1735. 33. Zhang, Z.X., et al., Low-temperature growth and photoluminescence property of ZnS nanoribbons. Journal of Physical Chemistry B, 2005. 109(39): p. 18352-18355. 34. Shen, X.P., et al., Template-based CVD synthesis of ZnS nanotube arrays. Chemical Vapor Deposition, 2005. 11(5): p. 250-253. 35. Topol, A.W., et al., Chemical vapor deposition of ZnS : Mn for thin-film electroluminescent display applications. Journal of Materials Research, 2004. 19(3): p. 697-706. 36. Timon, V., et al., Theoretical adlayer surface morphology of wurtzite 2 × 2 reconstructions of the GaN(0001) surface. Journal of Physics: Condensed Matter, 2005. 17(1): p. 17-26. 37. Smith, A.R., et al., Reconstructions of the GaN(0001-bar) Surface. Physical Review Letters, 1997. 79(20): p. 3934-3937. 38. Duke, C.B., Reconstruction of the cleavage faces of tetrahedrally coordinated compound semiconductors. Festkorperprobleme - Advances in Solid State Physics 33, 1994. 33: p. 1-36. 39. Ma, C., et al., Single-Crystal CdSe Nanosaws. Journal of the American Chemical Society, 2004. 126: p. 708-709. 40. Yin, L.W., et al., Self-assembled highly faceted wurtzite-type ZnS singlecrystalline nanotubes with hexagonal cross-sections. Advanced Materials, 2005. 17(16): p. 1972. 41. Vohs, J.M. and M.A. Barteau, Conversion of Methanol, Formaldehyde and Formic-Acid on the Polar Faces of Zinc-Oxide. Surface Science, 1986. 176(1-2): p. 91114.
216
42. Krastanow, L. and I.N. Stranski, Short notifications and notes. On the crystallisation of alkali halogenide crystals on fluorite. Zeitschrift Fur Kristallographie, 1938. 99(5): p. 444-448. 43. Volmer, M. and A. Weber, Germ-formation in oversaturated figures. Zeitschrift Fur Physikalische Chemie--Stochiometrie Und Verwandtschaftslehre, 1926. 119(3/4): p. 277-301. 44. Frank, F.C. and J.H. van der Merwe, One-dimensional dislocations. Proceedings of the Royal Society of London Series a-Mathematical and Physical Sciences, 1949. 198(1053): p. 205-225. 45. Shchukin, V.A. and D. Bimberg, Spontaneous ordering of nanostructures on crystal surfaces. Reviews of Modern Physics, 1999. 71(4): p. 1125-1171. 46. Thomson. Fast Moving Fronts Comments by Zhong Lin Wang. ESI Special Topics 2005 [cited 2006 September 22, 2006]; Available from: http://esitopics.com/fmf/2005/july05-ZhongLinWang.html. 47. Dai, Z.R., Z.W. Pan, and Z.L. Wang, Gallium oxide nanoribbons and nanosheets. Journal of Physical Chemistry B, 2002. 106(5): p. 902-904. 48. Pan, Z.W., Z. Dai, and Z.L. Wang, Nanobelts of semiconducting oxides. Science, 2001. 291: p. 1947-1949. 49. Gao, P.X., Y. Ding, and I.L. Wang, Crystallographic orientation-aligned ZnO nanorods grown by a tin catalyst. Nano Letters, 2003. 3(9): p. 1315-1320. 50. Wang, Z.L., et al., Semiconducting and Piezoelectric Oxide Nanostructures Induced by Polar Surfaces. Advanced Functional Materials, 2004. 14(10): p. 943-956. 51. Gao, P., et al., Conversion of Zinc Oxide Nanobelts into Superlattice Structured Nanohelices. Science, 2005. 309: p. 1700-1704.
217
52. Yang, R., Y. Ding, and Z.L. Wang, Deformation-Free Single-Crystal Nanohelices of Polar Nanowires. Nano Letters, 2004. 4(7): p. 1309-1312. 53. Kong, X.Y., et al., Single-Crystal Nanorings Formed by Epitaxial Self-Coiling of Polar Nanobelts. Science, 2004. 303: p. 1348-1351. 54.
Duan, J., et al., AlN nanorings. Journal of Crystal Growth, 2005. 283: p. 291-296.
55. Yang, R. and Z.L. Wang, Springs, Rings, and Spirals of Rutile-Structured Tin Oxide Nanobelts. Journal of the American Chemical Society, 2006. 128(5): p. 1466-1467. 56. Hughes, W. and Z.L. Wang, Formation of Piezoelectric Single-Crystal Nanorings and Nanobows. Journal of the American Chemical Society, 2004. 126: p. 6703-6709. 57. Streetman, B.G. and S. Banerjee, Solid state electronic devices. 5th ed. 2000, Upper Saddle River, N.J.: Prentice Hall. xviii, 558 p. 58. Li, X., et al., Mechanical Properties of ZnS Nanobelts. Nano Letters, 2005. 5(10): p. 1982-1986. 59. Vinsome, P.K.W. and Richards.D, Charge Density in Zincblende Semiconductors. Journal of Physics Part C Solid State Physics, 1971. 4(18): p. 3177-3185. 60. Bere, A. and A. Serra, Atomic structures of twin boundaries in GaN. Physical Review B (Condensed Matter and Materials Physics), 2003. 68(3): p. 033305-4. 61. Ding, Y. and Z.L. Wang, Structure Analysis of Nanowires and Nanobelts by Transmission Electron Microscope. Journal of Physical Chemistry B, 2004. 108: p. 12280-12291. 62. Moore, D., Y. Ding, and Z.L. Wang, Hierarchical Structured Nanohelices of ZnS. Angewandte Chemie International Edition, 2006. 118(45): p. 5150-5154.
218
63. Hughes, W.L. and Z.L. Wang, Formation of piezoelectric single-crystal nanorings and nanobows. Journal of the American Chemical Society, 2004. 126(21): p. 6703-6709. 64. Cahn, J.W. and R.E. Hanneman, (111) Surface Tensions of III-V Compounds and Their Relationship to Spontaneous Bending of Thin Crystals. Surface Science, 1964. 1(4): p. 387-398. 65. Chan, W.C. and S. Nie, Quantum Dot Bioconjugates for Ultrasensitive Nonisotopic Detection. Science, 1998. 281(5385): p. 2016-2018. 66. LaVan, D.A., D.M. Lynn, and R. Langer, Moving smaller in drug discovery and delivery. Nature Reviews Drug Discovery, 2002. 1(1): p. 77-84. 67. Niemeyer, C.M., Nanoparticles, proteins, and nucleic acids: Biotechnology meets materials science. Angewandte Chemie-International Edition, 2001. 40(22): p. 41284158. 68. Niemeyer, C.M., Functional hybrid devices of proteins and inorganic nanoparticles. Angewandte Chemie-International Edition, 2003. 42(47): p. 5796-5800. 69. Han, M.Y., et al., Quantum-dot-tagged microbeads for multiplexed optical coding of biomolecules. Nature Biotechnology, 2001. 19(7): p. 631-635. 70. Brokmann, X., et al., Colloidal CdSe/ZnS quantum dots as single-photon sources. New Journal of Physics, 2004. 6(85): p. 712. 71. Hines, M.A. and P. Guyot-Sionnest, Synthesis and characterization of strongly luminescing ZnS-Capped CdSe nanocrystals. Journal of Physical Chemistry, 1996. 100(2): p. 468-471. 72. Dabbousi, B.O., et al., (CdSe)ZnS core-shell quantum dots: Synthesis and characterization of a size series of highly luminescent nanocrystallites. Journal of Physical Chemistry B, 1997. 101(46): p. 9463-9475.
219
73. Zhang, Y. and N. Huang, Intracellular uptake of CdSe-ZnS/polystyrene nanobeads. Journal of Biomedical Materials Research Part B-Applied Biomaterials, 2006. 76B(1): p. 161-168. 74. Yoo, S., S. Akbar, and K. Sandhage, Nanocarving of bulk titania crystals into oriented arrays of single-crystal nanofibers via reaction with hydrogen-bearing gas. Advanced Materials, 2004. 16(3): p. 260. 75. Fan, X., et al., Formation of ZnS/SiO2 nanocables. Applied Physics Letters, 2005. 86(17): p. 173111. 76.
Cullity, B.D. and S.R. Stock, Elements of X-Ray Diffraction. 3rd ed. 2001.
77. Klug, H.P. and L.E. Alexander, X-Ray Diffraction Procedures: For Polycrystalline and Amorphous Materials. 2nd ed. 1974. 78. Snyder, R.L., The Use of Reference Intensity Ratios in X-Ray Quantitative Analysis. Powder Diffraction, 1992. 7: p. 186-193. 79. Chung, F.H., Quantitative Interpretation of X-Ray-Diffraction Patterns of Mixtures .1. Matrix-Flushing Method for Quantitative Multicomponent Analysis. Journal of Applied Crystallography, 1974. 7: p. 519-525. 80. Chung, F.H., Quantitative Interpretation of X-Ray-Diffraction Patterns of Mixtures .3. Simultaneous Determination of a Set of Reference Intensities. Journal of Applied Crystallography, 1975. 8: p. 17-19. 81. Baumbach, T., D. Lubbert, and M. Gailhanou, Strain relaxation in surface nanostructures studied by X-ray diffraction methods. Materials Science and Engineering B Solid State Materials for Advanced Technology, 2000. 69: p. 392-396. 82. Louer, D. and N. Audebrand, Microstructure analysis of nanocrystalline powders by X-ray diffraction. Acta Physica Polonica A, 2002. 102(1): p. 45-56.
220
83. Leone, M., et al., Conformational disorder in vitreous systems probed by photoluminescence activity in SiO2. Physical Review B, 1999. 60(16): p. 11475-11481. 84. Seraphin, A.A., S.T. Ngiam, and K.D. Kolenbrander, Surface control of luminescence in silicon nanoparticles. Journal of Applied Physics, 1996. 80(11): p. 64296433. 85. Williams, D., Revisiting the Definition of Biocompatibility. Medical Device Technology, 2003. 14(8): p. 10-13. 86. Akerman, M.E., et al., Nanocrystal targeting in vivo. Proceedings of the National Academy of Sciences of the United States of America, 2002. 99(20): p. 12617-12621. 87. Freitas, R.A., Nanomedicine Vol. IIA: Biocompatibility. Nanomedicine. Vol. 2. 2003: Landes Bioscience. 330.
221
CHAPTER 5 CONCLUSION
Through the development of powerful tools such as TEM, AFM, and other microscopy and manipulation techniques, researchers are able to observe and manipulate objects on the level of atom, molecule, or macromolecules. The creation and discovery of novel nanostructures provide for interesting scientific objects and for useful technological innovation. Further, the establishment of new theories to predict and explain phenomena on the nanometer scale and the synthesis of the materials is important for the development of this technology. These developments are helping to develop nanotechnology in a large variety of fields. As an active field in nanomaterials research, the work presented in this dissertation has contributed to the state of the research in nanotechnology.
5.1 The State of the Research The current focus in nanotechnology is in the development and use of nanoscale materials. The development of nanomaterials represents a critical component in achieving the goals of nanotechnology research. The current focus of the research is on the characterization and the use of nanoscale materials in device applications. Quantum dot research has focused on biomedical applications. Semiconductor and luminescent devices have focused on the development of one-dimensional nanostructures. However, actual device use is still with thin films. This is because one-dimensional nanostructures have
222
several technical synthesis issues that have yet to be solved. Among these are alignment and site specific growth as well as an understanding of controlling the growth. Nanoscience and nanotechnology are still in their early stages of development as a field. Their development is ongoing and if they are to make a lasting technological and scientific impact, the fundamental concepts and basic theoretical constructs governing the designs of nanoscale materials must be properly understood.
5.2 Summary of Research The research presented in this thesis has focused on working through these problems with one-dimensional nanostructures and developing novel ZnS nanoscale materials. Chapter 1 provided the overall framework of nanomaterials research in which the research for this thesis was undertaken. Chapter 2 described the various synthesis techniques that are used for creating one-dimensional nanostructures. In particular, the focus was on the particular horizontal tube furnace setup that is used for the synthesizing of the nanomaterials in this dissertation. A growth model was developed based in part on BCF vapor growth of thin films and subsequent thin film growth theory. This theory was developed to help explain the anisotropic growth of the one-dimensional nanostructure, especially the various growth rates of the different crystallographic directions. This model was developed with ZnS one-dimensional nanostructures in mind but the qualitative lessons drawn from it are applicable to other materials as well. In chapter 3, highlights of research performed on CdSe were presented. These focused on the growth of nanowires, nanobelts, and nanosaws and looked at the data compiled from a systematic
223
analysis of the synthesis conditions. This analysis was compared with the model developed in chapter 2 and found to qualitatively be in good agreement. The bulk of the research was presented in chapter 4. This focused on the wurtzite ZnS compound. Many ZnS nanostructures were synthesized and characterized. They were considered in the framework of the model of growth that was developed in chapter 2. Towards the end of the research presented, multi-component and hierarchical systems were discussed.
5.3 Future Avenues of Research ZnS has enormous potential as a useful material for nanoscale devices. This is due in particular to the anisotropic crystal structure and the wide range of structures that it can be formed in. Research investigating the properties of ZnS nanomaterials needs to be encouraged, particularly electronic and piezoelectric response properties. In order to maximize its use as a nanomaterial, further research needs to be performed in order to develop novel morphologies. In particular, two classes of nanomaterial development are starting to see an increase in research and show much promise, multi-component systems and hierarchical structures. 5.3.1 Multi-Component Systems The integration of nanotechnology with biological systems and use in medical applications is expected to produce major advances in molecular imaging, biology, and bioengineering. ZnS has a good recent history of use in multi-component systems, particularly in use of ZnS/CdSe quantum dot materials. The optical properties of ZnScapped CdSe nanocrystals make them useful for optical coding of biomolecules. In
224
general, ZnS is useful for a lot of applications that require biocompatibility. As such research developing CdSe-ZnS multi-component systems represents an optimum pathway in developing biocompatible anisotropic one-dimensional nanostructures with ZnS. Development of these on a width scale approaching those of quantum dots is also a very useful pathway for research. The size range of 2-6 nm is of great interest in particular because of their dimensional similarity with biological macromolecules such as DNA and proteins. Developing systems that could allown for an integration of ZnS nanostructures with biological systems could have applications in medical diagnostics, therapeutics, and other medical areas. 5.3.2 Hierarchical Structures Hierarchical nanostructures offer the potential to synthesize networks of different types of nanostructures simply. They also offer the opportunity to create complex structures with unique properties, such as tunable optics. Hierarchical structures have already been synthesized for a wide array of ZnO and other II-VI semiconductor wurtzite materials. The research developing the ZnS hierarchical helices is a first step in further utilizing anisotropic ZnS as a material for developing these structures. Also useful would be development of ZnS nanowires/quantum dot systems, in order to take advantage of the optical properties and tenability of the quantum dots, along with the ease of fabricating an electrode based device out of nanowires. 5.3.3 Surface Functionalization Another key to the use of one-dimensional nanostructures is surface functionalization. Complex architectures, sensing applications, and other uses of one-
225
dimensional nanostructures all rely on the successful functionalization of the surface of the nanomaterial. The difficulty with functionalization is two-fold. First, an appropriate species must be able to adhere to the surface of the nanostructure via a method that does not degrade the nanostructure. It is preferable that the species can adhere to specific surfaces. The second difficulty is selecting a functionalizing species that has specificity for other species. This species depends on what the application for the nanostructure is. The development of surface functionalization of ZnS nanostructures would be extremely useful in helping to further the use of the nanostructures in devices and applications.
226
APPENDIX A DERIVATIONS A.1 Vapor Solid Equation Derivations The length growth rate of the nanostructure can be expressed as the contribution from the adatom flux from the nanostructure side to the growth front, tempered by the ratio of the atomic volume of the growth species and the radius of the nanostructure: dL
D side
dt
n side L z
(Eq. A.1) rside
where rside is the radial size of the one-dimensional nanostructure, nside is the area number density of adatoms on the substrate surface and is governed by the equation (first we consider a general ns)
Ds
2
ns
ns
Rs
ns t
s
Ds – surface diffusivity of adatoms on the substrate τ average diffusion time per adatom s– Rs – effective impingement rate of adatoms on surface
In typical growth, incorporation of the species into the crystal structure dominates d e s o r p t i o n , a s w e s a w a b o v e . S o τ s can be considered to be the average time before incorporation.
227
Assuming that there is no angular dependence on growth, the Laplacian is 2
2
r
2
Ds
r
2
r
2
1
r
1
ns
r
r
ns
ns
Rs
ns t
s
If we assume that we are in a steady state, then the right side of the equation goes to zero. We also hold the boundary term ns(rw)=0 in compliance with the assumption that the individual nanostructures are sufficiently far apart. The solution to this can then be expressed in terms of the modified Bessel function of the second kind.
r
K0 ns r
R
s
Ds
1
where
K0 x
cos x
Ds
Ds
s
cos xt
sinh t dt
0
rw
K0
remembering that
s
0
t
2
dt 1
s
s
, the surface diffusion length.
We also have to consider the adatom density on the separate sides of the nanostructure. They can similarly be considered as substrates and a similar equation to above can describe it for each surface of growth. 2
D side
n side
n side z direction
R side
2
n side t
side
where z is the length coordinate along the nanostructure (z=0 at one end and z=L at the other end).
228
The steady state solution obeys the flux boundary condition at the base of the n side ( 0 )
nanostructure (z=0, r=rw), D side
D s n s ( rw ) z
Js
r
side
, and the density
boundary condition at z=L, nw(L)=0, is given by
n side ( z )
R side
side
cosh( z /
side
)
cosh( L /
side
)
1
L
sinh
Js
side
z side
side
D side
cosh
,
L side
By taking the derivative of the solution for ns(r), we can see that the explicit expression for the adatom flux from the substrate surface to the nanostructure is given by the following
K1 Js
side
Rs
rside s
s
K0
rside s
Along the growth direction, we can have the following limits
For L>>z, n side ( z )
so, we have n side ( z )
R side
R side
Js side
side
side
D side
1
side
and as z L, n side ( z )
cosh( z /
side
)
cosh( L /
side
)
Js
2 R side
sinh side
D side
L
side
z side
side
cosh
L side
229
a
R side Js
b l e t ‟ s s u b s t i t u t e t h e f o l l o w i n g ,
side
side
side
D side 1
c
side
by combining like terms and differentiating with respect to z, we get
n side z
a
c sinh cz
z
b tanh Lc
bc cosh cz
cosh Lc
Returning to our original formulation in equation A.1, dL
R side
dt
side
Js
side
sinh
L
tanh
L
Js
side
cosh
L
(1.4.2.4) rside
This gives us the following limits: L dL
D side
dt
side
side
R side
R side
side
rside
rside
The first term is the effective diffusion distance of all the adatoms. This is multiplied by the second term, which compares the size of the adatom with the size of the surface on which it is depositing. It is these two factors that determine the growth rate of the nanostructure. It is interesting to note that when the length gets sufficiently large, the Js-
230
side
term falls out, implying that, as expected, the farther the structure grows away from
the substrate, the less important the substrate is in growth. A.2 Vapor Liquid Solid Equation Derivations The difference between VLS and VS derivations is that we have to include an extra term in VLS growth – the term representing the contribution from direct impingement on the metal catalyst particle. This term first comes in in our formulation of the growth rate so that instead of Equation A.1 we have the following:
(Eq. A.2)
Like above (in A.1) Ds
2
ns
ns
Rs
ns t
s
Ds – surface diffusivity of adatoms on the substrate τ average diffusion time per adatom s– Rs – effective impingement rate of adatoms on surface Ω – the atomic (or molecular) volume of the growth species
In typical growth, incorporation of the species into the crystal structure dominates d e s o r p t i o n , a s w e s a w a b o v e . S o τ s can be considered to be the average time before incorporation.
231
Assuming that there is no angular dependence on growth, the Laplacian is 2
2
r
2
Ds
r
2
r
2
1
r
1
ns
r
r
ns
ns
Rs
ns t
s
If we assume that we are in a steady state, then the right side of the equation goes to zero. We also hold the boundary term ns(rw)=0 in compliance with the assumption that the individual nanostructures are sufficiently far apart. The solution to this can then be expressed in terms of the modified Bessel function of the second kind.
r
K0 ns r
R
s
Ds
1
where
K0 x
cos x
Ds
Ds
s
cos xt
sinh t dt
0
rw
K0
remembering that
s
0
t
2
dt 1
s
s
, the surface diffusion length.
We also have to consider the adatom density on the separate sides of the nanostructure. They can similarly be considered as substrates and a similar equation to above can describe it for each surface of growth. 2
D side
n side
n side z direction
R side
2
n side t
side
where z is the length coordinate along the nanostructure (z=0 at one end and z=L at the other end).
232
The steady state solution obeys the flux boundary condition at the base of the n side ( 0 )
nanostructure (z=0, r=rw), D side
D s n s ( rw ) z
Js
r
side
, and the density
boundary condition at z=L, nw(L)=0, is given by
n side ( z )
R side
side
cosh( z /
side
)
cosh( L /
side
)
1
L
sinh
Js
side
z side
side
D side
cosh
,
L side
By taking the derivative of the solution for ns(r), we can see that the explicit expression for the adatom flux from the substrate surface to the nanostructure is given by the following
K1 Js
side
Rs
rside s
s
K0
rside s
For L>>z, n side ( z )
so, we have n side ( z )
R side
R side
Js side
side
and as z L, n side ( z )
side
D side
1
side
cosh( z /
side
)
cosh( L /
side
)
Js
2 R side
sinh side
D side
L
side
z side
side
cosh
L side
a
R side Js
b l e t ‟ s s u b s t i t u t e t h e f o l l o w i n g ,
c
side
side
side
D side 1 side
233
by combining like terms and differentiating with respect to z, we get
n side z z
a
c sinh cz
b tanh Lc
bc cosh cz
cosh Lc
Returning to our VLS equation A.2 we have,
Here, the first term represents the diffusion of material directly onto the nanowire side and the second term accounts for adatom diffusion from the substrate surface up along the nanowire. The third term accounts for the material deposited on the metal catalyst particle. W h e n w e l o o k a t t h e l o n g l i m i t , l a t e s t a g e g r o w t h , w h e n L > > λ w, we get the following:
F o r R = Ω R Ω R w = Top.
234
APPENDIX B TABLE OF VALUES B.1 Tables of Nanowire Core/Shell Measurements
110 min run
Width total measured (divs)
Width core measured (divs)
Width total in meters
Width core in meters
68414
4.6
0.5
1.27778E-08
1.38889E-09
36000
5.1
1.3
1.41667E-08
3.61111E-09
4.5
0.4
1.25E-08
1.11111E-09
5.6
1.2
1.55556E-08
3.33333E-09
5.8
1.3
1.61111E-08
3.61111E-09
68415
4
0.7
1.37931E-08
2.41379E-09
29000
4.1
0.8
1.41379E-08
2.75862E-09
4
0.5
1.37931E-08
1.72414E-09
4.3
0.7
1.48276E-08
2.41379E-09
4.7
1
1.62069E-08
3.44828E-09
68416
2.3
0.6
7.93103E-09
2.06897E-09
29000
2.6
0.7
8.96552E-09
2.41379E-09
2.5
0.9
8.62069E-09
3.10345E-09
2.8
0.8
9.65517E-09
2.75862E-09
3.5
0.5
1.2069E-08
1.72414E-09
3.3
1.1
1.13793E-08
3.7931E-09
68417
3.1
0.5
1.06897E-08
1.72414E-09
29000
4.1
1
1.41379E-08
2.9 2.8
0.4 0.5
0.00000001 9.65517E-09
Width total in nm 12.7777777 8 14.1666666 7 12.5 15.5555555 6 16.1111111 1
Width core in nm 1.38888888 9 3.61111111 1 1.11111111 1 3.33333333 3 3.61111111 1
Width shell 5.69444444 4 5.27777777 8 5.69444444 4 6.11111111 1 6.25
13.7931034 5 14.1379310 3 13.7931034 5 14.8275862 1 16.2068965 5
2.41379310 3
7.93103448 3 8.96551724 1 8.62068965 5 9.65517241 4 12.0689655 2 11.3793103 4
2.06896551 7 2.41379310 3 3.10344827 6 2.75862069 1.72413793 1 3.79310344 8
2.75862069 3.44827586 2 5.17241379 3 3.79310344 8
3.44828E-09
10.6896551 7 14.1379310 3
1.37931E-09 1.72414E-09
10 9.65517241
1.72413793 1 3.44827586 2 1.37931034 5 1.72413793
4.48275862 1 5.34482758 6 4.31034482 8 3.96551724
2.75862069 1.72413793 1 2.41379310 3 3.44827586 2
5.68965517 2 5.68965517 2 6.03448275 9 6.20689655 2 6.37931034 5
90 min run
235
2.93103448 3 3.27586206 9
4 8.96551724 1 9.31034482 8
2.6
0.8
8.96552E-09
2.75862E-09
2.7
0.4
9.31034E-09
1.37931E-09
68408
3.6
1.4
0.00000001
3.88889E-09
36000
3.1
0.9
8.61111E-09
2.5E-09
4.2
0.9
1.16667E-08
2.5E-09
4.4
1.2
1.22222E-08
3.33333E-09
3.9
1.5
1.08333E-08
4.16667E-09
68409
4
1.5
1.11111E-08
4.16667E-09
36000
4.6
2
1.27778E-08
5.55556E-09
4.5
1
1.25E-08
2.77778E-09
2.9
1
8.05556E-09
2.77778E-09
5.7
2
1.58333E-08
5.55556E-09
3.7
1.6
1.02778E-08
4.44444E-09
3.9
1.6
1.08333E-08
4.44444E-09
7.5
1.5
2.08333E-08
4.16667E-09
2
1.4
5.55556E-09
3.88889E-09
12.5 8.05555555 6 15.8333333 3 10.2777777 8 10.8333333 3 20.8333333 3 5.55555555 6
2.7
1.6
7.5E-09
4.44444E-09
7.5
68410
3.6
1.7
0.00000001
4.72222E-09
36000
2.4
0.9
6.66667E-09
2.5E-09
3.1
1.3
8.61111E-09
3.61111E-09
4.8
1.4
1.33333E-08
3.88889E-09
3
1.1
8.33333E-09
3.05556E-09
5.5
2.2
1.52778E-08
6.11111E-09
5.6
1.5
1.55556E-08
4.16667E-09
4.9 5.3
1.2 1.6
1.36111E-08 1.47222E-08
3.33333E-09 4.44444E-09
10 6.66666666 7 8.61111111 1 13.3333333 3 8.33333333 3 15.2777777 8 15.5555555 6 13.6111111 1 14.7222222
1 2.75862069 1.37931034 5
1 3.10344827 6 3.96551724 1
60 min run
236
10 8.61111111 1 11.6666666 7 12.2222222 2 10.8333333 3 11.1111111 1 12.7777777 8
3.88888888 9
2.5 3.33333333 3 4.16666666 7
3.05555555 6 3.05555555 6 4.58333333 3 4.44444444 4 3.33333333 3
4.16666666 7 5.55555555 6 2.77777777 8 2.77777777 8 5.55555555 6 4.44444444 4 4.44444444 4 4.16666666 7 3.88888888 9 4.44444444 4
3.47222222 2 3.61111111 1 4.86111111 1 2.63888888 9 5.13888888 9 2.91666666 7 3.19444444 4 8.33333333 3 0.83333333 3 1.52777777 8
4.72222222 2
2.63888888 9 2.08333333 3
2.5
2.5 3.61111111 1 3.88888888 9 3.05555555 6 6.11111111 1 4.16666666 7 3.33333333 3 4.44444444
2.5 4.72222222 2 2.63888888 9 4.58333333 3 5.69444444 4 5.13888888 9 5.13888888
3.4
1
9.44444E-09
2.77778E-09
68412
3.2
0.9
8.88889E-09
2.5E-09
36000
4.2
0.5
1.16667E-08
1.38889E-09
3.6
1.7
0.00000001
4.72222E-09
4.1
2
1.13889E-08
5.55556E-09
3.3
1.2
9.16667E-09
3.33333E-09
68411
2.4
0.6
8.27586E-09
2.06897E-09
29000
2.8
0.9
9.65517E-09
3.10345E-09
3.5
1.2
1.2069E-08
4.13793E-09
2.2
0.6
7.58621E-09
2.06897E-09
2.7
1.1
9.31034E-09
3.7931E-09
2.5
0.7
8.62069E-09
2.41379E-09
3.3
0.8
1.13793E-08
2.75862E-09
3.1
0.9
1.06897E-08
3.10345E-09
68418
2.2
1
7.58621E-09
3.44828E-09
29000
2.3
0.8
7.93103E-09
2.75862E-09
2.1
0.7
7.24138E-09
2.41379E-09
3
1.2
1.03448E-08
4.13793E-09
2
0.7
6.89655E-09
2.41379E-09
2.4
1.1
8.27586E-09
3.7931E-09
2.1
0.9
7.24138E-09
3.10345E-09
3
1.2
1.03448E-08
4.13793E-09
1.7
0.7
5.86207E-09
2.41379E-09
1.8
0.8
6.2069E-09
2.75862E-09
2 9.44444444 4
4 2.77777777 8
9 3.33333333 3
2.5 1.38888888 9 4.72222222 2 5.55555555 6 3.33333333 3
3.19444444 4 5.13888888 9 2.63888888 9 2.91666666 7 2.91666666 7
75min run 8.88888888 9 11.6666666 7 10 11.3888888 9 9.16666666 7 8.27586206 9 9.65517241 4 12.0689655 2 7.58620689 7 9.31034482 8 8.62068965 5 11.3793103 4 10.6896551 7
2.06896551 7 3.10344827 6 4.13793103 4 2.06896551 7 3.79310344 8 2.41379310 3
7.58620689 7 7.93103448 3
3.44827586 2
2.75862069 3.10344827 6
3.10344827 6 3.27586206 9 3.96551724 1 2.75862069 2.75862069 3.10344827 6 4.31034482 8 3.79310344 8
45 min run
237
7.24137931 10.3448275 9 6.89655172 4 8.27586206 9 7.24137931 10.3448275 9 5.86206896 6 6.20689655 2
2.75862069 2.41379310 3 4.13793103 4 2.41379310 3 3.79310344 8 3.10344827 6 4.13793103 4 2.41379310 3 2.75862069
2.06896551 7 2.58620689 7 2.41379310 3 3.10344827 6 2.24137931 2.24137931 2.06896551 7 3.10344827 6 1.72413793 1 1.72413793 1
2.4
1.2
8.27586E-09
4.13793E-09
2.1
0.7
7.24138E-09
2.41379E-09
1.7
0.6
5.86207E-09
2.06897E-09
2
0.7
6.89655E-09
2.41379E-09
1.8
0.5
6.2069E-09
1.72414E-09
68419
2.2
0.7
7.58621E-09
2.41379E-09
29000
2.2
1
7.58621E-09
3.44828E-09
1.8
0.7
6.2069E-09
2.41379E-09
2.3
1.1
7.93103E-09
3.7931E-09
2.8
1.3
9.65517E-09
4.48276E-09
2.5
1.3
8.62069E-09
4.48276E-09
2.5
1
8.62069E-09
3.44828E-09
1.8
0.9
6.2069E-09
3.10345E-09
2.1
0.9
7.24138E-09
3.10345E-09
2.5
0.9
8.62069E-09
3.10345E-09
68420
2
0.7
6.89655E-09
2.41379E-09
29000
3
1.4
1.03448E-08
4.82759E-09
1.9
0.8
6.55172E-09
2.75862E-09
2.5
1
8.62069E-09
3.44828E-09
2.3
0.9
7.93103E-09
3.10345E-09
3.2
1.2
1.10345E-08
4.13793E-09
2.6
0.9
8.96552E-09
3.10345E-09
2.2
0.7
7.58621E-09
2.41379E-09
2.4
0.9
8.27586E-09
2.8 2.7
2.2 2.5
1.47368E-08 1.42105E-08
8.27586206 9 7.24137931 5.86206896 6 6.89655172 4 6.20689655 2 7.58620689 7 7.58620689 7 6.20689655 2 7.93103448 3 9.65517241 4 8.62068965 5 8.62068965 5 6.20689655 2 7.24137931 8.62068965 5
4.13793103 4 2.41379310 3 2.06896551 7 2.41379310 3 1.72413793 1
2.06896551 7 2.41379310 3 1.89655172 4
2.41379310 3 3.44827586 2 2.41379310 3 3.79310344 8 4.48275862 1 4.48275862 1 3.44827586 2 3.10344827 6 3.10344827 6 3.10344827 6
2.58620689 7 2.06896551 7 1.89655172 4 2.06896551 7 2.58620689 7 2.06896551 7 2.58620689 7 1.55172413 8 2.06896551 7
2.24137931 2.24137931
2.75862069
2.41379310 3 4.82758620 7
3.10345E-09
6.89655172 4 10.3448275 9 6.55172413 8 8.62068965 5 7.93103448 3 11.0344827 6 8.96551724 1 7.58620689 7 8.27586206 9
2.75862069 3.44827586 2 3.10344827 6 4.13793103 4 3.10344827 6 2.41379310 3 3.10344827 6
2.75862069 1.89655172 4 2.58620689 7 2.41379310 3 3.44827586 2 2.93103448 3 2.58620689 7 2.58620689 7
1.15789E-08 1.31579E-08
14.7368421 1 14.2105263
11.5789473 7 13.1578947
1.57894736 8 0.52631578
2.24137931
30 minute run 68421 19000
238
3.5
2.8
1.84211E-08
1.47368E-08
3
2.2
1.57895E-08
1.15789E-08
3.4
2.4
1.78947E-08
1.26316E-08
68422
2.4
2.1
1.26316E-08
1.10526E-08
19000
5.6
4.9
2.94737E-08
2.57895E-08
4.3
3.5
2.26316E-08
1.84211E-08
4
3.4
2.10526E-08
1.78947E-08
3.2
2.4
1.68421E-08
1.26316E-08
68423
3.5
3.3
1.84211E-08
1.73684E-08
19000
2.8
2.5
1.47368E-08
1.31579E-08
2.6
1.7
1.36842E-08
8.94737E-09
2.7
1.8
1.42105E-08
9.47368E-09
2.6
2.1
1.36842E-08
1.10526E-08
3.3
2.5
1.73684E-08
1.31579E-08
2.6
2.4
1.36842E-08
1.26316E-08
239
2 18.4210526 3 15.7894736 8 17.8947368 4
4 14.7368421 1 11.5789473 7 12.6315789 5
9 1.84210526 3 2.10526315 8 2.63157894 7
12.6315789 5 29.4736842 1 22.6315789 5 21.0526315 8 16.8421052 6
11.0526315 8 25.7894736 8 18.4210526 3 17.8947368 4 12.6315789 5
0.78947368 4 1.84210526 3 2.10526315 8 1.57894736 8 2.10526315 8
18.4210526 3 14.7368421 1 13.6842105 3 14.2105263 2 13.6842105 3 17.3684210 5 13.6842105 3
17.3684210 5 13.1578947 4 8.94736842 1 9.47368421 1 11.0526315 8 13.1578947 4 12.6315789 5
0.52631578 9 0.78947368 4 2.36842105 3 2.36842105 3 1.31578947 4 2.10526315 8 0.52631578 9
B.2 Table of Averages from Measurements
Run Minutes
Average Core Width
45
3.154158215
60
3.888888889
75
3.149867374
90
2.356321839
110
2.581417625
30
13.83900929
Core Average Width Shell Shell Width deviation Width deviation 0.7786486 2.347870 0.42870783 73 183 9 0.9918650 3.738888 1.56155835 6 889 8 1.1634208 3.374963 0.73151952 48 159 2 0.8164524 3.879310 0.83661480 5 345 5 0.9335600 5.902777 0.34466679 43 778 8 4.0927808 1.594427 0.71750102 97 245 7
240
Core: Core Area/Shell Width Area 1.3434 0.089 11.1713 13 515 5 1.0401 0.069 14.3888 19 498 1 0.9333 0.061 16.1638 04 867 2 0.6074 0.037 27.0124 07 02 9 0.4373 0.023 42.2080 23 692 6 8.6796 0.251 3.97479 12 585 6


![Synthesis of novel pyrazolo[3,4-b]pyridine derivatives in ... - Arkivoc](https://p.pdfkul.com/img/300x300/synthesis-of-novel-pyrazolo34-bpyridine-derivative_5ad39d437f8b9a76398b4575.jpg)

![Synthesis of novel pyrazolo[3,4-b]pyridine derivatives in ... - Arkivoc](https://p.pdfkul.com/img/300x300/synthesis-of-novel-pyrazolo34-bpyridine-derivative_5acfdb317f8b9a165a8b45b3.jpg)


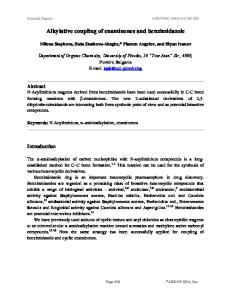
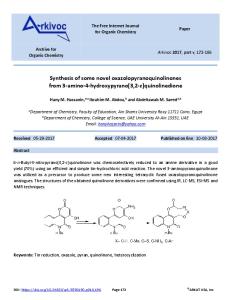

![Synthesis of novel bis[(tris(dimethylsilyl)methyl)alkyl] - Arkivoc](https://p.pdfkul.com/img/300x300/synthesis-of-novel-bistrisdimethylsilylmethylalkyl_5a13c02f1723dd21b814ec4f.jpg)


